HAL Id: hal-01053535
https://hal.archives-ouvertes.fr/hal-01053535
Submitted on 20 Feb 2015
HAL is a multi-disciplinary open access
archive for the deposit and dissemination of sci-entific research documents, whether they are pub-lished or not. The documents may come from teaching and research institutions in France or
L’archive ouverte pluridisciplinaire HAL, est destinée au dépôt et à la diffusion de documents scientifiques de niveau recherche, publiés ou non, émanant des établissements d’enseignement et de recherche français ou étrangers, des laboratoires
restoration: An application for amphibian conservation
in eastern France
Céline Clauzel, Cyrielle Bannwarth, Jean-Christophe Foltête
To cite this version:
Céline Clauzel, Cyrielle Bannwarth, Jean-Christophe Foltête. Integrating regional-scale connectivity in habitat restoration: An application for amphibian conservation in eastern France. Journal for Nature Conservation, Elsevier, 2015, 23, pp.98-107. �10.1016/j.jnc.2014.07.001�. �hal-01053535�
107. doi:10.1016/j.jnc.2014.07.001 »
Integrating regional-scale connectivity in habitat restoration: an application for
amphibian conservation in eastern France
Céline CLAUZEL, Assistant Professora (celine.clauzel@univ-fcomte.fr) - corresponding author
Cyrielle BANNWARTHb (cyrielle.bannwarth@lpo.fr)
Jean-Christophe FOLTÊTE, Professora (jean-christophe.foltete@univ-fcomte.fr) a ThéMA, CNRS - University of Franche-Comté
32 rue Mégevand
F-25 030 Besançon cedex France Tel : +33 381 66 59 54
b LPO Franche-Comté
Maison de l'Environnement de Franche-Comté 7 rue Voirin
F-25 030 Besançon cedex France Tel : +33 381 50 43 10
Abstract
Habitat restoration is one way of reducing landscape fragmentation, which is seen as a threat to biodiversity. It consists in renovating disused or degraded habitat patches or in creating new habitat patches in suitable areas. Currently, most restoration measures draw on the local knowledge of experts for selecting the best locations. For amphibian metapopulations like the European tree frog (Hyla arborea), the search for such locations must include regional-scale connectivity in order to maintain their viability.
We set up a systematic and cumulative protocol for adding new habitat patches to a pond network. Graph modelling is used to include regional-scale connectivity as a criterion to be maximized. Successive locations are tested systematically and connectivity is compared before and after the virtual addition of each new pond. The location that increases connectivity most is identified.
The results show that the priority areas identified by the model are similar to those suggested by local experts from a wildlife conservation association. The two approaches are complementary because they are applied on two different scales. The patch addition method can identify strategic areas for improving global connectivity by taking into account the regional scale. Experts’ knowledge can target the precise location within the identified area for creating new habitats based on local factors of the surrounding context. In addition, our method can be also used to prioritize locations already decided on by landscape managers. Consequently, this protocol appears to be a useful tool for guiding habitat restoration in the field.
Key words
Habitat restoration; connectivity; landscape graphs; amphibian conservation; Hyla arborea.
Highlights
We set up a systematic protocol for adding new habitat patches to a pond network. Graph modelling can be used to maximize broad-scale connectivity.
We compare results with locations suggested by experts for tree frog conservation. The priority areas identified by the model are similar to those suggested by experts The method provides guidance for habitat restoration measures.
Introduction
Landscape fragmentation was identified as a threat to biodiversity several decades ago (Fahrig, 2003). Its major causes include farming practices, urban development, and the construction of transportation infrastructures (Forman and Alexander, 1998). Significant reductions in the number and the size of habitat patches lead to the isolation of wildlife populations and so increase the risk of their extinction (Forman, 1995).
Landscape fragmentation can be prevented or reduced in several ways: by preserving existing elements (patches or corridors) that facilitate movements (Bodin and Saura, 2010); by improving the quality of such elements by increasing their size for example (Etienne, 2004); or by creating new habitat patches or new corridors by restoration measures (Hodgson et al., 2011; McRae et al., 2012).
This last approach can be included within the research domain of reserve network design (Moilanen, 2005). Many methods have been developed for the optimal selection of reserve sites, such as iterative heuristic algorithms, integer linear programming, or simulated annealing (Briers, 2002; Williams et al., 2005). Sites may be either as yet unprotected habitat patches (Cerdeira et al., 2010; Nikolakaki, 2004; Rae et al., 2007) or unsuitable areas that could be rehabilitated as habitat by operations such as reforestation (García-Feced et al., 2011; Orsi and Geneletti, 2010; Thomson et al., 2009). This type of analysis involves ranking sites by order of importance to select the one that maximizes some given criterion, such as the prioritization approach developed in Conefor (Saura and Torné, 2009) or Zonation (Moilanen, 2007) software.
In the case of animal populations living in fragmented habitats and which are highly dependent on fluxes between patches (Hanski and Ovaskainen, 2000), the search for new sites must integrate broad-scale connectivity as a criterion to be maximized in order to maintain regional connections and, consequently, the viability of populations (Briers, 2002; Moilanen et al., 2005). So, questions asked of landscape managers are: Where should these new habitat patches be placed to improve connectivity most? Is it better to create multiple patches in one place or several patches throughout the network? What is the minimum number of patches that should be created to restore connectivity? Currently, landscape managers lack guidance for answering these questions (Hodgson et al., 2011). An empirical approach based on experts’ opinions is often used (Bergsten and Zetterberg, 2013) because they have specific knowledge of the field and of local ecological processes. But such an empirical approach may be difficult to set up for a large study area because it requires huge amounts of data. Hodgson et al. (2011) have compared the effectiveness of several habitat creation strategies in facilitating the range expansions of species. Their results show that the targeted addition of new patches in the areas of lowest connectivity was often a better strategy than having local stakeholders identify locations empirically.
In this paper, we propose to set up a systematic protocol for adding new habitat patches using landscape-graph modelling. A graph is a set of nodes corresponding to habitat patches potentially connected by links representing the functional connectivity between each pair of nodes (Urban and Keitt, 2001). Experiments have shown that landscape graphs provide a simplified and relevant representation of ecological networks (Lookingbill et al., 2010; Minor and Urban, 2007).
Over the last decade, many applications of graph modelling have been developed, such as the prioritization approach to identify the most important elements in the network (Pereira et al., 2011; Rothley and Rae, 2005; Shanthala Devi et al., 2013; Pascual-Hortal and Saura, 2007; García-Feced et al., 2011; Crouzeilles et al., 2013), the impact assessment of transportation infrastructures (Clauzel et al., 2013; Fu et al., 2010; Girardet et al., 2013;
Gurrutxaga et al., 2011; Minor and Lookingbill, 2010; Tannier et al., 2012), or the improvement of ecological network quality (Benedek et al., 2011; García-Feced et al., 2011; Zetterberg et al., 2010).
For this last approach, most authors have explored the graph visually to identify the best locations for adding new elements (nodes or links). Recently, García-Feced et al. (2011) have developed a patch addition method to prioritize potential areas for reforestation. In Foltête et al. (2014), this method has been improved by using a search algorithm combined with a cumulative process that integrates changes induced by previously added patches before searching for the next one. Successive locations are tested systematically and connectivity before and after the virtual addition of each new patch is compared so that the location that increases connectivity most can be selected. Two aspects of connectivity are studied here, reachability and density, both of which are considered important properties for network resilience (Janssen et al., 2006). Reachability is improved by designing large-scale corridors reconnecting isolated clusters of a given habitat. Density is improved by increasing the redundancy of habitat patches and suitable corridors within the network.
The analysis is applied to a pond network in eastern France. The study area covers four valleys and many ponds, forming a strategic zone for amphibian conservation, especially for the endangered European tree frog (Hyla
arborea) (Paul, 2008). This species is characterized by a metapopulation structure in which dispersal processes
are significant (Arens et al., 2006; Pellet et al., 2004; Vos, 1999). Consequently, landscape connectivity is recognized as a key factor for the viability of tree frog populations and could be a relevant criterion for habitat restoration. In the Franche-Comté region, tree frog populations have been declining since the 1990s due to the destruction and fragmentation of their habitat (Bannwarth and Paul, 2011). Recently, landscape fragmentation has been further intensified by the implementation of a high-speed railway line. Local experts from a wildlife conservation association (LPO Franche-Comté) plan to create several new ponds in 2014 to support tree frog populations. Locations for new habitat patches identified by the model could be thus compared with those suggested by these experts. If the results differ, locations based on expert knowledge could be prioritized on the basis of the improvement in connectivity induced by each potential patch.
Materials and methods
Study area
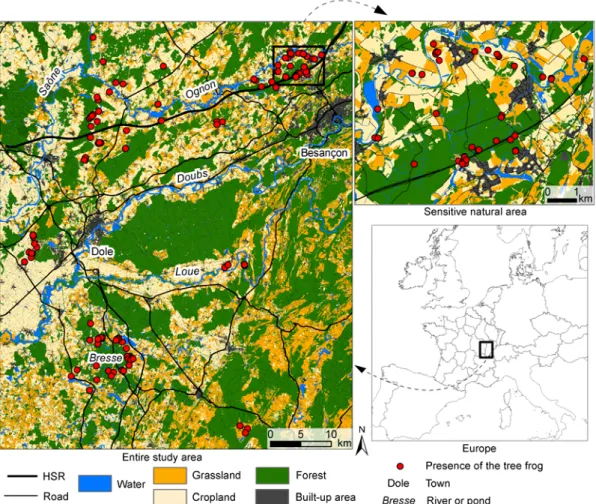
The study area (Figure 1) is a 4310 km² zone straddling the Franche-Comté and Burgundy regions in eastern France. The landscape is mostly rural, being dominated by agricultural land (46% of the study area) and forests (40%). The area is crossed by four valleys (from north to south, the Saône, Ognon, Doubs, and Loue) and a dense network of forest ponds named “Bresse” lies to the southwest. Protected areas (Natura 2000) and Natural Areas of Ecological, Wildlife and Floristic Interest (ZNIEFF) cover 28% of the zone. The urban cores are the towns of Besancon in the northeast and Dole in the west. The region is crossed by several transportation infrastructures including highways and the recent high-speed railway (HSR) line Rhine-Rhone.
In the northeast, a “sensitive natural area” (SNA) has been defined by the LPO Franche-Comté, in the context of the environmental policy of the General Council of the Doubs department. This 53 km² zone is considered fragile with highly-valued environmental features where special measures may be applied to protect the natural habitats (EEA, 2013). The landscape mosaic is dominated by forests, croplands, and built-up areas. Despite these unfavourable elements for amphibians, the area is one of the presence sites of several threatened species such as the yellow-bellied toad (Bombina variegate), the natterjack toad (Bufo calamita), the smooth newt (Lissotriton
vulgaris), the great crested newt (Triturus cristatus), the agile frog (Rana dalmatina) and the European tree frog in
the region (Bannwarth, 2010). Since December 2011, this area has been crossed by the Rhine-Rhône HSR, which is assumed to act as a barrier to wildlife movements, especially amphibians. A previous assessment of the impact of the HSR on species distribution (Clauzel et al., 2013) has shown that the infrastructure could potentially lead to a -20% to -80% fall in the probability of tree frog presence. In order to reduce the barrier effect, several wildlife-crossings were built and several habitat restoration measures implemented during construction. For amphibians, the creation of several new ponds is planned in 2014.
Figure 1. Location of the entire study area and the “sensitive natural area” (SNA) in eastern France. The land-use map was merged into five landscape categories to improve its readability. Tree-frog presence data were provided by field surveys conducted between 2006 and 2013.
Landscape data
The landscape was mapped by combining different data sources. French land cover databases (BD Topo IGN; BD Zones Humides DREAL) were used to identify forests, built-up areas, transportation infrastructures, rivers, wetlands, and ponds. The pond category includes all permanent and temporary water bodies located on river banks, wetlands, forests or on agricultural land. The agricultural census (BD Agreste 2010) was used to distinguish between grasslands and croplands in open areas. A morphological spatial pattern analysis (MSPA) (Vogt et al., 2007) was applied to the forest category to dissociate hedgerows, forest edges, and forest core areas. All these data elements were combined into a single raster layer with a resolution of 10 m to catch small elements such as hedgerows and ponds. An expansion of 1 pixel was applied on each side of major transport
infrastructures to reflect their actual width. Furthermore, the wildlife-crossings provided along the Rhine-Rhône HSR were represented by breaks in its path. Finally, a landscape map composed of 12 categories was obtained (Table 1).
Table 1. Resistance values for each of the 12 landscape categories.
Landscape categories Function Costs
Pond Aquatic habitat 1
Hedgerow Suitable 10
Forest edge Suitable 10
Grassland Suitable 10
River Suitable 10
Wetland Suitable 10
Wildlife-crossing Suitable 10
Forest core Unfavourable 100
Minor road and railway Unfavourable 100
Major road, highway and high-speed railway Barrier 1000
Cropland Barrier 1000
Built-up area Barrier 1000
Study species
The tree frog is classified as “least Concern” on the IUCN Red List of Threatened Species in view of its wide distribution from Iberia and France, eastwards to western Russia, and southwards to the Turkey (Kaya et al., 2009). However, its populations are significantly declining in western Europe and the species is classified as endangered on the IUCN Regional Red List for Franche-Comté (Paul, 2008). The direct destruction of breeding ponds and the fragmentation of its habitat are thought to be the main causes of its decline (Andersen et al., 2004; Cushman, 2006; Vos and Stumpel, 1996). In the Franche-Comté region, the species is irregularly distributed in some lowland areas. Almost 70% of species presence is concentrated in three areas: two pond sets at the north-eastern end of the region (not shown in the Figure 1) and in the western part, and an alluvial zone in the Ognon valley The study area in this paper is focused on the last area where tree frog density is decreasing according to the surveys of the LPO Franche-Comté association (Bannwarth and Paul, 2011). This zone now corresponds to the limit of the tree frog range upstream of the Ognon valley.
Like many other amphibians, the tree frog has a two-phase life cycle with aquatic and terrestrial stages. Breeding occurs during the spring in sunny shallow waters (Grosse and Nöllert, 1993). In agricultural environments, like our study area, the species often prefers edge habitats like ponds located on river banks, ditches, field and forest edges (Pellet et al., 2004). The presence of the tree frog does not seem to be related to pond size but rather to the amount of terrestrial habitat surrounding the pond (Vos and Stumpel, 1996). Although the aquatic habitat is essential for reproduction, the species spends most of its time in terrestrial habitats. These consist mostly of trees, shrubs, bushes, grasses and riparian vegetation (Stumpel, 1993).
Tree frogs move around frequently through daily changes of location, seasonal migrations, and dispersal events. These movements are facilitated by linear landscape structures or social attraction (Pellet et al., 2004; Vos, 1999). The dispersion of migrant individuals is a basic requirement for the viability of this species which is structured in metapopulations (Vos, 1999). A high density of interconnected ponds allows the tree frog to adapt to changes in the supply of breeding sites induced by temporary drying or filling processes (Mermod et al., 2010; Pellet et al., 2006a). The species is able to quickly colonize new breeding sites or to recolonize sites where it is
nearing extinction, making it a valuable species for studying habitat restoration measures (Mermod et al., 2010). Conservation measures planned for 2014 aim specifically to increase the density of breeding sites in order to maintain species viability.
The locations for these new ponds have been decided by the wildlife conservation experts of the LPO Franche-Comté. The area concerned by these measures, the SNA, contains a declining subpopulation of the tree frog. New habitat patches will be created near occupied ponds with a large population in order to maximize the chances of colonization (Mermod et al., 2010; Vos and Stumpel, 1996). The locations identified may be either areas suitable for creating new ponds or existing ponds that had been occupied some years ago and that simply require renovating to be potentially recolonized (Bannwarth and Paul, 2011).
Species presence data came from the surveys of the LPO Franche-Comté association conducted between 2006 and 2013. Tree frog presence was detected by listening for calling males during the breeding period (April to July) from sunset to midnight on warm, wet nights. Every pond known to be or to have been a breeding site and every suitable pond likely to become a breeding site was surveyed at least three times each year to increase the probability of detection (Pellet and Schmidt, 2005). In all, 435 ponds were sampled and 88 presence sites were observed for the entire study area.
The patch addition method
The patch addition method was applied using a two-stage process. First, a generic application was implemented for the entire pond network. The adding of new patches here aimed to improve network reachability by reconnecting certain isolated clusters at a regional level. This application was used to assess the variability of results depending on several parameters of the method. Second, a specific application focused on the pond network currently used by the tree frog. The aim here was to increase patch density in the SNA. This is consistent with tree frog conservation measures planned for 2014 in order to compare results provided by the model and locations suggested by experts. As the generic and the specific applications have different objectives, certain parameters need to be adjusted, especially the definition of graph nodes.
Landscape graph construction
Two graphs were constructed with a different definition of habitat patches in each of the two applications. In the first graph, nodes correspond to all ponds in the study area regardless of whether or not they are occupied by the tree frog. In the specific application, only breeding ponds permanently occupied by the tree frog, i.e. where species presence has been observed since 2006, are considered to be nodes. Ponds occasionally used (temporary or unsustainable water bodies) such as puddles or ponds on a construction sites are not taken into account. This is consistent with the expert approach because the search for locations is based strictly on the same set of existing patches. The results of both approaches are thus comparable.
Other parameters of graph construction were identical in both applications for the sake of simplification. The quality of habitat patches, i.e. capacity, was defined as the amount of suitable elements for tree frogs around ponds. Links were defined for the complete topology using cost distances.
Landscape categories were classified according to their resistance to tree frog movement, using the ecological literature and local experts’ opinions. Tree frog studies conducted in Switzerland and in the Netherlands (Angelone et al., 2011; Pellet et al., 2004; Vos and Stumpel, 1996) have shown that wooded grasslands and linear elements like hedgerows or forest edges facilitate movement and often provided the species’ terrestrial habitat. According to the field knowledge of local experts, rivers and wetlands are also considered suitable for
tree frog movements even if their permeability depends on the density of vegetation. Conversely, minor roads, railways and the shaded cores of forests tend to constrain movement. Finally, bare ground, built-up areas and major roads are considered highly impassable and are mostly avoided by the tree frog. In Clauzel et al. (2013), several tests were performed by varying the resistance values and the number of classes to find the model that best explained the occurrence of the tree frog in the Franche-Comté region. The results showed that highly contrasting values between favourable and unfavourable landscape categories were the most relevant. Consequently in this study (Table 1), ponds, i.e. the optimal habitat category, were assigned a cost of 1. Suitable landscape elements such as hedgerows or wetlands were assigned a low cost (10), unfavourable landscape elements a cost of 100, and barrier elements a high cost (1000).
The two graphs were thresholded at a distance of 2500 m corresponding approximately to the dispersal distance for the tree frog. This distance was selected in line with the previous study (Clauzel et al., 2013), in which several threshold distances were tested. The model using the distance of 2500 m proved the most relevant. Consequently, only links shorter than this distance were kept.
The patch addition process
The patch addition process developed by Foltête et al. (2014) began by computing a global metric quantifying the connectivity of the initial network. A sampling grid of a given resolution was then applied to the landscape map. A search algorithm tested each cell, one by one, by adding a virtual patch at its centroid and new links from this patch to other existing patches, only if the distance between them was lower than the distance used to threshold the graph. The global metric was computed again after each addition, together with its rate of variation. After testing all the cells, the algorithm validated the one for which patch addition produced the biggest increase in the metric value. The centroid of the selected cell was therefore considered as the best location for the first new patch. The process was repeated until the desired number of new patches was reached by integrating changes in the graph topology induced by the addition of previous patches. The search algorithm was spatially restricted to suitable areas for amphibian species, such as hedgerows, wetlands or grasslands, in order to avoid implementing a new patch in an irrelevant ecological context. Consequently, if the centroid of a cell was not covered by suitable elements, this cell was not tested and the search algorithm moved to the next one. Finally, the same method may also be applied on a set of existing points in order to prioritize locations already decided by landscape managers.
Global metric selection
In the two applications, the Probability of Connectivity index (Saura and Pascual-Hortal, 2007) was used as the criterion to be maximized to improve connectivity. The PC index is a global metric given the expression:
PC=(∑
ni=1∑
nj=1a
ia
jp*ij)/A²
where ai and aj are the capacities of the patches i and j, p*ij is the maximum probability of all potential paths between patches i and j, and A is the total area under study. pij is determined by an exponential function such that:
pij= exp(-αdij)
where dij is the effective distance between these patches and α is a constant expressing the intensity of the decrease in the probability of movement (p) with distance (d). As habitat restoration measures aim to improve connectivity at a broader scale, the value of α was determined such that pij=0.05 when dij=100 000, i.e. with a long distance arbitrarily chosen to be equal to the graph diameter. This adaptation of the PC index is similar to the
PC-infinite defined by Saura et al. (2011), which was used to characterize long-distance connectivity with regard to the overall network.
Graphab 1.2 software (Foltête et al., 2012) was used to construct the landscape graph and perform the patch addition. (Software available at http://thema.univ-fcomte.fr/productions/graphab/en-home.html)
Results
The generic application: improving the reachability of a global pond network
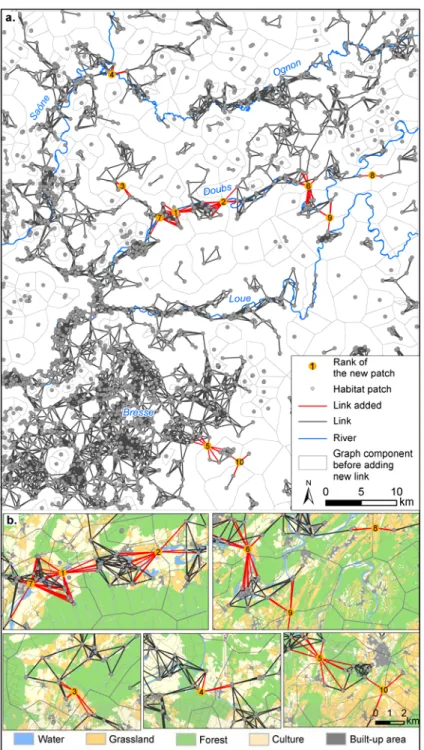
For the generic application, the graph thresholded at 2500 m representing the global pond network contains 309 components, 2808 habitat patches varying from 0.01 to 74 ha (mean 0.95 ha) and 7409 links (Figure 2a). One large component connects the ponds of “Bresse” in the southwest to the Loue and Saône rivers. The Ognon and Doubs valleys are more fragmented due to the greater presence of unfavourable elements such as croplands, forests, or built-up areas. Suitable elements cover 25% of the entire study area and form candidate areas in which to implement 10 new patches.
Figure 2: Location of ten new ponds maximizing connectivity using the landscape approach. Inserts at the bottom (b.) show the land use context around new patches identified by the model.
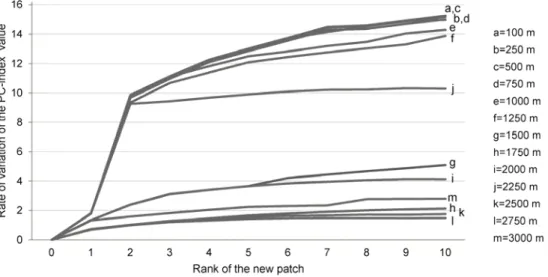
Several resolutions of the sampling grid ranging from 100 to 3000 m were tested to select the one that provided the best trade-off between the quality of results and computation times. Figure 3 shows two groups of curves with different behaviours. The first group corresponds to the smallest grid resolutions from 100 to 1250 m. These curves show a similar rate of variation of the PC-index value according to the rank of the new patch. The first two ponds contribute an increase of about 10% of connectivity followed by a smaller increase for the other ponds. The resolutions from 100 to 750 m provide exactly the same results with a rate of variation two points higher than that provided by the 1000 and 1250 m resolutions from the fifth new pond to the last one. The second group corresponds to the coarsest resolutions from 1500 to 3000 m, which provide much smaller increases in connectivity whatever the rank of the new patch. Moreover, large resolutions generate great variability in results probably in relation to the position of the grid on the landscape map. For instance, the 3000 m resolution provides a greater increase in connectivity than the 1750 m resolution. On the strength of these results, the 750 m-grid resolution was selected for analysing the location of new ponds added to the network across the entire study area.
Figure 3: Curves of the increase in connectivity provided by new ponds for several sampling grid resolutions. Connectivity degree is assessed by the index metric. Values represent the rate of variation of the initial PC-index value resulting from the addition of each new patch. The value of 0 corresponds to the initial state of the network before implementing any habitat patches.
All new patches, except the seventh one, reconnect small components to the main one (Figure 2). The first two patches connect several pond clusters, forming a broad corridor along the Doubs valley, which connects the Bresse ponds in the southwest to the Doubs and the Ognon rivers in the north. The combination of these two patches provides the greatest increase in connectivity because it concerns the two largest components of the network. The third new patch connects several ponds located in grassland to the main component. The fourth one improves functional connections between the Saône and the Ognon in the north of the study area. These two rivers which run very close together are fragmented for amphibians because of the high density of croplands and forests. The fifth and tenth patches reinforce connectivity in “Bresse” by reconnecting several outlying ponds to the main component. The sixth, eighth, and ninth patches create connections in the meanders of the Doubs and the Loue rivers. The seventh path does not reconnect any component to the main one, but it does reinforce connections in the Doubs valley.
The specific application: increasing patch density in the tree frog pond network
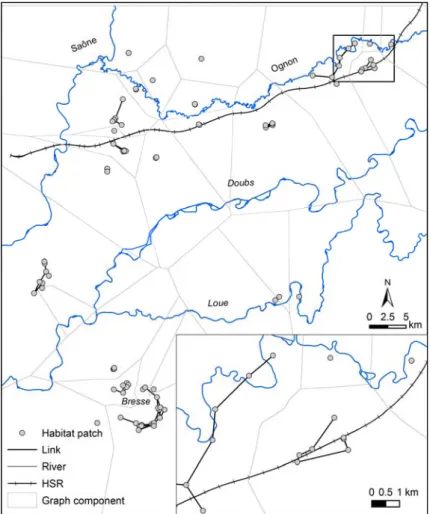
For the specific application, the graph thresholded at 2500 m representing the pond network currently used by the tree frog contains only 88 habitat patches, varying from 0.01 to 22 ha (mean 1.12 ha), and 90 links (Figure 4). The network is much more fragmented than the previous one, meaning that the species uses a very small part of the potential pond network. Three main presence sites are visible: in the upper parts of the Ognon river, corresponding to the SNA, in the forest ponds of “Bresse” and between the Saône and the Doubs rivers in the west of the study area. The tree frog is also present but more dispersed downstream on the Ognon river and in a meander of the Loue. The network representation using graph modelling shows that distances between these presence sites are too great to be covered by the majority of individuals. Subpopulations are consequently isolated and their viability is most probably endangered.
Figure 4: The network permanently used by the tree frog according to field surveys between 2006 and 2013. The insert on the bottom right shows the sensitive natural area (SNA).
In the SNA (Figure 5), the network is divided into four components, two of which have only one patch. The patch and link redundancy is very low due to the density of croplands and the HSR. The patch addition method is restricted to this area in order to compare modelling results and experts’ suggestions. As with the previous analysis, only suitable landscape elements (28%, i.e. 15 km²) are investigated by the search algorithm. As the area of candidate sites is smaller than before, several grid resolutions ranging from 50 to 500 m were tested. The 50 m resolution was selected, providing a more precise analysis. In addition to this analysis, ten locations
suggested by experts have also been prioritized on the basis of the increase in the PC value induced by each potential patch.
Figure 5: Location of new patches maximizing connectivity in the “sensitive natural area”. New ponds identified by the patch addition method are in white and their resulting links are black lines. New ponds suggested by experts are in black and their resulting links are black dashed lines. Note that the black patches 5, 6 and 7 would be provided by renovating existing ponds and not by creating new ponds. Numbers inside circles indicate the rank of the new patch added in terms of increased connectivity. The curves show the rate of variation of the of the initial PC-index value resulting from the addition of each new patch identified by our method (solid line) or by experts (dashed line).
The curves in Figure 5 show a similar variation in the PC values for each new patch implemented by the iterative process or suggested by experts. In both cases, the PC value increases greatly with the first two new patches (+55 %) and tends to gradually stabilize thereafter. From the fourth new patch, the modelling provides a rate of variation four points higher than that provided by the experts’ suggestions. Cartographic results show the areas to be improved as a matter of priority according to the two approaches. The central and the eastern parts appear to be the most strategic areas. In both approaches, the first new patch reconnects the two main components and increases the density of links between north and south, and east and west. The second new patch connects the isolated pond located in the northeast to the network. Patch 3 added by the model improves connections between south, centre and west, using forest edges and wildlife-crossings along the HSR. Patches 4, 6 and 7 suggested by experts are located a little further north but they have the same function. Two patches are added in the north by the two methods and they connect one patch to the rest of the network. Finally, in the southern part, one patch is created by the model against two patches suggested by experts, but they do not seem to improve the global connectivity of the network (Figure 5).
Discussion
This paper aimed to set up a systematic protocol for adding new habitat patches to a pond network in eastern France. Graph modelling is used to include broad-scale connectivity as a criterion to be maximized, which is a key factor for the ecological sustainability of landscapes and for the viability of metapopulations (Opdam et al., 2006). The Probability of Connectivity index (Saura and Pascual-Hortal, 2007) was used to improve the reachability of a regional network by reconnecting isolated clusters and to increase the density of nodes and links on a smaller network.
The patch addition method proposed by Foltête et al. (2014) goes beyond the prioritization of candidate sites developed by García-Feced (2011). It is cumulative and so includes changes made to graph topology by adding previous patches before searching for the next one. In addition, the iterative process can test all potential locations without the need for previously defined candidate sites. Consequently, it can be very useful in the creation of small habitat patches whose location is often not known beforehand. The search algorithm can also be spatially restricted to a given area by using a mask to implement new patches in a suitable ecological context or in other specific areas, e.g. on public land. In addition to cartographic results, a curve of the increased connectivity provided by new patches is generated. This graphical tool indicates the number of potential patches to be created in order to reach a given level of connectivity or to detect levels above which patch creation fails to increase connectivity sufficiently.
In this paper, the analysis was conducted by a two-stage process: a generic application to explain the method and to assess its sensitivity to grid resolution and a specific application to the tree frog’s habitat.
The generic application is easy to implement because it consists in analysing habitat patches without including species presence data. However, the use of graph modelling goes beyond the structural analysis by adjusting the graph parameters according to the behaviour of a given species or group of species, such as the maximum dispersal distance or the definition of habitat quality. The goal of the analysis is therefore to assess functional connectivity. While this approach can be used to improve the network of a species group dependent on the habitat under study, it does not necessarily reflect the network currently used by a given species. Consequently, it may not be appropriate for the conservation of a target species. The specific application is more restrictive, since it focuses on the network of a target species. Species presence data are therefore required to identify occupied
habitat patches. This approach is more realistic than the previous one but it requires more input data. Consequently, it may be more difficult to implement, particularly for poorly known species.
Graph modelling of the tree frog network has revealed several interesting points. First, over the entire study area, this species uses a very small part of the potential pond network. According to surveys conducted since 1980 (Pinston et al., 2000; Bannwarth, 2010), its presence has been much reduced in the study area now leaving several isolated subpopulations. The development of transport infrastructures, urban sprawl, and intensive agriculture have probably contributed to this decline. In the SNA, the HSR seems to have reduced connections between patches located on either site of the infrastructure, despite the provision of several wildlife-crossing structures. Only two of those structures in the west and in the central part are likely to be used by the tree frog. The creation of another wildlife-crossing structure in the east might usefully improve connectivity within the southern network, which remains vulnerable.
Tree frog conservation measures planned by the LPO Franche-Comté aim first to maintain the viability of subpopulations by regular restoration of many breeding ponds and management of corridors in this strategic area. After this first step, new habitat patches can be created outside the area to be colonized by dispersers from the nearest source population (Mermod et al., 2010). Finally, the long-term objective is to restore connections among what are now isolated subpopulations in the study area as a whole. From this perspective, the integration of regional connectivity in habitat restoration measures is of great importance for taking account of the potential flows at the inter-subpopulation level.
The patch addition method helps focus on priority areas for connectivity improvement in the SNA, i.e. for the first step in tree frog conservation measures. The priority areas identified by the model are similar to those suggested by experts. Potential new habitat patches lead to a significant increase in the number of connections in the central part of the SNA and a densification of habitat along the Ognon river. The prioritization of the experts’ locations suggests that there is no further improvement of global connectivity from the third new patch onward. This finding must be qualified because even if the global connectivity is not improved, simply increasing the number of habitat patches in a network is, in itself, beneficial for the viability of tree frog subpopulations (Mermod et al., 2010; Pellet et al., 2006b).
The field knowledge of experts helps refine certain modelling results such as the fifth patch added by the model, which is considered unrealistic because it would force the tree frog to cross the river to reach other patches. This is a limitation of this analysis, which is a trade-off between the realism of the modelling, data requirements and computation times. A finer resolution would have dissociated the banks of rivers (favourable) and the river itself (unfavourable). The sixth patch added by the model in the hedgerows located in a built-up area is also questionable. If species can reach other patches along the river, it would seem more appropriate to place this patch outside built-up areas, which have a negative impact on the tree frog presence (Pellet et al., 2004). In a similar way, the last patch added by experts appears isolated from existing ponds due to the high density of croplands. However, according to field surveys, this area has some plots of grassland that could support tree frog movements.
Finally, the two approaches appear complementary. The patch addition method used here can prioritize locations already decided by landscape managers or identify strategic areas for improving connectivity. Experts’ knowledge can target the precise location within this area for creating the habitat patch based on local factors such as microtopography, risk of pollution from intensive agriculture, proximity to transport infrastructures or shade of trees.
Our proposed method can guide habitat restoration measures but it must be used with care. The quality of results depends largely on the resolution of the sampling grid. Too coarse a resolution fails to provide relevant results. Several tests may be necessary to find the resolution that offers the best trade-off between stable results and computation times. In this study, the results suggests that the finer resolutions, i.e. at least half the graph threshold, are the most relevant. In addition, the use of a mask to select suitable areas for restoration can lead to a cell being excluded if its centre is not on the mask even if the rest of the cell is. This suggests the importance of having input data with a similar resolution. The method could be improved ecologically by integrating the source-sink concept (Pulliam, 1988) to be in accordance with tree frog metapopulation dynamics. This involves distinguishing these two types of habitat and building a directed graph in which only arcs from source to sink nodes are kept. Another way would be to start the analysis with only patches permanently occupied (as in this paper) and to restrict the search algorithm to ponds occasionally occupied (considered as “sink patches”). This would prioritize sites for restoration and maximize colonization probabilities because these sites have already been colonized in the past. The method proposed here for creating new ponds for amphibian conservation may also be applied to other types of habitat such as forest, or to other perspectives such as ecological compensation and mitigation measures for transport infrastructures.
Conclusion
In this paper, we have shown how the patch addition method combined with graph modelling can guide habitat restoration in the field. The proposed method consists of a systematic and cumulative process for identifying the best locations for creating new habitat patches. This search can be adjusted according to the objectives pursued by choosing the most appropriate connectivity metric. The results provide information about locations that increase network connectivity most and also about the number of new habitat patches to be created to reach a given improvement threshold of network quality.
Acknowledgments
This research has been funded by the French Ministry of Ecology, Energy, Sustainable Development and the Sea (ITTECOP Program) and is a part of the Jurassian Arc “Long Term Ecological Research Site” (http://zaaj.univ-fcomte.fr/spip.php?article1&lang=en). Field data about Hyla arborea and information about the SNA were provided by the work of the LPO Franche-Comté, in the context of the environmental policy of the General Council of the Doubs. The graph analysis was conducted as part of the Graphab 2 project managed by the USR 3124 MSHE C.N. Ledoux. Computations were performed on the supercomputer facilities of the “Mésocentre de calcul de Franche-Comté”. The authors thank the reviewers for their valuable comments.
Bibliography
Andersen, L.W., Fog, K., Damgaard, C., 2004. Habitat fragmentation causes bottlenecks and inbreeding in the European tree frog (Hyla arborea). Proceedings of the Royal Society B: Biological Sciences 271, 1293–1302. Angelone, S., Kienast, F., Holderegger, R., 2011. Where movement happens: scale‐dependent landscape effects
on genetic differentiation in the European tree frog. Ecography 34, 714–722.
Arens, P., Bugter, R., Westende, W. van’t, Zollinger, R., Stronks, J., Vos, C.C., Smulders, M.J.M., 2006. Microsatellite variation and population structure of a recovering Tree frog (Hyla arborea L.) metapopulation. Conservation Genetics 7, 825–835.
Bannwarth C., 2010. ENS Enjeux amphibiens entre Besançon et Ognon – Suivis des populations de Rainette arboricole, année 2009 – Fiches-actions 2010-2014. LPO Franche-Comté & Conseil général du Doubs.
Bannwarth, C., Paul, J.P, 2011. Rainette verte Hyla arborea - Fiche espèce Liste rouge Franche-Comté. LPO Franche Comté.
Benedek, Z., Nagy, A., Rácz, I.A., Jordán, F., Varga, Z., 2011. Landscape metrics as indicators: Quantifying habitat network changes of a bush-cricket Pholidoptera transsylvanica in Hungary. Ecological Indicators 11, 930–933.
Bergsten, A., Zetterberg, A., 2013. To model the landscape as a network: A practitioner’s perspective. Landscape and Urban Planning 119, 35–43.
Bodin, Ö., Saura, S., 2010. Ranking individual habitat patches as connectivity providers: Integrating network analysis and patch removal experiments. Ecological Modelling 221, 2393–2405.
Briers, R.A., 2002. Incorporating connectivity into reserve selection procedures. Biological Conservation 103, 77– 83.
Cerdeira, J.O., Pinto, L.S., Cabeza, M., Gaston, K.J., 2010. Species specific connectivity in reserve-network design using graphs. Biological Conservation 143, 408–415.
Clauzel, C., Girardet, X., Foltête, J.C., 2013. Impact assessment of a high-speed railway line on species distribution: Application to the European tree frog (Hyla arborea) in Franche-Comté. Journal of Environmental Management 127, 125–134.
Crouzeilles, R., Lorini, M.L., Grelle, C.E.V., 2013. The importance of using sustainable use protected areas for functional connectivity. Biological Conservation 159, 450–457.
Cushman, S.A., 2006. Effects of habitat loss and fragmentation on amphibians: A review and prospectus. Biological Conservation 128, 231–240.
Etienne, R.S., 2004. On optimal choices in increase of patch area and reduction of interpatch distance for metapopulation persistence. Ecological Modelling 179, 77–90.
European Environment Agency (EEA), 2011. Environmental Terminology and Discovery Service. Definition of “sensitive natural area”. Available at http://glossary.eea.europa.eu /terminology/ concept_html?term=sensitive%20natural%20area
Fahrig, L., 2003. Effects of habitat fragmentation on biodiversity. Annual review of ecology, evolution, and systematics 487–515.
Foltête, J.C., Clauzel, C., Vuidel, G., 2012. A software tool dedicated to the modelling of landscape networks. Environmental Modelling & Software 38, 316–327.
Foltête, J.C., Girardet, X., Clauzel, C., 2014. A methodological framework for the use of landscape graphs in land-use planning. Landscape and Urban Planning 24, 140-150.
Forman, R.T., 1995. Land mosaics: the ecology of landscapes and regions. Cambridge university press.
Forman, R.T.T., Alexander, L.E., 1998. Roads and Their Major Ecological Effects. Annual Review of Ecology and Systematics 29, 207–C2.
Fu, W., Liu, S., Degloria, S.D., Dong, S., Beazley, R., 2010. Characterizing the “fragmentation–barrier” effect of road networks on landscape connectivity: A case study in Xishuangbanna, Southwest China. Landscape and Urban Planning 95, 122–129.
Galpern, P., Manseau, M., Fall, A., 2011. Patch-based graphs of landscape connectivity: A guide to construction, analysis and application for conservation. Biological Conservation 144, 44–55.
García-Feced, C., Saura, S., Elena-Rosselló, R., 2011. Improving landscape connectivity in forest districts: A two-stage process for prioritizing agricultural patches for reforestation. Forest Ecology and Management 261, 154– 161.
Girardet, X., Foltête, J.C., Clauzel, C., 2013. Designing a graph-based approach to landscape ecological assessment of linear infrastructures. Environmental Impact Assessment Review 42, 10–17.
Grosse, W.R. and Nöllert, A., 1993. The aquatic habitat of the European tree frog, Hyla arborea, in: Stumpel, A.H.P. and Tester, U. (Eds.), Ecology and Conservation of the European Tree Frog. Proceedings of the 1st International Workshop on Hyla arborea. Institute for Forestry and Nature Research, Wageningen, The Netherlands, 37–45.
Gurrutxaga, M., Rubio, L., Saura, S., 2011. Key connectors in protected forest area networks and the impact of highways: A transnational case study from the Cantabrian Range to the Western Alps (SW Europe). Landscape and Urban Planning 101, 310–320.
Hanski, I., Ovaskainen, O., 2000. The metapopulation capacity of a fragmented landscape. Nature 404, 755–758. Hodgson, J.A., Thomas, C.D., Cinderby, S., Cambridge, H., Evans, P., Hill, J.K., 2011. Habitat re-creation
Kaya, U., Agasyan, A., Avisi, A., Tuniyev, B., Crnobrnja Isailovic, J., Lymberakis, P., Andrén, C., Cogalniceanu, D., Wilkinson, J., Ananjeva, N., Üzüm, N., Orlo,v N., Podloucky, R., Tuniyev S.. 2009. Hyla arborea. In: IUCN 2013. IUCN Red List of Threatened Species. Version 2013.2. www.iucnredlist.org
Janssen, M.A., Bodin, O., Anderies, J.M., Elmqvist, T., Ernstson, H., McAllister, R.R., Olsson, P., Ryan, P., 2006. Toward a network perspective of the study of resilience in social-ecological systems. Ecology and Society 11, 15.
Lookingbill, T.R., Elmore, A.J., Engelhardt, K.A.M., Churchill, J.B., Edward Gates, J., Johnson, J.B., 2010. Influence of wetland networks on bat activity in mixed-use landscapes. Biological Conservation 143, 974–983. McRae, B.H., Hall, S.A., Beier, P., Theobald, D.M., 2012. Where to Restore Ecological Connectivity? Detecting
Barriers and Quantifying Restoration Benefits. PLoS ONE 7, e52604.
Mermod, M., Zumbach, S., Lippuner, M., Pellet, P., Schmidt, B., 2010. Notice pratique pour la conservation de la rainette verte et de la rainette italienne Hyla arborea & Hyla intermedia. Karch-Centre de coordination pour la protection des amphibiens et des reptiles de Suisse. Neuchatel.
Minor, E.S., Urban, D.L., 2007. Graph theory as a proxy for spatially explicit population models in conservation planning. Ecological Applications 17, 1771–1782.
Minor, E.S., Lookingbill, T.R., 2010. A Multiscale Network Analysis of Protected-Area Connectivity for Mammals in the United States. Conservation Biology 24, 1549–1558.
Moilanen, A., 2005. Reserve selection using nonlinear species distribution models. The American Naturalist 165, 695–706.
Moilanen, A., Franco, A.M.., Early, R.I., Fox, R., Wintle, B., Thomas, C.D., 2005. Prioritizing multiple-use landscapes for conservation: methods for large multi-species planning problems. Proceedings of the Royal Society B: Biological Sciences 272, 1885–1891.
Moilanen, A., 2007. Landscape Zonation, benefit functions and target-based planning: Unifying reserve selection strategies. Biological Conservation 134, 571–579.
Nikolakaki, P., 2004. A GIS site-selection process for habitat creation: estimating connectivity of habitat patches. Landscape and Urban Planning 68, 77–94.
Opdam, P., Steingröver, E., Rooij, S. van, 2006. Ecological networks: A spatial concept for multi-actor planning of sustainable landscapes. Landscape and Urban Planning 75, 322–332.
Orsi, F., Geneletti, D., 2010. Identifying priority areas for Forest Landscape Restoration in Chiapas (Mexico): An operational approach combining ecological and socioeconomic criteria. Landscape and Urban Planning 94, 20– 30.
Pascual-Hortal, L., Saura, S., 2007. Impact of spatial scale on the identification of critical habitat patches for the maintenance of landscape connectivity. Landscape and Urban Planning 83, 176–186.
Paul J.P. (Coord.), 2008. Liste rouge des vertébrés terrestres de Franche-Comté LPO Franche-Comté & DIREN Franche-Comté.
Pellet, J., Hoehn, S., Perrin, N., 2004. Multiscale determinants of tree frog (Hyla arborea L.) calling ponds in western Switzerland. Biodiversity and Conservation 13, 2227–2235.
Pellet, J., Schmidt, B.R., 2005. Monitoring distributions using call surveys: estimating site occupancy, detection probabilities and inferring absence. Biological Conservation 123, 27–35.
Pellet, J., Schmidt, B.R., Fivaz, F., Perrin, N., Grossenbacher, K., 2006a. Density, Climate and Varying Return Points: An Analysis of Long-Term Population Fluctuations in the Threatened European Tree Frog. Oecologia 149, 65–71.
Pellet, J., Maze, G., Perrin, N., 2006b. The contribution of patch topology and demographic parameters to population viability analysis predictions: the case of the European tree frog. Population Ecology 48, 353–361. Pereira, M., Segurado, P., Neves, N., 2011. Using spatial network structure in landscape management and
planning: A case study with pond turtles. Landscape and Urban Planning 100, 67–76.
Pinston, H., Craney, E., Pépin, D., Montadert, M., Duquet, M., 2000. Amphibiens et reptiles de Franche-Comté. Atlas commenté de répartition. Observatoire régional de l’environnement de Franche-Comté. GNFC.
Pulliam, H.R., 1988. Sources, sinks, and population regulation. American naturalist 652–661.
Rae, C., Rothley, K., Dragicevic, S., 2007. Implications of error and uncertainty for an environmental planning scenario: A sensitivity analysis of GIS-based variables in a reserve design exercise. Landscape and Urban Planning 79, 210–217.
Rothley, K.D., Rae, C., 2005. Working backwards to move forwards: Graph-based connectivity metrics for reserve network selection. Environmental Modeling and Assessment 10, 107–113.
Saura, S., Pascual-Hortal, L., 2007. A new habitat availability index to integrate connectivity in landscape conservation planning: Comparison with existing indices and application to a case study. Landscape and Urban Planning 83, 91–103.
Saura, S., Torné, J., 2009. Conefor Sensinode 2.2: A software package for quantifying the importance of habitat patches for landscape connectivity. Environmental Modelling & Software 24, 135–139.
Saura, S., Estreguil, C., Mouton, C., Rodríguez-Freire, M., 2011. Network analysis to assess landscape connectivity trends: Application to European forests (1990–2000). Ecological Indicators 11, 407–416.
Shanthala Devi, B.S., Murthy, M.S.R., Debnath, B., Jha, C.S., 2013. Forest patch connectivity diagnostics and prioritization using graph theory. Ecological Modelling 251, 279–287.
Stumpel A.H.P. 1993. The terrestrial habitat of Hyla arborea. In: Stumpel A.H.P. and Tester U. (eds) Ecology and Conservation of the European Tree Frog. Proceedings of the 1st International Workshop on arborea. Institute for Forestry and Nature Research, Wageningen, The Netherlands, pp. 47–54.
Tannier, C., Foltête, J.-C., Girardet, X., 2012. Assessing the capacity of different urban forms to preserve the connectivity of ecological habitats. Landscape and Urban Planning 105, 128-139.
Thomson, J.R., Moilanen, A.J., Vesk, P.A., Bennett, A.F., Nally, R.M., 2009. Where and when to revegetate: a quantitative method for scheduling landscape reconstruction. Ecological applications 19, 817–828.
Urban, D., Keitt, T., 2001. Landscape connectivity: a graph-theoretic perspective. Ecology 82, 1205–1218. Vogt, P., Riitters, K.H., Estreguil, C., Kozak, J., Wade, T.G., Wickham, J.D., 2007. Mapping Spatial Patterns with
Morphological Image Processing. Landscape Ecology 22, 171–177.
Vos, C.C., 1999. A frog’s-eye view of the landscape: quantifying connectivity for fragmented amphibian populations. Wageningen.
Vos, C.C., Stumpel, A.H.P., 1996. Comparison of habitat-isolation parameters in relation to fragmented distribution patterns in the tree frog (Hyla arborea). Landscape Ecology 11, 203–214.
Williams, J.C., ReVelle, C.S., Levin, S.A., 2005. Spatial attributes and reserve design models: A review. Environmental Modeling & Assessment 10, 163–181.
Zetterberg, A., Mörtberg, U.M., Balfors, B., 2010. Making graph theory operational for landscape ecological assessments, planning, and design. Landscape and Urban Planning 95, 181–191.