HAL Id: insu-02993661
https://hal-insu.archives-ouvertes.fr/insu-02993661
Submitted on 16 Nov 2020
HAL is a multi-disciplinary open access
archive for the deposit and dissemination of
sci-entific research documents, whether they are
pub-lished or not. The documents may come from
teaching and research institutions in France or
abroad, or from public or private research centers.
L’archive ouverte pluridisciplinaire HAL, est
destinée au dépôt et à la diffusion de documents
scientifiques de niveau recherche, publiés ou non,
émanant des établissements d’enseignement et de
recherche français ou étrangers, des laboratoires
publics ou privés.
The Atmospheric Structure of the Ice Giant Planets
from In Situ Measurements by Entry Probes
Francesca Ferri, Giacomo Colombatti, Alessio Aboudan, Carlo Bettanini,
Stefano Debei, Ari-Matti Harri, Jean-Pierre Lebreton, Franck Montmessin,
Jean-Jacques Berthelier, Alice Le Gall, et al.
To cite this version:
Francesca Ferri, Giacomo Colombatti, Alessio Aboudan, Carlo Bettanini, Stefano Debei, et al..
The Atmospheric Structure of the Ice Giant Planets from In Situ Measurements by Entry Probes.
Space Science Reviews, Springer Verlag, 2020, 216 (8), pp.118. �10.1007/s11214-020-00749-9�.
�insu-02993661�
https://doi.org/10.1007/s11214-020-00749-9
The Atmospheric Structure of the Ice Giant Planets
from In Situ Measurements by Entry Probes
Francesca Ferri1· Giacomo Colombatti1· Alessio Aboudan1· Carlo Bettanini1· Stefano Debei1· Ari Matti Harri2· Jean Pierre Lebreton3· Franck Montmessin4· Jean Jacques Berthelier4· Alice LeGall4· Ronan Modolo4· Karen Aplin5· Athena Coustenis6
Received: 3 February 2020 / Accepted: 5 October 2020 © Springer Nature B.V. 2020
Abstract In situ measurements by an atmospheric entry probe allow for sounding and
in-vestigating atmospheric composition, structure and dynamics deep into the atmosphere of a Giant planet. In this paper, we describe an Atmospheric Structure Instrument (ASI) for an entry probe at Uranus and/or Neptune. The scientific objectives, the measurements and the expected results are discussed in the framework of a future opportunity for an NASA-ESA joint mission to the Ice Giant planets.
Keywords Uranus· Neptune · Ice Giant planets · Atmosphere · Atmospheric thermal
structure· Dynamics · Electricity · Measurements · Sensors
1 Introduction
The NASA space mission Voyager 2, launched in 1977, probed, through remote sensing techniques, the atmospheres of Uranus and Neptune, the two Ice Giant planets of our Solar System, during its flybys in 1986 and 1989 respectively.
The atmospheric temperature profiles were primarily retrieved from the Voyager radio occultations (Lindal et al.1987,1990); while both ground-based and Voyager thermal in-frared, solar and stellar occultation observations further constrained the atmospheric thermal structure (e.g. Marley and McKay1999). These temperature profiles are strongly dependent
In Situ Exploration of the Ice Giants: Science and Technology Edited by Olivier J. Mousis and David H. Atkinson
B
F. Ferri1 CISAS “Giuseppe Colombo”, Università degli Studi di Padova, Padova, Italy 2 Finnish Meteorological Institute (FMI), Helsinki, Finland
3 LPCE2, Orleans, France 4 LATMOS, Guyancourt, France 5 University of Bristol, Bristol, UK
on the assumed composition and mixing ratios and therefore are affected by large uncertain-ties.
An entry probe offers a unique opportunity for in situ sounding of the atmospheres of the Ice Giants (Mousis et al.2018) down to levels not reachable by remote sensing and with a vertical resolution not achievable by other means. In situ measurements provide ground truth for investigation of the atmospheric composition, structure and dynamics deep into the atmosphere (e.g. Galileo probe at Jupiter (Seiff et al.1996) and Huygens probe at Titan (Lebreton et al.2005)).
The exploration of Uranus and Neptune systems is considered of major interest for the scientific community both in Europe (through an ESA solicitation in the framework of the Cosmic Vision Program) and in the US (through NASA’s Planetary Science Decadals). On-going studies of a future opportunity favour a potential NASA-ESA joint mission to Uranus and/or Neptune and their moons. In this context, we describe an Atmospheric Structure Instrument (ASI) for the reference payload of an atmospheric entry probe at either or both Uranus and Neptune.
The Atmospheric Structure Instrument (ASI) is one of the two key instruments of the ref-erence payload of an atmospheric probe (Atkinson et al.2020, this issue) and would inves-tigate the atmospheric thermal structure, dynamics, and provide probe altitude and velocity for correlation and interpretation of all the other probe measurements.
The Ice Giant ASI presented here (hereafter IG-ASI), is a multi-sensor package designed to measure the physical quantities characterizing the atmosphere during the probe’s descent into Uranus and/or Neptune. Specifically, it is devoted to determining the density, tempera-ture and pressure profiles, as well as studying winds, turbulence and electrical properties.
Vertical profiles of atmospheric pressure and temperature would be retrieved from the deceleration measurements during entry, and from in situ measurements by means of sensors directly exposed to the atmospheric flow during the descent under parachute to below the 1 bar level. These measurements are essential to determine the thermal structure and will help to constrain the composition and dynamics of the atmosphere.
2 Uranus’ and Neptune’s Atmospheric Structure
Uranus and Neptune are nearly similar in mass, size and bulk composition, with the inte-rior made mainly by a small rocky core (silicate/iron nickel) and ices (e.g. water, ammonia, methane and traces of other hydrocarbons) (Hubbard et al.1995; Helled et al.2011; Nettel-mann et al.2013)
Their atmospheres are mainly composed of hydrogen and helium with traces of methane and small amounts of other hydrocarbons (i.e. by-products of the UV photo-dissociation of CH4in the upper atmosphere). Although Uranus and Neptune are two of the Giant planets
of the outer Solar system, their envelopes are much smaller than for those of the gas Giants (Jupiter and Saturn), accounting for less than 20% of the planet’s masses and not achieving the transition to metallic hydrogen (Guillot 2005). Moreover, unlike Jupiter and Saturn, their bulk composition is dominated by heavier elements that could be oxygen, carbon, nitrogen and sulphur, based on cosmic abundances. Since these species are thought to have been incorporated into the proto-planets primarily as ice at their locations – either as solids themselves or as gas trapped in water-ice clathrates depending on models (Mousis et al. 2018) – the term “Ice Giants” has been adopted. At present, however, there is probably very little ice in Uranus and Neptune, a supercritical fluid being the preferred phase of H2O at
The meteorology of the Ice Giant planets is driven by the balance between the intrinsic luminosity and absorption of sunlight by methane and aerosols in the upper troposphere. In contrast to the hazy, relatively featureless atmosphere of Uranus, Neptune’s atmosphere has active and visible weather patterns. Visual and infrared imaging from Voyager (Smith et al.1986,1989; Karkoschka and Tomasko2011; Karkoschka2015), the Hubble Space Telescope (Sromovsky et al.1995; Karkoschka1998; Sromovsky et al.2001; Karkoschka and Tomasko2011) and ground-based observatories (Roddier et al.1998; Sromovsky et al. 2000; Max et al.2003; Gibbard et al.2002,2003; Sromovsky and Fry2005; Irwin et al. 2011; Sromovsky and Fry2007; Sromovsky et al.2009,2015; Irwin et al.2016a,b) revealed that both Uranus and Neptune are dynamically active, despite their large distances from the sun. Due to its unusual inclination and negligible internal heat (e.g. Pearl and Conrath 1991), Uranus is much quieter, showing less cloud activity than Neptune with infrequent storms (Irwin2009), while Neptune’s disk was dominated by the Great Dark Spot at the time of the Voyager 2 flyby (Smith et al.1989; Sromovsky et al.1993) and exhibits rapidly varying cloud activity, zonal banding and dark ovals (e.g. Hueso et al.2017).
Additionally, both the planets experience seasonal variations; Uranus’ 98◦obliquity re-sults in extreme seasons compared to the more moderate 29◦obliquity of Neptune. These extremes in solar insolation have implications for atmospheric temperature, cloud formation, photochemistry and general circulation patterns (Hueso and Sanchez-Lavega2019).
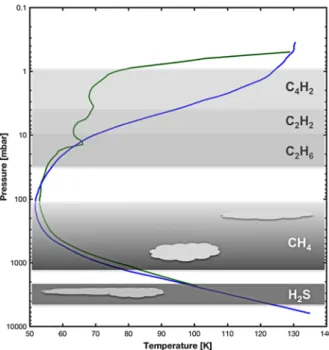
The atmosphere of Uranus and Neptune were sounded by the Voyager 2 spacecraft dur-ing the 1986 and 1989 flybys respectively (Stone1987; Abelson1989). The atmospheric thermal profile was primarily retrieved from the radio occultation measurements of refrac-tivity versus altitude (Lindal et al.1987and Lindal et al.1990) and further constrained by thermal infrared (Flasar et al.1987), solar (Herbert et al.1987; Bishop et al.1990; Stevens et al.1993; Broadfoot et al.1989) and stellar occultation (Lane et al. 1986; West et al. 1987) observations. Uranus and Neptune have similar temperature profiles (Fig.1), even though Uranus is much closer to the Sun; this is probably due to its lack of an internal heat source that also explains Uranus’ lower convective activity compared to the gas giants (Miner1990).
Below the 1 bar level, Voyager data hint at the presence of a condensed methane cloud layer on both the planets (Lindal1992; Sromovsky et al.2011).
Vertical profiles of temperature in the upper atmosphere above the cloud tops are re-trieved from mid-infrared and sub-millimetre remote sounding (e.g. Orton et al. 2014a; Fletcher et al.2014). The determination of these vertical profiles from occultation measure-ments depends on the atmospheric bulk composition, more specifically on the knowledge of the mean molecular mass. Furthermore these profiles are limited to pressures smaller than 1–2 bar or are strongly model-dependent.
3 In Situ Measurements by an Entry Probe
An entry probe permits sounding the atmosphere to study chemistry by tracking the thermal structure and chemical composition from high altitudes, down through the tropopause into the cloud-forming region. Complementary to remote sensing observations, in situ measure-ments provide ground truth for the investigation of the atmospheric structure and composi-tion and help to constrain the interior structure. They provide key informacomposi-tion on the origin and evolution of the Ice Giants, which is also relevant to some similar exoplanets (the first of many Ice Giant candidates around another star was reported in 2004 (Butler et al.2004)).
Fig. 1 Uranus’ and Neptune’s
atmospheric structure. A scheme of the haze and the cloud structure as observed by, or inferred from, remote sensing (e.g. Baines and Hammel1994; Irwin2009; Karkoschka and Tomasko2011) the temperature profile from Voyager 2 radio occultation of Uranus (green) and Neptune (blue) (Lindal1992)
The primary science objective for an Ice Giant probe is to measure the bulk composition, thermal and dynamic structure of the atmosphere. The key measurements to be performed would be the atmospheric temperature – pressure profile from the thermosphere down to at least 1–10 bar, the tropospheric abundances of minor species (e.g. C, N, S and P), noble gases (i.e. He, Ne, Xe, Kr and Ar) and the isotopic ratios (Mousis et al.2018,2020). These measurements would be addressed mainly by the two principal payload instruments (Atkin-son et al.2020, this issue): a mass spectrometer and the Atmospheric Structure Instrument (ASI).
The case for an entry probe on a future mission to the Ice Giants has been investigated in the context of a potential international cooperation (e.g. Mousis et al.2018; Hofstadter et al.2019) and resulted in several NASA and ESA mission studies [Ice Giants Pre-Decadal
Study Final Report, JPL D-100520, June 2017;1ESA M* Ice Giant CDF study2] and
pro-posals (Arridge et al.2014; Mousis et al. 2020). In this paper, we will refer to the probe mission scenario resulting from the ESA internal studies (ESA M* Ice Giant CDF study). The study aimed at assessing a possible European contribution to a NASA-ESA joint explo-ration mission to the Ice Giants (Saavedra Criado et al.2019) and designed an atmospheric probe targeted to reach 10 bar with a descent duration of 60–90 minutes.
Similar to the Galileo probe at Jupiter (Seiff et al.1996) or the Huygens probe at Ti-tan (Lebreton et al.2005), the Ice Giant probe will be released by a carrier into a ballistic trajectory to the planet. Entering into the atmosphere, the probe will be decelerated by atmo-spheric drag. During this high-speed entry phase, the descent module will be protected by its front shield from heating generated by the conversion of kinetic energy into thermal energy. Following peak deceleration, the parachute system will be deployed and the heat shield
jetti-1https://www.lpi.usra.edu/icegiants/mission_study/Full-Report.pdf.
soned so that the descent module will continue into the atmosphere under parachute making direct in situ measurements from an altitude of about 1 bar down to at least 10 bars.
4 The Atmospheric Structure Instrument for the Ice Giant Probe
(IG-ASI)
Based on the heritage of Huygens HASI at Titan (Fulchignoni et al.2002,2005), the Ice-Giant ASI (IG-ASI) experiment would consist of a multi sensor package designed to mea-sure the physical quantities characterizing Uranus’ or Neptune’s atmosphere during the entry and descent of the probe. The key measurements will be acceleration, pressure, temperature and electrical properties, all along the probe descent deep into the atmosphere in order to investigate atmospheric structure, dynamics and electricity.
The scientific measurements by IG-ASI will be aimed at addressing the following main scientific objectives:
• To determine the atmospheric profiles of pressure and temperature; • To evaluate the density and molecular weight profiles;
• To measure the tropospheric electric conductivity, ionisation, and charge carrier profiles; • To survey any AC and DC electric fields, and search for lightning.
IG-ASI data will also contribute to atmospheric composition analysis and to the study of vertical distribution of volatile gases and their condensed phases.
Moreover, they will provide a reference for calibration of remote sensing observations from the orbiter (e.g. radio occultations, IR spectroscopy) and for the other instruments aboard the probe, by establishing the entry trajectory, probe altitude and vertical velocity.
The IG-ASI will start to make measurements even before the probe encounters the at-mosphere during ballistic entry, when the probe will be protected by the heat shield. At-mospheric vertical profiles of density, pressure and temperature will be derived from the deceleration of the entry vehicle and later on from the direct measurements during the de-scent phase under parachute.
Starting from the 1 bar level, after the parachute deployment and front shield separation, direct measurements will be performed by sensors having access to the free atmospheric flow. IG-ASI will continue to make measurements as deep down into the atmosphere as the probe will be able to survive and transmit data back (a requirement for a minimum level of 10 bars was set for the Ice Giant probe design study).
4.1 IG-ASI Sensors and Measurements
In the current conceptual design, the main IG-ASI scientific measurements will be per-formed by four sensor units: a scientific accelerometer (ACC), the temperature sensors (TEM), the Pressure Profile Instrument (PPI) and the Atmospheric Electrical Package (AEP). The design, concept and sensor types of these subsystems are derived from the Huy-gens HASI (Ferri et al.2002; Fulchignoni et al.1997,2002); nevertheless their performance and requirements will be further developed by drawing upon the experience at Titan and the benefit of more than two decades of improvement in sensor technology. IG-ASI sensors, measurements, specifications and expected performance are reported in Table1.
Ta b le 1 IG-ASI subsystems/sensors specifications Sensor package A cron ym Sensor type Accurac y Resolution R ange Measured parameters Accelerometer A C C scientific accelerometer (X-Serv o ) 1% 1/10 µg a (high res.) 0.9/9 m g (lo w res.) 0–200 g (g = Earth’ s g ra vity) Atmospheric d eceleration Descent m onitoring T emperature sensors TEM Dual Platinum wire thermometers 0.5 K 0.02 K 40–330 K A tmospheric temperature
Pressure Profile Instrument
PPI Kiel type pressure probe + capaciti v e transducers 1% 0.1 P a 1 0 2–10 6P a Atmospheric p ressure
Atmospheric Electrical package
AEP C onducti vity probe 10% 10 − 14 Sm − 1 Conductivity : 10 − 14 –10 − 7Sm − 1 Atmospheric electric conducti vity AC /D C fi el d measurements 2 µ V/m (threshold) ∼ 10 mV/m Electric fi elds : 50 µV/m–100 V/m Quasi static DC fields ∼ 0 .1µ V /m H z − 1 / 2 ∼ 1µ V /m H z − 1 / 2 AC fi el d : ∼ 1– ∼ 60 Hz ∼ 20 Hz– ∼ 3k H z A C electric fi elds (Schumann resonance) and lightning aDepending on channel selection, and resolution m ode
4.1.1 Accelerometer (ACC)
The IG-ASI/ACC, a highly sensitive three-axis scientific accelerometer package, will start to operate just before atmospheric entry, sensing the drag experienced by the entry vehicle. The reference sensor is the Huygens HASI ACC X-Servo accelerometer (Honeywell QA2000-30). The servo accelerometer senses the displacement of a seismic mass and drives it back to its null position; the current required is a direct measurement of acceleration. This sensor package is gas filled and sealed to provide damping of the proof mass when deflected.
HASI ACC X-servo output was amplified by two non-inverting amplifiers providing two channel outputs. In addition, the two channels had a switchable range (i.e. high and low reso-lution) by mean of a single analogue switch. Accelerations were measurable in the 0–200 g range (where g is the Earth’s gravitational acceleration). Thermal drift was compensated using a temperature sensor in thermal contact with the accelerometer.
The resolution of the sensor was 1 to 10−5 m/s2(depending on the setting chosen) and the accuracy 1%. The acceleration was sampled at 100 Hz and down sampled at 25 Hz (i.e. one in every four of the original samples was stored) because of data volume issues. This sensor was the most sensitive accelerometer ever flown in a planetary entry probe (Zar-necki et al.2004; Hathi et al.2009); accelerometers included in the Inertial Measurement Unit (IMU) used in the Guidance, Navigation and Control (GNC) system of an entry ve-hicle [e.g. Mars Phoenix, MER Spirit and Opportunity, Curiosity, ExoMars Schiaparelli, InSight], could reach such sensitivity, but generally the raw data are not transmitted, with only processed attitude measurements (e.g. quaternions) provided as GNC outputs.
The IG-ASI/ACC package should include one sensor on each of the entry probe’s main axes (X, Y, Z), as close as possible to the centre of mass of the probe in its entry configura-tion. Alternatively, the scientific accelerometer could include only one servo accelerometer (oriented along the X-axis, the vertical axis with reference to the probe platform) and ob-tain the triaxial information by exploiting the inertial measurements performed by the entry probe’s GNC system.
Assuming the HASI ACC Servo performance at Titan (Hathi et al.2009), a noise of 0.3 µg (∼ 3 × 10⁻⁵ m/s2) is expected. The exact performance achievable, in terms of the accuracy of the derived atmospheric density will also depend on the probe ballistic coeffi-cients, entry speed and drag coefficient and their associated uncertainties.
During the entry phase, atmospheric profiles will be retrieved from the data recorded by the IG-ASI scientific accelerometer and by the on-board GNC instrumentation (namely two redundant Inertial Measurement Units (IMU), both including three accelerometers and three gyroscopes). The atmospheric density is directly related to the aerodynamic deceleration of the probe (−ap) and the density profile ρ(z) can be retrieved from inversion of the drag
equation. In order to perform the reconstruction, the physical properties (namely mass, di-mensions, cross-sectional area) and the aerodynamic characteristics (i.e. drag coefficients) of the entry probe and their temporal evolution with reference to the mission profile, should be known. Some of these inputs could be measured during ground testing and/or estimated by modelling (e.g. mass loss from ablation of the front shield during high-speed entry). The dynamics of the entry probe have to be reconstructed from flight data.
4.1.2 Temperature Sensors (TEM)
The IG-ASI temperature sensors (TEM) will utilize wire resistance thermometers as in the Huygens HASI and Galileo probe (Seiff and Knight1992). These will be exposed to the at-mospheric flow and effectively thermally isolated from the support structure. The principle
of measurement is based on the variation of the resistance of the metallic wire with temper-ature. The thermometer reading is made by resistance comparison with a reference resistor, powered by a pulsed current. The HASI-TEM was designed to have good thermal coupling between the sensor and the atmosphere and to achieve high accuracy and resolution.
The HASI-TEM was a dual element platinum resistance thermometer (Ruffino et al. 1996; Angrilli et al.1996), whose design was derived from the Galileo and Pioneer Venus sensors (Seiff and Knight 1992; Seiff et al. 1980a,b) and manufactured by Rosemount Aerospace Inc., Minnesota (US). Two HASI-TEM units were mounted on the Huygens probe. Each unit (Fig. 2) was composed of a platinum-rhodium truss cage frame expos-ing the two sensexpos-ing elements to the atmospheric flow. The principal sensor (fine) was a double platinum (Pt 99.999%) wire of 0.1 mm in diameter and 2 m in length, wound around a Platinum-Rhodium frame from which it was insulated by a thin layer of glass. The sec-ondary (coarse) sensor, designed as a spare unit in case of damage to the primary sensor, was a thinner Platinum wire (0.02 mm) annealed in the glass on the front side of the upper part of the frame. To reduce electric noise by including the HASI-TEM units in the global Huygens Faraday cage, the thermometers were coated with 25 µm of parylene and 1 µm of gold. The two redundant HASI-TEM units were mounted on a fixed stem (STUB) to en-sure their placement outside the boundary layer of the probe, exposed to the unperturbed atmospheric flow. The HASI-TEM was designed to exhibit a very short response time of the order of 0.5–0.1 s depending on the probe dynamical conditions (Saggin et al.1998).
Over the temperature range of 60–330 K, the HASI-TEMs were able to resolve 0.02 K with an accuracy of 0.1 K (Fulchignoni et al. 2005). For the case of the Ice Giants, the temperature range needs to be extended to lower temperatures (i.e. 50 K), and similar per-formance is expected.
4.1.3 Pressure Profile Instrument (PPI)
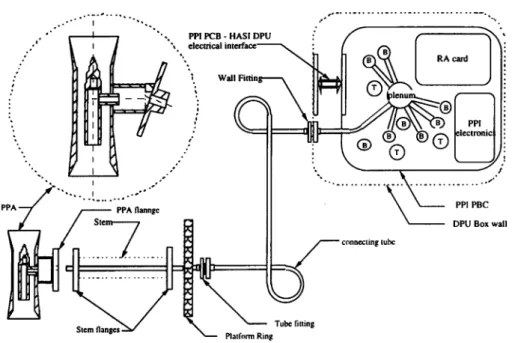
The IG-ASI Pressure Profile Instrument (PPI) will measure pressure during the descent un-der parachute with an accuracy of 1% and a resolution of 0.1 Pa (1 µbar). The atmospheric flow will be conveyed through a Kiel probe (a device to measure stagnation pressure) inside the enclosure where the sensors and conditioning electronics are located (Fig.3).
The transducers (Barocaps by Vaisala, Finland) are silicon capacitive sensors with pres-sure dependent dielectric. The prespres-sure sensor contains as dielectric a small vacuum cham-ber in between the two electrode plates, where the external pressure defines the distance between these plates. Detectors with diaphragms of different pressure sensitivity will be utilized to cover a pressure range of 102–106Pa. The pressure is derived from a frequency
measurement (within 3–20 kHz range); the measurements are internally compensated for thermal and radiation influences by monitoring sensor temperature by a Thermocap and two reference capacitors included within the Vaisala Multicap, respectively.
Other than being successfully flown as part of HASI on board the Huygens probe (Harri et al.2006), sensors of this type have been deployed on many Martian missions: NASA’s Mars Phoenix lander 2007 (Taylor et al.2008,2010), Mars Science Laboratory – Curiosity (as part of REMS – Rover Environmental Monitoring Station) (Gómez-Elvira et al.2012) and Mars2020 – Perseverance (as part of MEDA – Mars Environmental Dynamics Analyzer) (Rodriguez-Manfredi et al.2017) rovers, and in the ESA ExoMars Schiaparelli – DREAMS (Esposito et al.2018).
4.1.4 Atmospheric Electrical Package (AEP)
The Atmospheric Electrical Package (AEP) would include a set of sensors to measure at-mospheric conductivity, AC/DC electric fields and Schumann resonance with electrodes
Fig. 2 Huygens HASI temperature sensor (HASI-TEM): a dual element Platinum wire resistance
thermome-ter. The primary (fine) sensor was a double wire wound around a Platinum-Rhodium supporting frame; the secondary (coarse) sensor (S//N 1005) was annealed in the glass in the upper leg of the frame facing the atmo-spheric flow. A very thin layer of parylene and gold coated the TEM thermometer. Huygens HASI included two TEM sensors mounted at the opposite sides of one fixed stem (STUB) horizontally protruding from the descent module
accommodated on a minimum of one, optimally three stems attached to the vessel, allow-ing access to the unperturbed medium outside the boundary layer surroundallow-ing the probe. The instrument set-up should be investigated in order to have reliable measurements of the atmospheric electrical properties at Uranus and Neptune.
Starting from heritage of previous instrumentation flown in other in situ missions e.g. the Huygens HASI PWA (Permittivity, Wave and Altimetry) (Grard et al.2006) and the µARES experiment of the ExoMars Schiaparelli DREAMS environmental package (Esposito et al. 2018) (Fig.4), AEP should include a relaxation (RP), a Mutual Impedance (MI) probe and a passive E-field sensor (EF).
The conductivity of the atmosphere, related to the mobility and number of the various charge carriers, can be measured by different approaches. A simple Gerdien condenser could exploit the descent velocity for aspiration to optimise collection of charge carriers in the atmosphere and allow subsequent estimate of the conductivity. This measurement can be corroborated by determining the discharge time (relaxation) of charged electrodes (as on HASI PWA-RP and µARES). After the discharge, the natural DC electric field around the vessel can also be measured with the same electrodes. Thus a relaxation probe could mea-sure the quasi-static DC electric fields and conductivity by applying bipolar potentials and monitoring the discharge to equilibrium.
The modeled atmospheric electrical conductivity (Simoes et al.2012) is predicted to be large enough to allow direct AC and DC electric field (EF) measurements using a simple
Fig. 3 HASI PPI schematic. The Kiel probe, located at the tip of a fixed stem (STUB) conveyed the
atmo-spheric flow inside the pressurized vessel through a piping tube allowing for the gas inlet into the electronic box to the transducers. The Kiel tube straightened and collimated the flow around the Pitot orifice, so that accurate total pressure measurements could be performed despite change in flow inclination up to 45◦
dipolar EF probe concept like the one inherited from Earth balloon flights and employed on the ExoMars DREAMS/µARES. However, the theoretical profiles remain speculative and are dependent on a precise knowledge of gaseous and particulate composition. For this rea-son, alternative concepts, such as miniaturized field mill3(e.g. Harrison and Marlton2020),
for quasi-DC EF measurements should be envisaged in parallel to cope with the uncertain conductivity of Ice Giant atmospheres (e.g. Aplin et al.2020). Indeed, field mill sensitivity to DC field does not depend on the local conductivity. The DC and AC electric field could be measured with a passive electric field sensor or a mutual impedance probe formed by elec-trodes accommodated on masts composing vertical and horizontal dipole antennas to allow simultaneous measurement of both the horizontal and vertical electrical field components. A known alternating current, of a fixed frequency and for a known duration, is sent through the surrounding medium and passive electrodes measure the resulting voltage, from which the medium impedance can be determined.
A signal processing unit (possibly centralized in the main on-board computer) will man-age and amplify the signals, extract waveforms of bursts with different durations and tempo-ral resolutions, perform specttempo-ral analysis at various frequency ranges (1–200 kHz, or below 3 Hz to detect Schumann resonances), and to provide active pulses and sensor potential control to handle the conductivity and DC electric field measurements.
3An Electric field mill is an instrument to measure the strength of the electric fields in the atmosphere by means of a rotating shutter or chopped wheel (the “mill”) exposing or shielding electrodes. The electric current, which flows to and from the electrodes, is proportional to the strength of the electric field. This type of instrument can be deployed airborne and flown through anvil head clouds; by monitoring the atmospheric electric fields can be used for lightning protection (e.g. in rocket launch support or outdoor laboratories).
Fig. 4 Possible AEP configurations: Huygens HASI Permittivity Wave & Altimeter (PWA) (a) Location of
HASI booms on the Huygens probe (b) Scheme of PWA sensors and electronics boxes: TX transmitter elec-trodes, RX receiver elecelec-trodes, RP relaxation probes location on the Huygens probe; (c) view of one deployed boom showing the MI and RP antennas/electrodes. (d) The antenna of µARES, the electric field sensor of Ex-oMars 2016 Schiaparelli DREAMS. The spherical electrode located at the top of the 27-cm high antenna, adjusts itself to the local atmospheric potential, and the vessel structure is connected to the local ground (Déprez et al.2015)
4.2 Operations and Measurements
IG-ASI will be the only scientific payload instrument operating during the high-speed en-try phase when the vehicle is protected by the heat shield; the density profile causing the atmospheric drag will be retrieved from the deceleration of the entry probe. Given the at-mospheric mean molecular weight and the vehicle aerodynamics, vertical profile of density, pressure and temperature can be derived from the triaxial accelerometer data (from both the IG-ASI ACC and on-board GNC-IMU measurements) using similar techniques applied in other planetary atmospheres, e.g. Jupiter by Galileo (Seiff et al.1998), Titan by Huygens (Fulchignoni et al.2005; Aboudan et al.2008; Colombatti et al.2008), Venus by Pioneer probes (Seiff et al.1980a,1980b) and Mars (e.g. by Viking landers (Seiff and Kirk1976, 1977); by Pathfinder (Magalhães et al.1999); by MER Spirit and Opportunity (Withers and Smith2006), by Phoenix (Withers and Catling2010); by MSL Curiosity (Holstein-Rathlou et al.2016); by ExoMars2016 Schiaparelli (Aboudan et al.2018)).
The scientific accelerometer IG-ASI/ACC, placed at the centre of mass of the entry probe, will record the atmospheric deceleration with a resolution as high as 1 µg (∼ 10−5 m/s2). The ACC (as for the GNC sensors) will start the measurements before the nominal entry point in order to estimate and correct for the offset at zero gravitational acceleration.
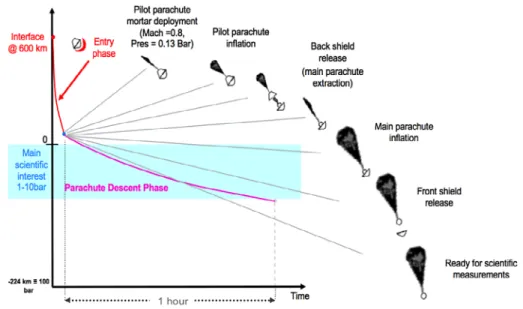
After the entry probe has decelerated to Mach ∼ 1 (0.8 nominal value from ESA M* Ice Giant CDF study), the entry phase will end and the parachute deployment sequence will begin (Fig.5). Over a few minutes, a pilot parachute will be fired to lift off the probe aft cover and inflate the main parachute. The front thermal shield will be released and fall away. From this moment, starting from 1 bar pressure level, the IG-ASI sensors will be exposed to the Ice Giant’s atmosphere. The probe descent will continue under parachute for almost one hour in order to reach at least the 10 bar level. Direct measurements of pressure, temperature and electrical properties will be performed in addition to the measurements by other scientific instruments on the probe payload.
The PPI and TEM sensors, accessing the unperturbed field outside the probe boundary layer, will monitor the total pressure and temperature. The Kiel probe and the PPI capacitive gauges will sample the pressure with a resolution of 0.1 Pa, while the TEM platinum wire
Fig. 5 The Ice Giant probe mission profile: entry, parachute deployment and descent sequence into the Ice
Giant’s atmosphere as from ESA M* Ice Giant Study (Saavedra Criado et al.2019)
thermometers will measure temperatures with an accuracy of 0.5 K and a resolution of 0.02 K. The TEM and PPI readings will need dynamical corrections in order to derive the static temperature and pressure values (Fulchignoni et al.1997). These corrections depend on the physical properties of the atmosphere and descent velocity and require the knowledge of the dynamical characteristics of the measurement and an iterative post-processing (see Saggin et al.1998,2001for TEM and Makinen et al.2006for PPI).
The temporal profiles of descent velocity and altitude will be derived from the pressure and measurements by PPI and TEM, while the data from ACC will contribute to determina-tion of the probe drift and its modetermina-tion induced by rotadetermina-tion and turbulence.
AEP electrodes, antennas and signal processing will allow for measurement of the atmo-spheric conductivity and detection of AC/DC electric fields, discharges (e.g. lightning) and electromagnetic waves along the probe trajectory.
The sampling of the IG-ASI sensors will be driven by a predetermined time sequence that will be triggered by expected environmental conditions during descent (e.g. switching to different sensitivity channels, sampling sequences, measurement modes, etc.). Sampling frequencies will be defined by a trade-off on the available telemetry data volume and rate, the expected environmental conditions and the requested spatial resolution for the scientific investigations (e.g. at least 3 or 4 measurements per scale height).
4.3 Calibration and Testing
The different IG-ASI sensors will be statically and dynamically calibrated, verified and qual-ified at sensor and subsystem level. Their performance will be demonstrated through the qualification and acceptance test campaigns, which include tests to simulate very extreme conditions that the system will experience during the launch, cruise phase and atmospheric entry. The possibility of stratospheric balloon drop tests similar to the Huygens/HASI bal-loon flight test campaigns (López-Moreno et al.2002; Fulchignoni et al.2002,2004; Ferri
et al.2003; Bettanini et al.2004; Lion Stoppato et al.2004; Gaborit et al.2004) will be considered for system validation and performance verification in dynamical conditions.
During the long cruise phase towards the Ice Giant planets, checkout will be regularly performed and the IG-ASI sensor performance will be monitored in order to check for any drift or degradation. Specifically in-flight data will be used in order to monitor the offset at zero g of the ACC sensor and estimate the long-term stability in the zero offset (Zarnecki et al.2004).
5 Expected Results
Atmospheric profiles along the entry probe trajectory will be measured from the exosphere4
to the deep troposphere. During entry, density will be derived from the probe deceleration; pressure and temperature will be computed from density, assuming hydrostatic equilibrium. Direct measurements of pressure, temperature and electrical properties will be performed under the parachute, after the front shield jettisoning, by sensors accessing the atmospheric flow. Atmospheric sounding will take place down to 10 bars, to assess the atmospheric ther-mal structure, and constraining the atmospheric stability, dynamics and effects on atmo-spheric chemistry.
Moreover, IG-ASI acceleration data during entry and then direct pressure and tempera-ture measurements during the parachute phase will allow for the reconstruction of velocity and altitude profiles that are essential to correctly interpret and correlate the results from all the Ice Giant probe science experiments and to calibrate the remote sensing measurements.
5.1 Atmospheric Structure
The determination of the temperature and pressure profile along the probe’s trajectory will help to define the atmospheric structure (Lindal et al.1987,1990; Lindal1992; Marley and McKay 1999; Conrath et al. 1991; Fletcher et al.2014), layer by layer composition (in particular to evaluate the CH4 mixing ratio in the stratosphere/saturation region (e.g.
Atreya and Ponthieu1983; Baines et al.1995; Romani et al. 1993; Baines and Hammel 1994; Lellouch et al.2015; Karkoschka and Tomasko2009,2011; Sromovsky et al.2011)), the vertical concentration profile of organic and inorganic compounds (Bézard et al.1991; Bishop et al.1990; Marten et al.1993; Encrenaz et al.2004; Cavalié et al.2014,2017; Burgdorf et al.2006; Orton et al.2014a,2014b), and the partial pressure of saturated gas, to detect the presence of tropospheric clouds or supersaturated layers (Baines and Hammel 1994; Karkoschka1998).
Determination of the vertical temperature profiles from the Voyager 2 observations de-pends strongly on the mean molecular weight and the assumed mixing ratios. In situ mea-surements from the 1 bar level will provide the mixing ratios for the different species (to be extrapolated to higher altitude) and direct pressure and temperature sampling down to pressure levels not reachable by remote sensing. Thus the IG-ASI will provide the local at-mospheric thermal profile that will be used as a reference for remote sensing and modeling (Cavalié et al.2020, this issue).
IG-ASI data will provide information about the energetic balance of the thermosphere and will contribute to investigation of the physics of the upper stratosphere where methane
4Exosphere is the upper most layer of the atmosphere merging with interplanetary space, where molecules are gravitationally bound to the body. The lower boundary of the exosphere is called the exobase or exopause, and this is the altitude where barometric conditions no longer apply.
dissociation takes place and possible hydrocarbon haze layers (e.g. as detected by Voyager 2 on Uranus Lindal et al.1987) are formed.
Upper atmospheric temperatures are currently characterized only broadly in altitude by a mixture of solar and stellar occultations measured by Voyager 2 Ultraviolet Spectrometer and ground-based visible observations, which have large uncertainties and internal incon-sistencies (Herbert et al.1987; Bishop et al.1992; French et al.1998; Young et al.2001; Uckert et al.2014). Temperature profiles through the thermosphere and upper stratosphere will allow for the detection of possible hydrocarbon haze layering and gravity waves propa-gating from the deeper atmosphere, thus contributing to understanding of upper atmospheric heating mechanisms.
Temperature and pressure from the thermosphere down to at least 10 bar will contribute to definition of the layer-by-layer composition where more complex organic compounds are built up and condensation can occur (Hueso and Sanchez-Lavega2019; Cavalié et al. 2020, this issue). By combining the IG-ASI data with the chemical and isotopic measure-ments from the mass spectrometer (Wurz et al.2020, this issue), the atmospheric chemical composition as a function of altitude and the vertical concentration profile of inorganic and organic compounds will be derived. Moreover, local accurate measurements of pressure and temperature will help to estimate mixing ratios by identifying condensates. Directly deter-mining vertical temperature gradients will constrain the clouds (CH4and NH3or H2S) at or
above 10 bars. Discrete clouds are regularly observed at red wavelengths (0.6–2.2 µm) as bright spots on both planets, but more frequently on Neptune than Uranus (Sromovsky et al. 2015; Hueso et al.2017). Most of the discrete cloud features are located at the altitude of the methane ice cloud (2–3 bar) or at deeper levels; but cloud tops could reach an altitude level of 300–600 mbar in Uranus and higher altitudes (20–60 mbar) at Neptune (Irwin et al. 2016a,b). This discrete cloud activity could be the result of convection, of uncertain origin. Around 2 bars, where CH4 condenses, convection may be inhibited by the mean
molec-ular weight gradient (Guillot1995); thus temperature lapse rate is a key measurement, to investigate the convective and condensation properties of the troposphere.
5.2 Atmospheric Dynamics
The IG-ASI in situ atmospheric density, pressure and temperature vertical profiles are essen-tial to investigate atmospheric structure and dynamics and will help to constrain and validate models.
Pressure and temperature measurements will constrain the structure and stability of the atmosphere, providing important context for understanding dynamics, mixing, energy and thermal balance. Variations in density, pressure and temperature profiles provide information on atmospheric stability and stratification. The atmospheric lapse rate can be used to identify the presence of condensation, aerosol and cloud layers, thus distinguishing between satu-rated and unsatusatu-rated, stable and conditionally stable regions, to determine stability regimes as a function of depth (e.g. radiative-convective boundary). Variations in the T (p) profile are strongly related to the presence of winds and turbulence and could provide information on thermal tides and gravity wave propagation and saturation.
Uranus and Neptune have strong zonal winds characterized by a broad retrograde equa-torial jet and nearly symmetric prograde jets at high latitude. Both have very intense winds (up to 400 m/s in the case of Neptune) as measured by tracking cloud features in Voyager 2 and remote sensing (e.g. Karkoschka2015; Sromovsky et al.1993,2015; Sanchez-Lavega 2017).
By monitoring the descent trajectory IG-ASI, together with the Doppler Wind Experi-ment (DWE) (Atkinson et al.2020, this issue), will sound deep winds below the observable
cloud level (2–3 bar). These measurements are essential to assess the vertical structure of the Ice Giant winds and for understanding the nature of the jets.
Probe accelerometer measurements will provide substantial information on both the up-per atmospheric temup-perature as well as detailed characterization of the gravity waves that, viscously damped in the thermosphere, could be the source of the high thermospheric tem-peratures, as found by the Galileo probe for Jupiter, (Young et al.1997,2005), for Titan by the Huygens probe (Fulchignoni et al.2005), and ground based stellar occultations (Sicardy et al.1999,2006).
Ground-based observations of stellar occultations by Neptune (Roques et al.1994) were used to infer temperature fluctuations that are coherent with gravity waves propagating up-ward in the stratosphere, which could be the dominant mechanism for atmospheric heating in the upper stratosphere and thermosphere.
In situ measurements will lead to a better understanding of the Ice Giants’ atmospheres
and constrain the interpretation of the processes that occur in them, specifically in terms of waves and thermal tides.
5.3 Atmospheric Electricity
Uranus’ and Neptune’s atmosphere undergo a constant bombardment of galactic cosmic rays (GCR) giving rise to free electrons and primary ions, making them slightly electrically con-ductive. These charged particles are subsequently captured by aerosols and form large ions. Friction, fragmentation or collisions during convective activity may increase the charged particle number. Charge separation due to convection and gravitational sedimentation in-duces electric fields within clouds and between cloud layers. This mechanism generates electrical discharges, and may lead to other phenomena that are present away from storms, such as potential gradients and atmospheric currents, generally defined as atmospheric elec-tricity.
The Ice Giants are far enough away from the Sun for GCR-related ionization mechanisms to be significant in cloud formation, yet both seem to be convective enough for lightning (Aplin et al.2020, this issue).
Electrical discharges at Uranus (Zarka and Pedersen1986) and Neptune (Gurnett et al. 1990) were detected by Voyager 2 during its flybys, but they seem to be weaker on Nep-tune (Kaiser et al.1991) although Neptune should be more convectively active than Uranus because of its large internal heat source. A search for lightning by Voyager 2 revealed four possible radio emissions, and sixteen whistler events detected by two different techniques in Neptune (Gibbard et al.1999). There is more evidence for Uranus lightning than for Nep-tune; however, lightning was never detected optically by Voyager. This may indicate that lightning is occurring too deep in the atmosphere (e.g. at the water and ammonium hydro-sulfide NH4SH cloud layers) to be seen at visible wavelengths.
Weaker atmospheric electrical processes may contribute to cloud formation through ion-induced nucleation producing cloud condensation nuclei (Moses et al.1992). Also long-term albedo fluctuations were interpreted as closely associated with ionization from cosmic rays at Neptune (Aplin and Harrison2016) and Uranus (Aplin and Harrison2017).
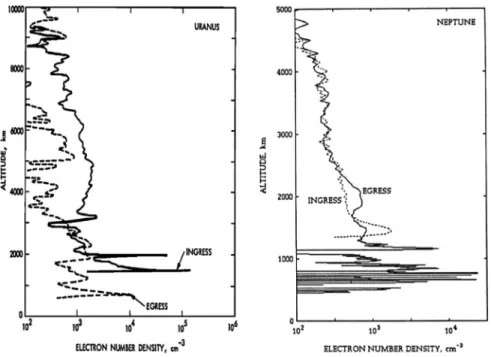
The vertical distribution of free electrons in Uranus’ and Neptune’s ionosphere were re-trieved from the Voyager 2 radio occultation data (Lindal et al.1987; Lindal1992). Figure6 shows the vertical electron number density profiles obtained by inverting the differential dispersive radio Doppler data acquired on Earth through the Deep Space Network Stations. Several dense, sharp ionization layers, as also observed at Jupiter and Saturn, are consistent with heavy ions of meteoritic, ring or satellite origin.
Fig. 6 Vertical electron number density profiles obtained from Voyager 2 radio occultation measurements of
Uranus from Lindal et al. (1987) and Neptune from Lindal (1992). Local altitude is relative to the 1-bar level
The atmospheric conductivity is probably higher than Earth’s owing to the fact that atmo-spheric molecules are not anticipated to form negative ions in the Ice Giants’ atmosphere. The electric conductivity profiles can be estimated starting from the plasma density model, and pressure and neutral profiles. Figure7shows the modelled conductivity profiles of the interior of Uranus and Neptune as function of the normalized radial distance (Simoes et al. 2012). The sharp variation in conductivity coincides with transition between outer, gaseous and intermediate (i.e. possibly liquid rock and ice mixture enveloping the rocky core) en-velopes. Conductivity may vary significantly, depending on the water ice mixing ratio in the gaseous envelope. For the same depth, a water mixing ratio of 0.1 (dotted lines on Fig.7) might increase the conductivity by as much as 10 orders of magnitude compared to that of a dry envelope. Thus water content strongly affects the atmospheric conductivity and con-sequently also the conditions for the propagation of the Tremendously and Extremely Low Frequency (TLF-ELF) electromagnetic wave excited by lightning (Schumann resonances) into the gaseous envelope (Simoes et al.2012).
Measuring DC and AC electric fields is fundamental to reveal the global atmospheric electricity on the Ice Giants, and possible lightning activity. Indeed, the detection of Schu-man Resonances in the ELF range could also provide unique observations related to the deep structure of the planet since both the frequency and the polarization of the electromagnetic waves depends on the depth of the highly conductive nucleus internal to the planet.
Measurements of atmospheric electrical properties during descent could contribute to investigation of moist convection, cloud formation and characterization, and possible elec-trical discharges, i.e. lightning. The in situ detection of lightning will allow determination of the relative strengths and frequencies of each discharge, enabling a deeper understanding of convective and cloud processes at the Ice Giants.
Fig. 7 Electric conductivity
profile of Uranus and Neptune as a function of the normalized radius, R, where R= 1 corresponds to the atmospheric pressure of 1 bar. Transition between the outer gaseous and intermediate envelopes is located at 0.8 R for Uranus and 0.84 R for Neptune. The dashed and dotted lines correspond to 0.001 and 0.1 water content (Simoes et al.2012)
Atmospheric conductivity measurements, combined with meteorological and chemical data, would also permit the extraction of charge distribution on aerosol particles, and im-prove understanding of the role of electrical processes in cloud formation, lightning genera-tion and aerosol microphysics.
6 Conclusions
In situ measurements by an entry probe at the Ice Giant planets will investigate the
atmo-sphere at deeper levels and higher resolutions than those attainable by remote sensing, as for the Galileo probe at Jupiter (Seiff et al.1996) and the Huygens probe at Titan (Lebreton et al.2005). The instrument described here, the Ice Giant Atmospheric Structure Instrument (IG-ASI) will determine vertical atmospheric profiles of density, pressure and temperature from the deceleration during the hypervelocity entry and carry out direct pressure, tem-perature and electrical conductivity measurements along the descent under parachute down below 1 bar level.
These profiles will provide an accurate determination of the atmosphere from the exobase into the troposphere, sounding altitudes never reached before. While temperature and pres-sure profiles from Voyage 2 and remote sensing observations are poorly constrained because of uncertainties in the detailed composition, IG-ASI in situ data will provide a unique and in-dependent definition of the stratosphere and tropospheric thermal structure and atmospheric parameters, enabling a precise characterization of the chemical structure.
Moreover the characterization of the atmospheric electrical properties and the capabil-ity to detect lightning will contribute to the investigation of the atmospheric physical and chemical processes, such as the description and formation of clouds and haze.
Although the in situ information gathered by IG-ASI will pertain to one site along the probe’s descent into the Ice Giant atmosphere, IG-ASI data, combined with remote sens-ing observations by a spacecraft (flyby or orbiter), will uniquely contribute to improve the
knowledge of the global atmospheric structure and dynamics and provide unique hints on the origin and evolution of the Ice Giant planets. It will also provide an important contribution to the understanding of exoplanets.
Following the success of the Huygens probe at Titan, we are looking at providing an im-portant payload element to be integrated in the framework of a joint effort and collaboration similar to the NASA-ASI-ESA Cassini-Huygens mission, aiming to further explore the Ice Giant planets. Beside the core sensors (i.e. measuring density, pressure and temperature), the configuration of the IG-ASI multi-sensor package will be investigated in order to achieve the scientific requirements and objectives for in situ exploration of the Ice Giant planets. At this point, the opportunity for including other types of sensor (e.g. an acoustic sounder for speed of sound measurements to determine the ortho- to para-hydrogen ratio (Atkinson et al.2020, this issue)) will be evaluated in order to possibly optimize, extend and enhance the scientific outcome of IG-ASI.
Acknowledgements We acknowledge all the support our national space agencies (ASI, CNES, FMI,
UKSA) and ESA is ensuring and will grant us in order to achieve this international space endeavour. We would like also to thank the ESA M* Ice Giant CDF (Critical Design Facility) study team for technical data and information on the atmospheric entry probe for the definition of the mission configuration, timeline and IG-ASI operations and duty cycle.
Publisher’s Note Springer Nature remains neutral with regard to jurisdictional claims in published maps
and institutional affiliations.
References
P. Abelson, Voyager 2 at Neptune and Triton. Science 246(4936), 1369 (1989).https://doi.org/10.1126/ science.246.4936.1369
A. Aboudan, G. Colombatti, F. Ferri, F. Angrilli, Huygens probe entry trajectory and attitude estimated simul-taneously with Titan atmospheric structure by Kalman filtering. Planet. Space Sci. 56, 573–585 (2008) A. Aboudan, G. Colombatti, C. Bettanini, F. Ferri, S. Lewis, B. Van Hove, O. Karatekin, S. Debei,
Ex-oMars 2016 Schiaparelli module trajectory and atmospheric profiles reconstruction: analysis of the on-board inertial and radar measurements. Space Sci. Rev. 214, 97 (2018).https://doi.org/10.1007/ s11214-018-0532-3. ISSN 0038-6308
F. Angrilli, G. Bianchini, S. Debei, G. Fanti, F. Ferri, M. Fulchignoni, B. Saggin, First results of performance test of temperature sensors of HASI instrument on Huygens-Cassini mission, in Proceedings SPIE, vol. 2803-09, Denver, 5–6 August, 1996 (1996), pp. 75–83
K. Aplin, R.G. Harrison, Determining solar effects in Neptune’s atmosphere. Nat. Commun. 7, 11976 (2016).
https://doi.org/10.1038/ncomms11976
K. Aplin, R.G. Harrison, Solar driven variation in the atmosphere of Uranus. Geophys. Res. Lett. 44, 12,083– 12,090 (2017).https://doi.org/10.1002/2017GL075374
K. Aplin, T. Nordheim, G. Fischer, A. Konovalenko, V. Zakharenko, Atmospheric electricity at the Ice Giants. Space Sci. Rev. 216, 26 (2020, this issue).https://doi.org/10.1007/s11214-020-00647-0
C.S. Arridge, N. Achilleos, J. Agarwal et al., The science case for an orbital mission to Uranus: exploring the origins and evolution of ice giant planets. Planet. Space Sci. 104, 122 (2014).https://doi.org/10.1016/ j.pss.2014.08.009
D.H. Atkinson, O. Mousis, T.R. Spilker et al., Model payload for Ice Giant entry probe missions. Space Sci. Rev. (2020, this issue).https://doi.org/10.1007/s11214-020-00738-y
S.K. Atreya, J.J. Ponthieu, Photolysis of methane and the ionosphere of Uranus. Planet. Space Sci. 31, 939– 944 (1983)
K.H. Baines, H.B. Hammel, Clouds, hazes, and the stratospheric methane abundance in Neptune. Icarus 109, 20–39 (1994)
K.H. Baines, M.E. Mickelson, L.E. Larson, D.W. Ferguson, The abundances of methane and ortho/para hy-drogen on Uranus and Neptune: implications of New Laboratory 4-0 H2quadrupole line parameters. Icarus 114, 328–340 (1995)
C. Bettanini, M. Fulchignoni, F. Angrilli, P.F. Lion Stoppato, M. Antonello, S. Bastianello, G. Bianchini, G. Colombatti, F. Ferri, E. Flamini, V. Gaborit, A. Aboudan, Sicily 2002 balloon campaign: a test of the HASI instrument. Adv. Space Sci. 33, 1806–1811 (2004)
B. Bézard, P.N. Romani, B.J. Conrath, W.C. Maguire, Hydrocarbons in Neptune’s stratosphere from Voyager infrared observations. J. Geophys. Res. 96, 18 (1991)
J. Bishop, S.K. Atreya, F. Herbert, P. Romani, Reanalysis of Voyager 2 UVS occultations at Uranus – hydro-carbon mixing ratios in the equatorial stratosphere. Icarus 88, 448–464 (1990)
J. Bishop, S.K. Atreya, P.N. Romani, B.R. Sandel, F. Herbert, Voyager 2 ultraviolet spectrometer solar occul-tations at Neptune – constraints on the abundance of methane in the stratosphere. J. Geophys. Res. 97, 11 (1992)
A.L. Broadfoot, S.K. Atreya, J.L. Bertaux, J.E. Blamont, A.J. Dessler, T.M. Donahue, W.T. Forrester, D.T. Hall, F. Herbert, J.B. Holbert, J.B. Holberg, D.M. Hunter, V.A. Krasnoposky, S. Linick, J.I. Lunine, J.C. McConnell, H.W. Moos, B.R. Sandel, N.M. Schneider, D.E. Shemansky, G.R. Smith, D.F. Strobel, R.V. Yelle, Ultraviolet spectrometer observations of Neptune and Triton. Science 246(4936), 1459–1466 (1989).https://doi.org/10.1126/science.246.4936.1459
M. Burgdorf, G. Orton, J. van Cleve, V. Meadows, J. Houck, Detection of new hydrocarbons in Uranus’ atmosphere by infrared spectroscopy. Icarus 184, 634–637 (2006)
R.P. Butler, S.S. Vogt, G.W. Marcy, D.A. Fischer, J.T. Wright, G.W. Henry, G. Laughlin, J.J. Lissauer, A Neptune-mass planet orbiting the nearby M dwarf GJ 436. Astrophys. J. 617, 580–588 (2004) T. Cavalié et al., The first submillimeter observation of CO in the stratosphere of Uranus. Astron. Astrophys.
562, A33 (2014)
T. Cavalié, O. Venot, F. Selsis, F. Hersant, P. Hartogh, J. Leconte, Thermochemistry and vertical mixing in the tropospheres of Uranus and Neptune: how convection inhibition can affect the derivation of deep oxygen abundances. Icarus 291, 1–16 (2017)
T. Cavalié, O. Venot, R. Bounaceur, J. Leconte, M. Dobrijevic, V. Hue, Y. Miguel, P. Wurz, O. Mousis, The deep composition of Uranus and Neptune from in situ exploration and thermochemical modeling. Space Sci. Rev. 216, 58 (2020, this issue).https://doi.org/10.1007/s11214-020-00677-8
G. Colombatti, P. Withers, F. Ferri, A. Aboudan, C. Bettanini, V. Gaborit, J.C. Zarnecki, A.J. Ball, B. Hathi, M.R. Leese, M.C. Towner, A.M. Harri, T. Makinen, P.F. Lion Stoppato, F. Angrilli, M. Fulchignoni, Reconstruction of the trajectory of the Huygens probe using the Huygens Atmospheric Structure Instru-ment (HASI). Planet. Space Sci. 56, 586–600 (2008)
B.J. Conrath, F.M. Flasar, P.J. Gierasch, Thermal structure and dynamics of Neptune’s atmosphere from Voyager measurements. J. Geophys. Res. 96, 18 (1991)
G. Déprez, F. Montmessin, O. Witasse, L. Lapauw, F. Vivat et al., Micro-Ares, an electric field sensor for ExoMars 2016, in European Planetary Science Congress 2015, Nantes, France (2015). EPSC2015-508. insu-01218682
T. Encrenaz, E. Lellouch, P. Drossart, H. Feuchtgruber, G.S. Orton, S.K. Atreya, First detection of CO in Uranus. Astron. Astrophys. 413, L5–L9 (2004)
F. Esposito, S. Debei, C. Bettanini, C. Molfese, I. Arruego Rodríguez, G. Colombatti, A-M. Harri, F. Montmessin, C. Wilson, A. Aboudan, P. Schipani, L. Marty, F.J. Álvarez, V. Apestigue, G. Bellucci, J-J. Berthelier, J.R. Brucato, S.B. Calcutt, S. Chiodini, F. Cortecchia, F. Cozzolino, F. Cucciarrè, N. Deniskina, G. Déprez, G. Di Achille, F. Ferri, F. Forget, G. Franzese, E. Friso, M. Genzer, R. Hassen-Kodja, H. Haukka, M. Hieta, J.J. Jiménez, J-L. Josset, H. Kahanpää, O. Karatekin, G. Landis, L. La-pauw, R. Lorenz, J. Martinez-Oter, V. Mennella, D. Möhlmann, D. Moirin, R. Molinaro, T. Nikkanen, E. Palomba, M.R. Patel, J-P. Pommereau, C.I. Popa, S. Rafkin, P. Rannou, N.O. Renno, J. Rivas, W. Schmidt, E. Segato, S. Silvestro, A. Spiga, D. Toledo, R. Trautner, F. Valero, L. Vázquez, F. Vivat, O. Witasse, M. Yela, R. Mugnuolo, E. Marchetti, S. Pirrotta, The DREAMS experiment onboard the Schi-aparelli Module of the ExoMars 2016 mission: 1 design, performances and expected results. Space Sci. Rev. 214, 103 (2018).https://doi.org/10.1007/s11214-018-0535-0. ISSN 0038-6308
F. Ferri, F. Angrilli, G. Bianchini, M. Fulchignoni (the HASI team), The Huygens Atmospheric Structure Instrument of Huygens probe on Cassini mission. Acta Astronaut. 50(4), 249–255 (2002)
F. Ferri, G. Colombatti, C. Bettanini, M. Antonello, S. Bastianello, A. Aboudan, P.F. Lion Stoppato, G. Bianchini, F. Angrilli, E. Flamini, V. Gaborit, M. Fulchignoni, Stratospheric balloon flight experiment campaign for the simulation of the Huygens probe mission: verification of HASI (Huygens Atmo-spheric Structure Instrument) performance in terrestrial atmosphere, in per AIDAA 2003: XVII
Con-gresso Nazionale AIDAA, Roma, 15–19 September (2003)
F.M. Flasar, B.J. Conrath, P.J. Gierasch et al., Voyager infrared observations of Uranus’ atmosphere: thermal structure and dynamics. J. Geophys. Res. 92(A13), 15011–15018 (1987)
L.N. Fletcher, I. de Pater, G.S. Orton, H.B. Hammel, M.L. Sitko, P.G.J. Irwin, Neptune at summer solstice: zonal mean temperatures from ground-based observations, 2003–2007. Icarus 231, 146–167 (2014)
R.G. French, C.A. McGhee, B. Sicardy, Neptune’s stratospheric winds from three central flash occultations. Icarus 136, 27–49 (1998)
M. Fulchignoni, F. Angrilli, G. Bianchini, A. Bar-Nun, M.A. Barucci, W. Borucki, M. Coradini, A. Couste-nis, F. Ferri, R.J. Grard, M. Hamelin, A.M. Harri, G.W. Leppelmeier, J.J. Lopez-Moreno, J.A.M. Mc-Donnell, C. McKay, F.H. Neubauer, A. Pedersen, G. Picardi, V. Pirronello, R. Pirjola, R. Rodrigo, C. Schwingenschuh, A. Seiff, H. Svedhem, E. Thrane, V. Vanzani, G. Visconti, J. Zarnecki, The Huygens Atmospheric Structure Instrument (HASI). ESA SP 1711, 163–176 (1997)
M. Fulchignoni, F. Ferri, F. Angrilli et al., The characterisation of Titan’s atmospheric physical properties by the Huygens Atmospheric Structure Instrument (HASI). Space Sci. Rev. 104, 395–431 (2002) M. Fulchignoni, A. Aboudan, F. Angrilli, M. Antonello, S. Bastianello, C. Bettanini, G. Bianchini, G.
Colom-batti, F. Ferri, E. Flamini, V. Gaborit, N. Ghafoor, B. Hathi, A-M. Harri, A. Lehto, P.F. Lion Stoppato, M.R. Patel, J.C. Zarnecki, A stratospheric balloon experiment to test the Huygens Atmospheric Struc-ture Instrument (HASI). Planet. Space Sci. 52, 867–880 (2004)
M. Fulchignoni, F. Ferri, F. Angrilli, A.J. Ball, A. Bar-Nun, M.A. Barucci, C. Bettanini, G. Bianchini, W. Borucki, G. Colombatti, M. Coradini, A. Coustenis, S. Debei, P. Falkner, G. Fanti, E. Flamini, V. Ga-borit, R. Grard, M. Hamelin, A.M. Harri, B. Hathi, I. Jernej, M.R. Leese, A. Lehto, P.F. Lion Stoppato, J.J. López-Moreno, T. Mäkinen, J.A.M. McDonnell, C.P. McKay, G. Molina-Cuberos, F.M. Neubauer, V. Pirronello, R. Rodrigo, B. Saggin, K. Schwingenschuh, A. Seiff, F. Simões, H. Svedhem, T. Tokano, M.C. Towner, R. Trautner, P. Withers, J.C. Zarnecki, In situ measurements of the physical characteristics of Titan’s atmosphere and surface. Nature 438, 785–791 (2005).https://doi.org/10.1038/nature04314
V. Gaborit, M. Fulchignoni, G. Colombatti, F. Ferri, C. Bettanini, Huygens/HASI 2002 balloon test campaign: probe trajectory and atmospheric vertical profiles reconstruction. Planet. Space Sci. 52, 887–895 (2004) S.G. Gibbard, E.H. Levy, J.I. Lunine, I. de Pater, Lightning on Neptune. Icarus 139, 227–234 (1999) S.G. Gibbard, H. Roe, I. de Pater, B. Macintosh, D. Gavel, C.E. Max, K.H. Baines, A. Ghez, High-resolution
infrared imaging of Neptune from the Keck telescope. Icarus 156, 1–15 (2002)
S.G. Gibbard, I. de Pater, H.G. Roe, S. Martin, B.A. Macintosh, C.E. Max, The altitude of Neptune cloud features from high-spatial-resolution near-infrared spectra. Icarus 166, 359–374 (2003)
J. Gómez-Elvira, C. Armiens, L. Castañer, M. Domínguez, M. Genzer, F. Gómez, R. Haberle, A.-M. Harri, V. Jiménez, H. Kahanpää, L. Kowalski, A. Lepinette, J. Martín, J. Martínez-Frías, I. McEwan, L. Mora, J. Moreno, S. Navarro, M.A. de Pablo, V. Peinado, A. Peña, J. Polkko, M. Ramos, N.O. Renno, J. Ricart, M. Richardson, J. Rodríguez-Manfredi, J. Romeral, E. Sebastián, J. Serrano, M. de la Torre Juárez, J. Torres, F. Torrero, R. Urquí, L. Vázquez, T. Velasco, J. Verdasca, M.-P. Zorzano, J. Martín-Torres, REMS: the environmental sensor suite for the Mars science laboratory rover. Space Sci. Rev. 170, 583– 640 (2012).https://doi.org/10.1007/s11214-012-9921-1
R. Grard et al., Electric properties and related physical characteristics of the atmosphere and surface of Titan. Planet. Space Sci. 54, 1124–1136 (2006)
T. Guillot, Condensation of methane, ammonia, and water and the inhibition of convection in giant planets. Science 269(5231), 1697–1699 (1995).https://doi.org/10.1126/science.7569896
T. Guillot, The interiors of giant planets: models and outstanding questions. Annu. Rev. Earth Planet. Sci. 33, 493–530 (2005)
D.A. Gurnett, W.S. Kurth, I.H. Cairns, L.J. Granroth, Whistlers in Neptune’s magnetosphere – evidence of atmospheric lightning. J. Geophys. Res. 95, 20967–20976 (1990)
A.-M. Harri, T. Makinen, A. Lehto, H. Kananpaa, T. Sili, Vertical pressure profile of Titan – observa-tions of the PPI/HASI instrument. Planet. Space Sci. 57, 1117–1124 (2006).https://doi.org/10.1016/ j.pss.2006.05.037
R.G. Harrison, G.J. Marlton, Fair weather electric field meter for atmospheric science platforms. J. Electrost.
107, 103489 (2020)
B. Hathi, A.J. Ball, G. Colombatti, F. Ferri, M.R. Leese, M.C. Towner, P. Withers, M. Fulchignoni, J.C. Zarnecki, Huygens HASI servo accelerometer: a review and lesson learned. Planet. Space Sci. 57, 1321– 1333 (2009)
R. Helled, J.D. Anderson, M. Podolak et al., Interior models of Uranus and Neptune. Astrophys. J. 726, 15 (2011).https://doi.org/10.1088/0004-637X/726/1/15
F. Herbert, B.R. Sandel, R.V. Yelle, J.B. Holberg, A.L. Broadfoot, D.E. Shemansky, S.K. Atreya, P.N. Ro-mani, The upper atmosphere of Uranus – EUV occultations observed by Voyager 2. J. Geophys. Res.
92, 15093–15109 (1987)
M.D. Hofstadter, A. Simon, S. Atreya et al., Uranus and Neptune missions: a study in advance of the next Planetary Science Decadal Survey. Planet. Space Sci. 177, 104680 (2019).https://doi.org/10.1016/ j.pss.2019.06.004
C. Holstein-Rathlou, A. Maue, P. Withers, Atmospheric studies from the Mars Science Laboratory Entry, Descent and Landing atmospheric structure reconstruction. Planet. Space Sci. 120, 15–23 (2016)
W.B. Hubbard, M. Podolak, D.J. Stevenson, The interior of Neptune, in Neptune and Triton, ed. by D.P. Cruikshank (University of Arizona Press, Tucson, 1995)
R. Hueso, A. Sanchez-Lavega, Atmospheric dynamics and vertical structure of Uranus and Neptune’s weather layers. Space Sci. Rev. 215, 52 (2019).https://doi.org/10.1007/s11214-019-0618-6
R. Hueso, I. dePater, A. Simon, A. Sánchez-Lavega, M. Delcroix, M.H. Wong, J.W. Tollefson, C. Baranec, K. deKleer, S.H. Luszcz-Cook, G.S. Orton, H.B. Hammel, J.M. Gómez-Forrellad, I. Ordonez-Etxeberria, L. Sromovsky, P. Fry, F. Colas, J.F. Rojas, S. Pérez-Hoyos, P. Gorczynski, J. Guarro, W. Kivits, P. Miles, D. Millika, P. Nicholas, J. Sussenbach, A. Wesley, K. Sayanagi, S.M. Ammons, E.L. Gates, D. Gavel, E. Victor Garcia, N.M. Law, I. Mendikoa, R. Riddle, Neptune long-lived atmospheric features in 2013–2015 from small (28-cm) to large (10-m) telescopes. Icarus 295, 89–109 (2017)
P. Irwin, Giant Planets of Our Solar System: Atmosphere, Composition, and Structure (Springer, Chichester, 2009)
P.G.J. Irwin, N.A. Teanby, G.R. Davis, L.N. Fletcher, G.S. Orton, D. Tice, J. Hurley, S.B. Calcutt, Multi-spectral imaging observations of Neptune’s cloud structure with Gemini-North. Icarus 216, 141–158 (2011)
P.G.J. Irwin, L.N. Fletcher, P.L. Read, D. Tice, I. de Pater, G.S. Orton, N.A. Teanby, G.R. Davis, Spectral analysis of Uranus’ 2014 bright storm with VLT/SINFONI. Icarus 264, 72–89 (2016a)
P.G.J. Irwin, L.N. Fletcher, D. Tice, S.J. Owen, G.S. Orton, N.A. Teanby, G.R. Davis, Time variability of Neptune’s horizontal and vertical cloud structure revealed by VLT/SINFONI and Gemini/NIFS from 2009 to 2013. Icarus 271, 418–437 (2016b)
M.L. Kaiser, M.D. Desch, W.M. Farrell, P. Zarka, Restrictions on the characteristics of Neptunian lightning. J. Geophys. Res. 96, 19 (1991)
E. Karkoschka, Clouds of high contrast on Uranus. Science 280, 570 (1998)
E. Karkoschka, Uranus’ southern circulation revealed by Voyager 2: unique characteristics. Icarus 250, 294– 307 (2015)
E. Karkoschka, M. Tomasko, The haze and methane distributions on Uranus from HST-STIS spectroscopy. Icarus 202, 287–309 (2009)
E. Karkoschka, M.G. Tomasko, The haze and methane distributions on Neptune from HST-STIS spec-troscopy. Icarus 211, 780–797 (2011)
A.L. Lane, C.W. Hord, R.A. West, L.W. Esposito, K.E. Simmons, R.M. Nelson, B.D. Wallis, B.J. Buratti, L.J. Horn, A.L. Graps, W.R. Pryor, Photometry from Voyager 2: initial results from the Uranian atmosphere, satellites and rings. Science 233(4759), 65–70 (1986).https://doi.org/10.1126/science.233.4759.65
J.P. Lebreton, O. Witasse, C. Sollazzo et al., An overview of the descent and landing of the Huygens probe on Titan. Nature 438, 758–764 (2005)
E. Lellouch, R. Moreno, G.S. Orton, H. Feuchtgruber, T. Cavalié, J.I. Moses, P. Hartogh, C. Jarchow, H. Sagawa, New constraints on the CH4 vertical profile in Uranus and Neptune from Herschel observations. Astron. Astrophys. 579, A121 (2015)
G.F. Lindal, The atmosphere of Neptune – an analysis of radio occultation data acquired with Voyager 2. Astron. J. 103, 967–982 (1992)
G.F. Lindal, J.R. Lyons, D.N. Sweetnam, V.R. Eshleman, D.P. Hinson, The atmosphere of Uranus – results of radio occultation measurements with Voyager 2. J. Geophys. Res. 92, 14987–15001 (1987) G.F. Lindal, J.R. Lyons, D.N. Sweetnam, V.R. Eshleman, D.P. Hinson, The atmosphere of Neptune – results
of radio occultation measurements with the Voyager 2 spacecraft. Geophys. Res. Lett. 17, 1733–1736 (1990)
P.F. Lion Stoppato, F. Ferri, C. Bettanini, G. Colombatti, M. Antonello, S. Bastianello, A. Aboudan, E. Flamini, V. Gaborit, J.C. Zarnecki, B. Hathi, A.M. Harri, A. Lehto, G. Bianchini, F. Angrilli, M. Fulchignoni, Stratospheric balloon flight experiment campaign for the simulation of the Huygens probe mission: verification of HASI performance in terrestrial atmosphere, in Proceedings of Planetary Probe
Atmospheric Entry and Descent Trajectory Analysis and Science, Lisbon, Portugal, October 6–9, 2003.
ESA-SP, vol. 544 (2004), pp. 303–309
J.J. López-Moreno, G.J. Molina-Cuberos, M. Hamelin, V.J.G. Brown, F. Ferri, R. Grard, I. Jernej, J.M. Jerónimo, G.W. Leppelmeier, T. Mäkinen, R. Rodrigo, L. Sabau, K. Schwingenschuh, H. Svedhem, M. Fulchignoni, The COMAS SOLA mission to test the Huygens/HASI instrument on board a strato-spheric balloon. Adv. Space Sci. 30(5), 1359–1364 (2002)
J.A. Magalhães, J.T. Schofield, A. Seiff, Results of the Mars Pathfinder atmospheric structure investigation. J. Geophys. Res. 104, 8943–89455 (1999)
T. Makinen, A-M. Harri, T. Tokano, H. Savijarvi, T. Siili, F. Ferri, Vertical atmospheric flow on Titan as measured by the HASI instrument. Geophys. Res. Lett. 33, L21803 (2006).https://doi.org/10.1029/ 2006GL026982