HAL Id: hal-00304088
https://hal.archives-ouvertes.fr/hal-00304088
Submitted on 9 Apr 2008HAL is a multi-disciplinary open access
archive for the deposit and dissemination of sci-entific research documents, whether they are pub-lished or not. The documents may come from teaching and research institutions in France or abroad, or from public or private research centers.
L’archive ouverte pluridisciplinaire HAL, est destinée au dépôt et à la diffusion de documents scientifiques de niveau recherche, publiés ou non, émanant des établissements d’enseignement et de recherche français ou étrangers, des laboratoires publics ou privés.
Diurnal temperature range over Europe between 1950
and 2005
K. Makowski, M. Wild, A. Ohmura
To cite this version:
K. Makowski, M. Wild, A. Ohmura. Diurnal temperature range over Europe between 1950 and 2005. Atmospheric Chemistry and Physics Discussions, European Geosciences Union, 2008, 8 (2), pp.7051-7084. �hal-00304088�
ACPD
8, 7051–7084, 2008
Diurnal temperature range over Europe
between 1950 and 2005 K. Makowski et al. Title Page Abstract Introduction Conclusions References Tables Figures ◭ ◮ ◭ ◮ Back Close Full Screen / Esc Printer-friendly Version
Interactive Discussion Atmos. Chem. Phys. Discuss., 8, 7051–7084, 2008
www.atmos-chem-phys-discuss.net/8/7051/2008/ © Author(s) 2008. This work is distributed under the Creative Commons Attribution 3.0 License.
Atmospheric Chemistry and Physics Discussions
Diurnal temperature range over Europe
between 1950 and 2005
K. Makowski, M. Wild, and A. Ohmura
Institute for Atmospheric and Climate Science, ETH Zurich, Zurich, Switzerland Received: 6 March 2008 – Accepted: 14 March 2008 – Published: 9 April 2008 Correspondence to: K. Makowski ([email protected])
ACPD
8, 7051–7084, 2008
Diurnal temperature range over Europe
between 1950 and 2005 K. Makowski et al. Title Page Abstract Introduction Conclusions References Tables Figures ◭ ◮ ◭ ◮ Back Close Full Screen / Esc Printer-friendly Version
Interactive Discussion
Abstract
It has been widely accepted that diurnal temperature range (DTR) decreased on a global scale during the second half of the twentieth century. Here we show however, that the long-term trend of annual DTR has reversed from a decrease to an increase during the 1970s in Western Europe and during the 1980s in Eastern Europe. The
5
analysis is based on the high-quality dataset of the European Climate Assessment and Dataset Project, from which we selected approximately 200 stations, covering the area from Iceland to Algeria and from Turkey to Russia for 1950 to 2005. We inves-tigate national and regional annual means as well as the pan-European mean with respect to trends and reversal periods. 17 of the 24 investigated regions including the
10
pan-European mean show a statistical significant increase since 1990 at the latest. Of the remaining 7 regions, 2 show a non-significant increase, 3 a significant decrease and the remaining 2 no significant trend. The long-term change in DTR is governed by both surface shortwave and longwave radiation, the former of which has undergone a change from dimming to brightening. Consequently, we discuss the connections
be-15
tween DTR, shortwave radiation and sulfur emissions which are thought to be amongst the most important factors influencing the incoming solar radiation through the primary and secondary aerosol effect. We find reasonable agreement between trends in SO2
emissions, radiation and DTR in areas affected by high pollution. Consequently, we conclude that the long-term trends in DTR are mostly determined by changes in
emis-20
sions and the associated changes in incoming solar radiation.
1 Introduction
Satellite and ground based measurements for Europe show that the mean surface air temperature has overall increased during the second half of the last century (Trenberth et al., 2007). In more detail for the 1950s and 1960s a characteristic phase of roughly
25
ACPD
8, 7051–7084, 2008
Diurnal temperature range over Europe
between 1950 and 2005 K. Makowski et al. Title Page Abstract Introduction Conclusions References Tables Figures ◭ ◮ ◭ ◮ Back Close Full Screen / Esc Printer-friendly Version
Interactive Discussion increase in the mean temperature was observed. The slow and later on enhanced
increase of the mean temperature is especially evident during the summer months (Trenberth et al., 2007) where the incoming shortwave radiation is one of the most dominant factors for the daily temperature development. This leads to the hypothesis, that changes in the incoming solar flux at the surface might be the key issue for the
5
temperature development between 1950 and 2000 (Wild et al., 2007). In contrast, from a monotonically increasing longwave radiative forcing a more linear temperature increase would have been expected.
Measurements of shortwave radiation at the surface, around the globe, have shown that the incoming flux has significantly decreased in nearly all and subsequently
in-10
creased in many of the investigated stations within the last 4 to 5 decades (Ohmura and Lang, 1989; Gilgen et al., 1998, Gilgen and Ohmura, 1999; Stanhill and Cohen, 2001; Roderick and Farquhar, 2002; Pinker et al., 2005; Wild et al., 2005).
The diurnal temperature range (DTR) is considered a suitable measure to investi-gate the counteracting effects of longwave and shortwave radiative forcing, because
15
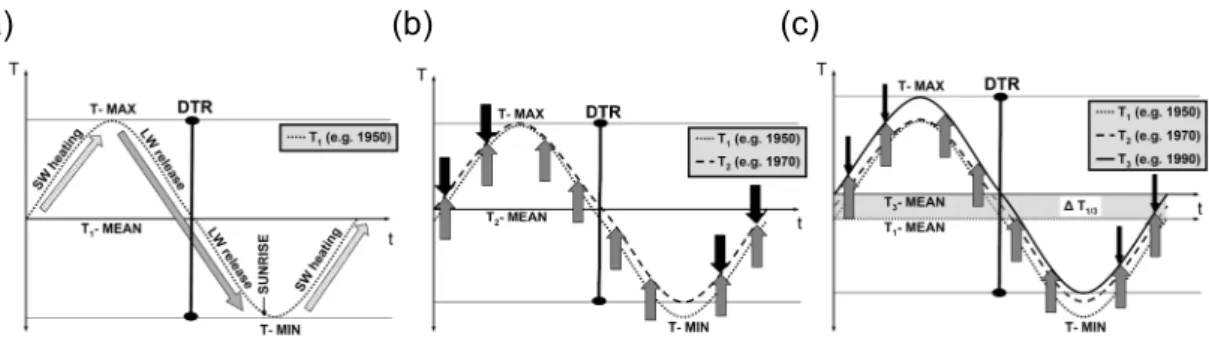
the diurnal minimum is closely related to the longwave radiative flux, while the diurnal maximum is predominantly determined by shortwave radiation (Fig. 1a). It is known that the DTR has been decreasing since the 1950s on a global scale due to a strong increase of diurnal minimum (Karl et al., 1984; Karl et al., 1993; Kukla and Karl, 1993). Comparison of GCM simulations with observations have shown that the DTR decrease
20
has been underestimated due to a strong increase in the modeled maximum temper-ature. However, a change in aerosol burden was not included (Braganza et al., 2004). The change in DTR has formerly been addressed mainly as consequence of cloud cover development, precipitation, change in irrigation and surface albedo or water va-por feedback (Stenchikov and Robock, 1995; Easterling et al., 1997; Dai et al., 1997;
25
Dai et al., 1999; Stone and Weaver, 2002; Vose et al., 2005; Engelhart and Douglas, 2005). Many of the cited publications have concluded that neither of these factors alone is likely to be the unique explanation of the observed changes in DTR (Easterling et al., 1997). We argue that shortwave radiation directly or via feedbacks is a major factor
ACPD
8, 7051–7084, 2008
Diurnal temperature range over Europe
between 1950 and 2005 K. Makowski et al. Title Page Abstract Introduction Conclusions References Tables Figures ◭ ◮ ◭ ◮ Back Close Full Screen / Esc Printer-friendly Version
Interactive Discussion for the changes in DTR since only the shortwave radiation – modulated by the
atmo-spheric aerosol burden – could exert a strong and sufficiently homogeneous effect to change DTR on a global scale (Liu et al., 2004; Wild et al., 2007).
Decrease of the solar flux and its relative cooling effect can been seen as a blocking action against the increase of temperature caused by the greenhouse effect.
Conse-5
quently the diurnal maximum temperature remains constant while the diurnal minimum is forced to increase (Fig. 1b). Recovery of surface solar radiation results in a removal of the blocking on diurnal temperature development thus leading to an increase of DTR and daily maximum respectively, thereby revealing the full extent of global warming (Wild et al., 2007) (Fig. 1c).
10
In the presented study a detailed investigation of this issue is conducted focusing on the European area where the best coverage with observational data can be found.
2 Data and methods
We chose the data products of the European Climate Assessment and Dataset Project (ECA&D-P) for an internally consistent investigation of the DTR evolution during the
15
recent decades. It contains freely available data for more than 600 stations with mini-mum and maximini-mum temperature measurements in daily resolution for different periods between about 1800 and today (Klein Tank et al., 2002).
Because the change of incoming radiative flux at the surface is considered very im-portant to DTR development and is measured since the 1950s, the complete second
20
half of the last century is investigated in this study. From the ECA&D-P dataset, all stations with data for the period 1951 up to 2003 (or up to 2005 where available) were selected and national means were calculated. The time series of a station was dis-missed if it had more than five years with data gaps or if two or more consecutive years were affected by these gaps. In addition, each time series was checked for jumps in the
25
DTR. If jumps of more than half degree were caused by filled data (from neighboring stations, performed during ECA&D-P), then the value was replaced by an interpolated
ACPD
8, 7051–7084, 2008
Diurnal temperature range over Europe
between 1950 and 2005 K. Makowski et al. Title Page Abstract Introduction Conclusions References Tables Figures ◭ ◮ ◭ ◮ Back Close Full Screen / Esc Printer-friendly Version
Interactive Discussion value, on monthly basis, if the measurement from the original site was available in the
previous and following year. In total less than 0.5% of the monthly values used in this study were interpolated due to missing data. Systematic errors probably due to data submission were found in all stations in Iceland, Denmark and Romania. For Iceland all data after 1998, for Denmark all data after 2002 and for Romania all data had to
5
be discarded and these were replaced by data which we obtained directly from the respective national meteorological service. For the region of the former Republic of Yugoslavia (FRY) all data prior to 1956 had to be dismissed due to quality issues. For Poland, data is available only since 1966. The temporal coverage was still considered sufficient to investigate decadal changes in DTR.
10
To obtain a sufficient number of stations for the calculation of regional annual means (Fig. 2), station measurements were grouped either nationally or by averaging over several small nations. Netherlands, Luxembourg and Belgium were drawn together as BeNeLux, likewise the states of the FRY; Estonia, Lithuania and Latvia were grouped as Baltic States, Slovakia and the Czech Republic to former Czechoslovakia (FCZS).
15
Conversely, Germany was divided into an eastern and a western part according to the boarder line from the pre-1989 period. This is to take account of the different de-velopment of atmospheric aerosol burden in the two countries, which depends mainly on the industrial emissions within the range of some tens to hundreds of kilometers upstream. The overall resulting data coverage is indicated by the small blue crosses
20
shown in Fig. 3, identifying 189 (168 with coverage 1956–2003) out of the original 604 ECA&D-P stations satisfying the criteria described above.
Subsequently these national annual mean time series were fitted by polynomials up to fourth order, to facilitate the characterization and quantification of the DTR trend (Fig. 2). The rational for fitting polynomial trend models was investigated by applying
25
multiple regression analysis and control of lagged autocorrelation within the residu-als to assure stationary white noise. The regression analysis, followed by calculation of statistical significance level (1–P-values; given in %) based on a standard T-test was performed for every coefficient for fits between first order (linear) and fourth
or-ACPD
8, 7051–7084, 2008
Diurnal temperature range over Europe
between 1950 and 2005 K. Makowski et al. Title Page Abstract Introduction Conclusions References Tables Figures ◭ ◮ ◭ ◮ Back Close Full Screen / Esc Printer-friendly Version
Interactive Discussion der polynomials as summarized in Table 1 (for further details see reading example,
Appendix A1).
For most regionsR2 increased together with the statistical significance of the fitted model, hence making it easy to decide which of the investigated models performs best. If the comparison ofR2and p-values (significance levels) showed an ambiguous result
5
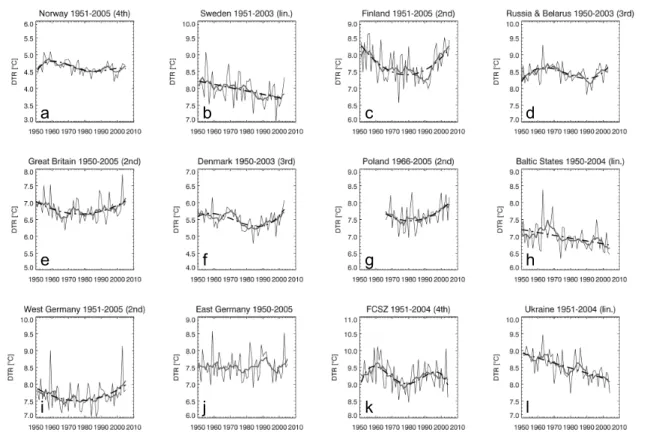
(see e.g. Table 1, line 5, Denmark), the residuals were checked in more detail and the model with the lowest autocorrelations in the residuals was selected (not shown). Note that only models with no significant autocorrelations were accepted. The annual mean time series together with the fitted trend curve and the seven year running mean trend for all investigated regions as well as the European mean are shown in Fig. 2.
10
Further information for each time series was obtained by estimating the year of re-versal from decreasing to increasing DTR (applies not to regions with linear trends). The estimation was performed by calculating the minimum in the seven year running mean (Fig. 2) for the period 1965 to 1995. For the example of Finland (Fig. 2c), the running mean given as gray bold line shows a clear local minimum in 1989 (compare
15
year given in Fig. 3 and diamond at the row “Finland” in Fig. 4). The particular period 1965 to 1995 was chosen since it embraces the whole era of reversal from dimming to brightening (Wild et al., 2005). The results are presented in Fig. 3 and Fig. 4. The numbers displayed in Fig. 3 give the year of the minimum of DTR. If they are printed in brackets no significant trend could be estimated (compare Table 1).
20
Additional to the minimum DTR value between 1965 and 1995, all values within the lowest 10% of the difference between maximum and minimum (7 yr running mean) value within that period have been calculated to give additional information on the dis-tinctness of the reversal. In Fig. 4 the years below and equal to the 10th-percentile are marked with dashes, diamonds show the minimum (for further details on the method
25
ACPD
8, 7051–7084, 2008
Diurnal temperature range over Europe
between 1950 and 2005 K. Makowski et al. Title Page Abstract Introduction Conclusions References Tables Figures ◭ ◮ ◭ ◮ Back Close Full Screen / Esc Printer-friendly Version
Interactive Discussion
3 Results
In the following section we discuss annual means of the DTR records, starting with the regional averages as described above, followed by a description of the European mean. The data records and polynomial fits determined in this analysis are compiled in Fig. 2.
5
By the use of regional averages we aim to underline the hypothesis that DTR is affected by changes in regional emissions influencing shortwave radiation reaching the ground. Detailed information for each country or region can be found in Table 1 and Figs. 2–4. A complete descriptions of all regions (except the European mean, see below) shown in figure mean is provided in Appendix B.
10
For most of Western Europe a distinct reversal from decreasing to increasing DTR is visible. The fitted polynomial trends are significant in the Great Britain, Germany, Poland, Finland, France, Italy and Switzerland/Austria. For Spain and the Benelux an alike development of decrease and increase in DTR can be seen from the running mean but the fitted polynomial trends miss the 90% significance level.
15
Circumjacent countries, as Portugal, FYR, FCZS and Norway show trends significant at the fourth order polynomial with pronounced periods of increasing DTR in recent decades. In North-Eastern Europe a region covering Sweden, the Baltic States and the Ukraine, with a continued decrease in DTR can be identified. All decreasing linear trends are significant at the 99% level.
20
The countries located farther away from central Europe, namely Russia, Belarus, Turkey, Algeria and Iceland show trends which are best described by a third order polynomial. All coefficients for all trends are significant at the 95% level except for the first (not significant) and second coefficient (90% level) of Turkey. In addition to the presently increasing DTR a prominent feature in the annual mean time series of the
25
above mentioned countries is a second, earlier increase in DTR between 1950 and 1960 which is addressed in more detail in the discussion section.
ACPD
8, 7051–7084, 2008
Diurnal temperature range over Europe
between 1950 and 2005 K. Makowski et al. Title Page Abstract Introduction Conclusions References Tables Figures ◭ ◮ ◭ ◮ Back Close Full Screen / Esc Printer-friendly Version
Interactive Discussion is the time of reversal from decrease to increase of DTR. The earliest can be found
in the UK (1967) and Germany (1967), the latest in Iceland (1987), Turkey (1990) and Russia (1992). From Fig. 4 extended periods of reversal can be seen in Romania, Norway and Denmark. For Romania, which is an outlier compared to the surrounding nations, the early appearing of the lowest value in the 7 yr running mean is put more
5
into perspective by the “error bars” in Fig. 4, equally true for the late reversal in Norway and the early one in Denmark.
For the European geographical mean between 1956 and 2003, 168 stations were used. To avoid biases, series shorter than this period have been excluded. The Euro-pean trend is best described by a second order polynomial (Fig. 2x). Both coefficients
10
are significant at the 95% level. The reversal from decrease to increase takes place in the early 1980s. This overall character of the averaged European DTR is even strengthened if shorter data series such as those from Romania and Poland were in-cluded (alternative mean not shown).
4 Discussion
15
For the different types of DTR development as well for the time shift in the reversal, we consider changing surface solar radiation as a major cause. Because solar radiation incident at the top of atmosphere has not changed substantially during the investigated period (Beer et al., 2000), two different candidates are likely to have influenced down-ward shortwave radiation, namely clouds and aerosols (first and secondary effect).
20
Norris and Wild (2007) showed that by removing the cloud cover influence from sur-face solar radiation data, the reversal from dimming to brightening becomes even more pronounced for most of Europe. Consequently cloud coverage acted as a disguise rather than a cause.
A much more likely candidate for the varying surface solar radiation and DTR trend
25
types and their time shifted reversals are different patterns of emissions, leading to regionally differentiated backscattering of solar radiation by aerosols. A reduction of
ACPD
8, 7051–7084, 2008
Diurnal temperature range over Europe
between 1950 and 2005 K. Makowski et al. Title Page Abstract Introduction Conclusions References Tables Figures ◭ ◮ ◭ ◮ Back Close Full Screen / Esc Printer-friendly Version
Interactive Discussion incoming radiation has been reported by Liepert and Kukla (1997), Gilgen et al. (1998)
and Abakumova et al. (1996). Wild et al. (2005) reported a reversal from Global Dim-ming to Brightening in mid to late 1980s at widespread locations throughout the world. From Abakumova et al. (1996), a reduction in incoming shortwave radiation until at least 1990 is evident for the specific region of Russia. These results indicate that changes
5
in surface solar radiation were found in many regions though they do not have to be necessarily simultaneous. The global background signal and forcing from aerosol as presented by Mishchenko et al. (2007), showing a general decrease during the 1990s, can be dominated by local influence as described by Alpert et al. (2005). Publications from Stern (2006) and Lefohn et al. (1996) assume that a reversal from increase to
de-10
crease of Eastern European emissions (dominated by Russia) takes place in the late 1980s or early 1990s. In contrast, Western European emissions are peaking already during the early 1970s according to Smith et al. (2004), Streets et al. (2006) and Stern (2006). This is confirmed in Mylona (1996) and Vestreng et al. (2007) who have shown that the maximum in SO2 emissions from fossil fuel for early industrialized countries,
15
such as the UK or the former Federal Republic of Germany, can be as early as the second half of the 1960s.
4.1 DTR, radiation and emissions – the biggest European emitters
In the following section we discuss the qualitative connection between trends in SO2
emissions, radiation and DTR in several examples. SO2 emissions at land level are
20
available from Mylona (1996) and Vestreng et al. (2007). Valuable information on trans-boundary fluxes and trend development of SO2since 1980 can be obtained from Klein
and Benedictow (2006). Data from long-term surface solar radiation measurement can be found in Ohmura (2006). A recently submitted paper from Gilgen et al. (2008)1 pro-vides additional information on reversal years and overall trends from gridded data of
25
1
Gilgen, H., Roesch, A., Wild, M., and Ohmura, A.: Decadel changes in shortwave irradi-ance at the surface estimated from Global Energy Balirradi-ance Archive data, submitted, 2008.
ACPD
8, 7051–7084, 2008
Diurnal temperature range over Europe
between 1950 and 2005 K. Makowski et al. Title Page Abstract Introduction Conclusions References Tables Figures ◭ ◮ ◭ ◮ Back Close Full Screen / Esc Printer-friendly Version
Interactive Discussion the Global Energy Balance Archive.
According to Berge et al. (1999) the 10 biggest emitters (in totalt/a) in Europe are:
Bulgaria, France, Germany, Italy, Poland, Spain, Great Britain, Ukraine, Russia and the Czech Republic (or FCZS). Except for Bulgaria all countries above were analyzed with respect to their DTR trends and will be discussed subsequently in more detail
5
beginning with the Eastern European countries, from south to north.
The best fitting trend for the Ukrainian DTR time series is a linear trend with a slope of −0.014◦
C/a, emphasizing a continuous decrease (Fig. 2l). A more detailed inspec-tion of the running mean in Fig. 2l reveals, however, a tendency towards an increase around 1978 which is reverses to a continued decrease from 1987 onward. Data for
10
emissions are available from 1980, showing a distinct decrease since 1990 which is not reflected in the DTR data. Surface solar radiation measurements for Odessa show a decrease from 1960 until 1987 (end of data). The described short increase in DTR is mirrored as well in the radiation time series plot (Abakumova et al., 1996; Fig. 4), most evident between 1977 and 1983. To summarize, the continued decrease in DTR
15
since 1980 cannot be explained by a continued increase of national emissions. How-ever, the findings are not contradictory with respect to the connection between DTR and radiation (further details on linear decreasing trends see Sect. 4.3).
For the FCZS, data of emissions are available for the whole period from Vestreng et al. (2007). The highest values occur around 1980 in line with the reversal of DTR from
20
decrease to increase which is calculated around 1977 (Fig. 4). In Gilgen et al. (2008)1 the reversal of surface solar radiation from dimming to brightening is estimated between 1978 and 1983.
Daily maximum and minimum temperature for Poland is available since 1966. The reversal from decrease to increase is calculated at 1977 in the seven year running
25
mean. The running mean of the Polish time series (Fig. 2g) shows a short increasing and subsequently decreasing period between 1975 and 1986. The reversal of the second order polynomial fit to DTR which omits the described hump is between 1980 and 1985, which this is close to the peaking of emissions in 1985. Consequently, both
ACPD
8, 7051–7084, 2008
Diurnal temperature range over Europe
between 1950 and 2005 K. Makowski et al. Title Page Abstract Introduction Conclusions References Tables Figures ◭ ◮ ◭ ◮ Back Close Full Screen / Esc Printer-friendly Version
Interactive Discussion reversals are consistent with the reversal in incoming shortwave radiation in 1980.
Russian emissions peak at 1975 according to Vestreng et al. (2007). Other emission estimates as e.g. from Stern (2006) and Lefohn et al. (1996) suggest that the decrease of emissions started much later namely in the late 1980s with the breakdown of the former Soviet Union. However, the significant decrease of emissions after the collapse
5
of the Eastern Bloc is reflected in all cited emission estimates. The DTR decrease for Russia lasts until 1990 consistent with the decrease in surface solar radiation (Abaku-mova et al., 1996) measured at Moscow. Likewise, the observed increase of surface solar radiation at Moscow (Wild et al., 2005) is mirrored in an increasing DTR. Both are potentially caused by the strong decrease of SO2emissions reported from various
10
estimates.
In Western Europe the biggest emitters during 1985 and 1995 are France, (West) Germany, Great Britain and Spain (Berge et al., 1999). The DTR for all four regions is best described with a second order polynomial trend, significant above 95% except for Spain with p-values of 0.35, (1st coefficient) and 0.21 (2nd coefficient) (not shown).
15
For Great Britain a reversal in DTR is apparent around 1965 simultaneously to the emissions of SO2 which are peaking in 1965. The annual sunshine duration, which can be used as a proxy for surface solar radiation (Stanhill and Cohen, 2005), shows for the southern area of the UK a reversal from decrease to increase in the late 1960s (Sanchez-Lorenzo et al., 2008).
20
In the former Federal Republic of Germany, the DTR reversal is calculated at 1967 by the 7-yr-running mean. Reversal of SO2emissions is in 1965 according to Vestreng
et al. (2007). The most dominant increase of DTR and decrease of SO2, respectively,
however begins during the 1980s which is in line with the end of the decrease in surface solar radiation in Germany (Liepert and Kukla, 1997; Fig. 2). Notably the horizontal
25
visibility increased already since the second half of the 1960s in most of the Western German stations investigated by Liepert and Kukla (1997). These results point to a decrease of turbidity and thus a reduction of aerosol burden of the troposphere.
de-ACPD
8, 7051–7084, 2008
Diurnal temperature range over Europe
between 1950 and 2005 K. Makowski et al. Title Page Abstract Introduction Conclusions References Tables Figures ◭ ◮ ◭ ◮ Back Close Full Screen / Esc Printer-friendly Version
Interactive Discussion crease from 1975. The reversal in shortwave incoming radiation is between 1980 and
1986 (Gilgen et al., 2008)1. The lag of about one decade between radiation and SO2 emission reversals is potentially due to the method how the year of reversal was de-termined. Gilgen et al. (2008)1used a second order polynomial fit to define the period of reversal. The reversal in the DTR retrieved from the fitted second order polynomial
5
would be similar, namely around 1980 to 1982 (Fig. 2s).
Spain as the most southern representative of the largest emitters in Europe has reduced its emissions remarkably since 1980 (Vestreng et al., 2007). The reversal of DTR derived from the 7 yr-running mean is at 1977 (Figs. 2r and 4). According to Sanchez-Lorenzo et al. (2007) the reversal for sunshine duration for the whole Iberia
10
Peninsula is in 1982 most evident during spring and summer, with mostly clear sky situations. The period where all three independently investigated measures (namely emissions, DTR and sunshine duration) show a reversal in their long-term behavior lies consequently within 5 yr.
Summarizing we would like to point out that, for the area of the biggest emitters,
15
if still there are few exceptions, in general the shown trends of DTR are qualitatively closely correlated to the trend patterns of SO2 emissions, surface solar radiation and sunshine duration.
4.2 Long range effects on DTR and radiation
According to the previous section a further feature which has to be discussed is the
20
inconsistency in the DTR reversal compared to the reversal in emissions in a number of regions such as Finland. The running-mean curve for the DTR in Finland (Fig. 2c) shows a reversal in the early 1990s, in line with the surface solar radiation measure-ments, taken in Sodankyla in the north of Finland (Ohmura, 2006; Fig. 9). According to Gilgen et al. (2008)1 1990 is the year of reversal from dimming to brightening, for
25
the mean of seven stations in southern Finland. Emissions, however, peaked around 1975 (Vestreng et al., 2007). It can be seen from the EMEP (Co-operative program for monitoring and evaluation of the long-range transmission of air pollutants in
Eu-ACPD
8, 7051–7084, 2008
Diurnal temperature range over Europe
between 1950 and 2005 K. Makowski et al. Title Page Abstract Introduction Conclusions References Tables Figures ◭ ◮ ◭ ◮ Back Close Full Screen / Esc Printer-friendly Version
Interactive Discussion rope) Report 1/06 (Klein and Benedictow, 2006) for Finland that for 2004 about 80%
of the oxidized sulphur deposition originates from outside Finland. Biggest contributor is Russia with as much as 23% for overall Finland. This implies that the influence on DTR especially for stations in the North and East of Finland is likely to be dominated by Russian emissions, thus giving a possible explanation for the reversal in DTR and
5
surface solar radiation as late as 1989 (Fig. 4).
Similar to Finland, other countries in Northern Europe, such as Sweden, Norway, Iceland, Latvia, Lithonia and Denmark contribute no more than 10% to their total of oxidized sulphur deposition, leaving these regions as dependent on neighboring coun-tries such as Great Britain, Germany, Poland, Estonia, Ukraine and Russia and their
10
patterns in matters of emissions. 4.3 Linear downward trends of DTR
Another interesting feature is the linear downward trend of the DTR in Sweden, the Baltic States and Ukraine. It is noteworthy that they seem to build a north-west, south-east orientated zone between Eastern and Western Europe (Fig. 3). The linear
de-15
creasing DTR trend is not explainable by the national emission trends of the corre-sponding regions, since the emissions for all above mentioned countries have declined at least since 1990. Surface solar radiation for southern Sweden and the Baltic States started to increase in the late 1980s (Ohmura, 2006; Gilgen et al., 20081), subse-quently DTR in both regions levels-off or increases slightly as well. However, during
20
the 1990s DTR stopped increasing which resulted in a significant decreasing linear trend for the whole period. The continuous decrease of DTR in Ukraine cannot be explained by a continued increase of emissions. Also, no radiation data is available for further interpretation. Support for the findings on an overall decreasing DTR can be found from soil moisture measurements. Robock and Li (2006) have shown that
25
between 1958 until the mid 1990s soil moisture increased significantly for the Ukraine. They state that precipitation and temperature alone could not have caused this devel-opment. Using a land surface model they show that a reduction in downward shortwave
ACPD
8, 7051–7084, 2008
Diurnal temperature range over Europe
between 1950 and 2005 K. Makowski et al. Title Page Abstract Introduction Conclusions References Tables Figures ◭ ◮ ◭ ◮ Back Close Full Screen / Esc Printer-friendly Version
Interactive Discussion radiation could have caused the observed increase in soil moisture, which is in line with
the DTR decrease noted above.
4.4 Early increase in DTR and radiation
The final feature we want to discuss in detail is the early increase of DTR during the 1950s and 1960s, visible in different regions all over Europe but mainly in the northern,
5
eastern and the periphery regions, namely Norway, Russia, the Baltic States, FCZS, FRY as well as Iceland, Algeria and Turkey. The early increase visible from the different DTR time series might be due to an “earlier brightening” during this period. The hypoth-esis of an earlier brightening in Eastern Europe during the 1950s and 1960s is again supported by soil moisture measurement. Figure 3 of Robock and Li (2006) suggests
10
that soil moisture in Russia decreased slightly between 1958 and 1970, indicating an increase in radiation.
No radiation data is available from the above mentioned regions prior to 1960. Still we can assume a similar technological development for Eastern Europe as for Western Europe but with a time shift of one to two decades as indicated by a later reversal in
15
emissions and radiation during the period since 1960.
By investigating radiation and radiation related measurements for Western Europe prior to 1950 we can consequently find potential explanations for the observed early increase of the DTR. Evidence for an early brightening period (increase of incoming shortwave radiation) in Western Europe is presented in Ohmura (2006). The surface
20
solar radiation data in Fig. 1 of Ohmura (2006) for Wageningen, Stockholm, Davos and Potsdam increases until the 1950s. For Wageningen this is supported from De Bruin et al. (1995). In Sanchez-Lorenzo et al. (2008) sunshine duration for Western Europe increases from 1938 (earliest value of plot) until 1950.
ACPD
8, 7051–7084, 2008
Diurnal temperature range over Europe
between 1950 and 2005 K. Makowski et al. Title Page Abstract Introduction Conclusions References Tables Figures ◭ ◮ ◭ ◮ Back Close Full Screen / Esc Printer-friendly Version
Interactive Discussion
5 Conclusions
We investigated annual mean DTR for the period 1950 until 2005 for 23 different coun-tries and regions in and around Europe as well as Europe as a whole. A total of 16 out of these 23 regions as well as the European mean show a statistically significant pe-riod of decrease and a subsequent increase in DTR. Two additional regions (BeNeLux,
5
Spain) show an increase, which however is not statistically significant in the multiple regression analysis. Of the remaining five regions, two (East Germany, Portugal) show no specific trend and three (Sweden, Baltic States, Ukraine) regions show a continua-tion of the decreasing trend.
The connection between DTR, shortwave radiation and SO2 emissions has been
10
qualitatively discussed with respect to a common trend reversal. The period of reversal of DTR from decrease to increase is in most cases in line with social and economic development as indicated by SO2-emissions or deposition, respectively. All reversals of DTR were shown to take place between 1965 and 1990. This is consistent with the change from decrease to increase of incoming shortwave radiation (“Global
Dim-15
ming” to “Global Brightening”). Consequently, we conclude that the long-term trends in DTR are dominated by changes in incoming shortwave radiation, presumably largely influenced by direct and indirect effects of aerosol from sulphurous emissions.
This may suggest that in more regions around the globe DTR will increase if the surface solar radiation continues to increase on a widespread basis.
20
Appendix A
A1 Reading example Table 1
The example of Denmark, (Table 1, line 5) reads as follows: the first column contains the name of the region. The second column contains theR2 between the time series
ACPD
8, 7051–7084, 2008
Diurnal temperature range over Europe
between 1950 and 2005 K. Makowski et al. Title Page Abstract Introduction Conclusions References Tables Figures ◭ ◮ ◭ ◮ Back Close Full Screen / Esc Printer-friendly Version
Interactive Discussion and the best fitted trend of the form:
f (x) = f1∗ x + fO (A1)
Following theR2a small “O” indicates that the linear coefficient is statistically significant above the 90% level or in more common words: it is 90% likely that the linear coefficient cannot be zero if the time series should be represented by the given equation. Column
5
three contains again the value for theR2. However, now the comparison is performed between the time series of annual mean DTR of Denmark and the best fit of the type:
f (x) = f2∗ x2+ f1∗ x + fO (A2)
Following this R2 two lines of coding symbols contain the information that the linear coefficient (f1) is now 99% significant (two “x”) and the quadratic trend is different from
10
zero at the 95% significance level (one “x”). For the third order polynomial, shown
in the fourth column, theR2 increases again to now 0.3. The three lines of symbols following theR2 indicate that the cubic coefficient is now significant at the 99% level, the quadratic at the 95% level but the linear coefficient misses the 90% level and is marked consequently with a small “–”. In the 5th column theR2increases to 0.33 thus
15
explaining already 33% of the given annual mean time series. However the polynomial of the form,
f (x) = f4∗ x4+ f3∗ x3+ f2∗ x2+ f1∗ x + fO (A3)
overestimates for the given time period. A2 Explanatory example Fig. 4
20
The method underlying Fig. 4 can be illustrated comparing Fig. 2f (Denmark) and o (Former Yugoslavia – FYU). The highest value for the seven year running mean during the given period for FYU appears in 1991 with 9.8◦C, the lowest is 8.98◦C in 1977. The
ACPD
8, 7051–7084, 2008
Diurnal temperature range over Europe
between 1950 and 2005 K. Makowski et al. Title Page Abstract Introduction Conclusions References Tables Figures ◭ ◮ ◭ ◮ Back Close Full Screen / Esc Printer-friendly Version
Interactive Discussion a seven year running mean value of the time series of FYU within the range of 8.98◦C
and 9.06◦C have been marked with a dash in Fig. 4, line 6 (1975, 1976, 1978). These
dashes consequently give a sort of error bar for the calculated year of reversal. For the reversal in the annual mean time series of Denmark, a much bigger uncertainty range is given, namely between 1981 and 1987. The highest value in the period 1965 to 1995
5
of the seven year running mean of the annual means from Denmark is 5.75◦C (1970)
the lowest is 5.21◦
C (1981). So the difference between the two extremes is 0.54◦C
which is only two thirds of FYU difference. This fact gives credit to the different overall variability of the investigated time series. After adding 10% of 0.54◦C to the minimum
of 5.21◦C all years within the range of 5.21◦C to 5.26◦C (1982–1987) are marked with
10
a dash (Fig. 4, line 14).
Appendix B
Addititonal, detailed information on the regional annual means
B1 Western Europe
15
Norway
The mean DTR, predominantly governed by stations around 60◦N, shows an increase
during the 1950s followed by a significant decrease until the late 1980s. Starting in 1987 DTR increases, but is then interrupted by a dip around 2000 (Fig. 2a). This dip reduces the significance of the fitted polynomial, still the third and forth order
polyno-20
mials are significant above 90%. Sweden
The averaged time series for Sweden shows a highly significant negative linear trend (Fig. 2b). The selected stations are all located south of 64◦N, representing southern
ACPD
8, 7051–7084, 2008
Diurnal temperature range over Europe
between 1950 and 2005 K. Makowski et al. Title Page Abstract Introduction Conclusions References Tables Figures ◭ ◮ ◭ ◮ Back Close Full Screen / Esc Printer-friendly Version
Interactive Discussion Sweden (Fig. 3). The DTR appears to level off since the late 1980s. However, when
reducing the Swedish data to cover only stations for the period until 2005, a tendency to an increase became apparent, this trend was not significant in any model. Also the selection would have given even more weight to the most southern part of Sweden. Finland
5
The data for Finland consists of three stations, evenly divided from north to south, namely Helsinki, Jyvaskyla and Sodankyla. The national trend is best represented by a second order polynomial trend significant above the 99% level (Fig. 2c).
Denmark
Though one of the smaller countries, Denmark contributes 5 equally distributed stations
10
to the dataset (Fig. 3). The best fitting trend model is the third order polynomial (Fig. 2f). The second and third order coefficients are significant at 95% level, whereas the linear term shows only p-value of 0.18 corresponding to approximately 80% confidence level. Great Britain
Only three stations met the demanded quality requirements of temporal coverage up
15
to 2003, namely Oxford, Wick and Waddington. The former two are located in the industrialized southern area of the UK and show a distinct DTR reversal from decrease to increase. Wick is situated at the northern tip of the British mainland showing a general decrease. Despite this the fitted second order polynomial is significant at the 95% level, indicating a trend from decrease to increase (Fig. 2e). An early reversal
20
ACPD
8, 7051–7084, 2008
Diurnal temperature range over Europe
between 1950 and 2005 K. Makowski et al. Title Page Abstract Introduction Conclusions References Tables Figures ◭ ◮ ◭ ◮ Back Close Full Screen / Esc Printer-friendly Version
Interactive Discussion BeNeLux
Belgium and Luxembourg each contribute only one station to the selected dataset, hence they were analyzed together with the seven stations from the Netherlands. The analysis of the BeNeLux region showed no significant trend. The best fit however is a second order polynomial with p-values around 0.23 (Fig. 2m). The seven year running
5
mean trend shows an overall increase since 1980. East Germany
No significant trend is apparent. Best fit is the second order polynomial (Fig. 2j). P-values are in general above 0.7 (confidence level, below 30%) in all models and coef-ficients.
10
West Germany
For the mean of the 13 stations a distinct reversal from decrease to increase is visible in the national mean time series. Consequently the second order polynomial trend is significant at the 95% level in both coefficients (Fig. 2i).
France
15
The 25 selected stations are distributed equally over France (Fig. 3). Similar to West Germany the second order polynomial is significant at the 95% level emphasizing the DTR development form decrease to increase with the reversal period between 1965 and 1985.
Alpine Region
20
There are only two stations, one from Austria and one from Switzerland. Most Swiss stations had to be rejected due to homogeneity issues. Problems were caused by
ACPD
8, 7051–7084, 2008
Diurnal temperature range over Europe
between 1950 and 2005 K. Makowski et al. Title Page Abstract Introduction Conclusions References Tables Figures ◭ ◮ ◭ ◮ Back Close Full Screen / Esc Printer-friendly Version
Interactive Discussion change of location and instrumentation. The only Swiss station that met the quality
requirements is Basel-Binningen. For Austria only one station (Kremsmuenster) with complete data coverage from 1950 to 2005 is provided in ECA&D-P. The mean trend derived from the two stations is best described by a polynomial of the second order (Fig. 2n). The main contribution to this shape is given by the Basel-Binningen station
5
which shows a distinct decrease and increase. Italy
The mean trend for Italy is calculated from four stations. The best fitting polynomial is second order (Fig. 2t). Overall a strong decrease and subsequent increase is visible. Spain
10
For Spain a slight decrease in the seven year running mean up to 1977 is visible. Thereafter an equally slightly visible increase in DTR can be seen (Fig. 2r). However, the statistical analysis shows no significant trend on the 90% confidence level. The p-values for Spain are, 0.36 for the linear and 0.22 for the cubic coefficient.
Portugal
15
A total of three stations are sufficient according to the demanded quality requirements. Braganca shows an overall increase for the whole period while Lisboa (Lisbon) and Porto show a continuous decrease in DTR (Fig. 2q).
B2 Eastern Europe
Former Republic of Yugoslavia
20
The reliable period for the FRY region is from 1956 to 2004. The best fitting trend model for that time series is a fourth order polynomial trend with p-values below 0.05
ACPD
8, 7051–7084, 2008
Diurnal temperature range over Europe
between 1950 and 2005 K. Makowski et al. Title Page Abstract Introduction Conclusions References Tables Figures ◭ ◮ ◭ ◮ Back Close Full Screen / Esc Printer-friendly Version
Interactive Discussion for all coefficients. Consequently the development shows more than a single period of
decrease and increase. From 1956 to about 1965 the DTR increases this is followed by a distinct decrease up to around 1980. From 1980 until 1990 a second and more emphasized increase is dominant with a subsequent phase of more or less constant development until 2004 (Fig. 2o). However, the most pronounced feature in this period
5
is the decrease and then subsequent increase in DTR from 1965 to 1991. Romania
The best fit is a third order polynomial with p-values of about 0.03 for the first and second coefficient, the p-value for the third coefficient is slightly higher with 0.051 and therefore misses the 95% confidence boundary. From the seven year running mean a
10
period with a distinct decrease from 1961 to 1971 is visible, followed by a longer period of increasing DTR lasting until 1990, subsequently the running mean shows a constant development (Fig. 2p).
Czechoslovakia
As for the area of the FRY, the former Czechoslovakian states are best fitted by a
15
fourth order polynomial (Fig. 2k). All tested coefficient of the fourth order polynomial are above the 95% significance level (p-values<0.05). The decreasing period lasts
until 1977 according to the seven year running mean, then the DTR increases until it stops around 1992. This is followed by a stable to slightly decreasing period until 2004. Poland
20
Only two stations with data from 1966 to 2005 are available, Leba and Siedlce these both show very similar long-term trends. The best fit is a second order polynomial. p-values for the coefficients are 0.083 and 0.046. For Poland a decreasing period is visible from 1966 to 1980 and an increasing period from 1986 to 2005 (Fig. 2g).
ACPD
8, 7051–7084, 2008
Diurnal temperature range over Europe
between 1950 and 2005 K. Makowski et al. Title Page Abstract Introduction Conclusions References Tables Figures ◭ ◮ ◭ ◮ Back Close Full Screen / Esc Printer-friendly Version
Interactive Discussion Baltic Region
A strong increase is visible in the seven year running mean up to 1966, followed by a decrease, leveling off in 1991. A short increase starting in 1990 come to an end by 1996 and then becomes a continued decrease (Fig. 2h). The result of this is an overall linear decrease in the fitted trend model significant at 95% level.
5
Ukraine
The nearly monotonic drop of the Ukrainian mean DTR lasts over the whole period from 1951 to 2005 (Fig. 2l). The linear trend is significant above 99%. The two most westerly located stations, L’Vov (Lwiw/Lemberg) and Uzhgorod show a dominant increase since the middle of the 1970s. For the two biggest cities of Ukraine, Khrakov and Kyiv (Kiev)
10
a decrease in DTR until the mid-1990s is dominant follow by a leveling off or increase thereafter.
Russia
The largest region of the so called Eastern-European section is the European part of Russia with Brest (Brestzonalnaya) as only representative station for Belarus included.
15
The mean DTR development for the overall 36 stations is best described by a third order polynomial. p-values are around 0.001 theR2is 0.22. Assuming that none of the high frequency is caught by the polynomial this is a quite high value. The seven year running mean describes an increase until 1966 followed by a continuous decrease until 1992 and thereafter an equally uninterrupted increase until 2003 (Fig. 2d).
ACPD
8, 7051–7084, 2008
Diurnal temperature range over Europe
between 1950 and 2005 K. Makowski et al. Title Page Abstract Introduction Conclusions References Tables Figures ◭ ◮ ◭ ◮ Back Close Full Screen / Esc Printer-friendly Version
Interactive Discussion B3 Surrounding regions
Iceland
The best fit for the DTR time series is the third order polynomial (Fig. 2u). All coeffi-cients are above 95% significant. Equal to Denmark and Finland, Iceland is considered to be a mixture of the Western and Eastern European trend type.
5
Turkey
The shape of the mean data series of the three stations is best described by a third order polynomial. The seven year running mean describes a distinct increase from 1950 until 1963, then a subsequent decrease is disturbed by a short period of in-crease between 1974 and 1984, thereafter the long-term dein-crease is continued until
10
1990. Finally an increase until 2004 is visible from the smoothed 7 yr running-mean curve. The described interruption causes a reduction in the significance of the trend model, p-values are 0.150(1st), 0.053(2nd) and 0.027(3rd). When smoothing the de-scribed period the p-values are: 0.03(2nd) and 0.009(3rd). The linear coefficient never becomes statistically significant since there is no overall decrease or increase in the
15
series. Algeria
Three stations are available which are distributed roughly evenly along a north south transect (Fig. 3). All stations, namely Alger-Dar el Beida, El Golea and Tamanrasset, present a similar trend best described with a third order polynomial. The significance
20
of coefficient is above the 99% level. The seven year running mean is dominated by an increase from 1950 to 1963, followed by a decrease lasting until 1986. Finally, an increase can be noted up to 2004. The peek in 2001 is a prominent feature of the mean and can be equally found in each of the contributing stations.
ACPD
8, 7051–7084, 2008
Diurnal temperature range over Europe
between 1950 and 2005 K. Makowski et al. Title Page Abstract Introduction Conclusions References Tables Figures ◭ ◮ ◭ ◮ Back Close Full Screen / Esc Printer-friendly Version
Interactive Discussion
Acknowledgements. We would like to thank Royal Netherlands Meteorological Institute for
ac-cess to the ECAD-P data set and the meteorological services of Romania (S. Cheval), Norway (E. Lundstad, E. Forland, K. A. Iden) and Iceland (T. Jonsson) for providing additional data. Discussions with T. Peter, J. M ¨ader and A. Roesch were highly appreciated. P. Southern’s proofreading is very gratefully acknowledged. The work was funded by ETH Zurich,
Polypro-5
ject: “Variability of the sun and global climate” – Phase II.
References
Abakumova, G. M., Feigelson, E. M., Russak, V., and Stadnik, V. V.: Evaluation of long-term changes in radiation, cloudiness, and surface temperature on the territory of the former So-viet Union, J. Climate, 9, 1319–1327, 1996.
10
Alpert, P., Kishcha, P., Kaufman, Y. J., and Schwarzbard, R.: Global dimming or local dim-ming?: Effect of urbanization on sunlight availability, Geophys. Res. Lett., 32, L17802, doi:10.1029/2005GL023320, 2005.
Beer, J., Mende, W., and Stellmacher, R.: The role of the sun in climate forcing, Quaternary Sci. Rev., 19, 403–415, 2000.
15
Berge, E., Bartnicki, J., Olendrzynski, K., and Tsyro, S. G.: Long-term trends in emissions and transboundary transport of acidifying air pollution in Europe, J. Environ. Manage., 57, 31–50, 1999.
Braganza, K., Karoly, D. J., and Arblaster, J. M.: Diurnal temperature range as an index of global climate change during the twentieth century, Geophys. Res. Lett., 31, L13217,
20
doi:10.1029/2004gl019998, 2004.
Dai, A., DelGenio, A. D., and Fung, I. Y.: Clouds, precipitation and temperature range, Nature, 386(6626), 665–666, 1997.
Dai, A., Trenberth, E., and Karl, T. R.: Effects of clouds, soil moisture, precipitation, and water vapour on diurnal temperature range, J. Climate, 12, 2451–2473, 1999.
25
De Bruin, H. A. R., van den Hurk, B. J. J. M., and Welgraven, D.: A series of global radiation at Wageningen for 1928–1992, Int. J. Climatol., 15, 1253–1272, 1995.
Easterling, D. R., Horton, B., Jones, P. D., Peterson, T. C., Karl, T. R., Parker, D. E., Salinger, M. J., Razuvayev, V., Plummer, N., Jamason, P., and Folland, C. K.: Maximum and minimum temperature trends for the globe, Science, 277, 364–367, 1997.
ACPD
8, 7051–7084, 2008
Diurnal temperature range over Europe
between 1950 and 2005 K. Makowski et al. Title Page Abstract Introduction Conclusions References Tables Figures ◭ ◮ ◭ ◮ Back Close Full Screen / Esc Printer-friendly Version
Interactive Discussion Englehart, P. J. and Douglas, A. V.: Changing behavior in the diurnal range of surface air
temperatures over Mexico, Geophys. Res. Lett., 32, L01701, doi:10.1029/2004gl021139, 2005.
Gilgen, H., Wild, M., and Ohmura, A.: Means and Trends of shortwave Irradiance at the surface estimated from global energy balance archive data, J. Climate, 11, 2042–2061, 1998.
5
Gilgen, H. and Ohmura, A.: The global energy balance archive, B. Am. Meteorol. Soc., 80, 831–850, 1999.
Karl, T. R., Kukla, B., and Gavin, J.: Decreasing diurnal temperature range in the United States and Canada from 1941 through 1980, J. Clim. Appl. Meteorol., 23, 1489–1504, 1984. Karl, T. R., Jones, P. D., Knight, R. W., Kukla, G., Plummer, N., Razuvayev, V., Gallo, K. P.,
10
Lindseay, J., Charlson, R. J., and Peterson, T. C.: Asymmetric trends of daily maximum and minimum temperature, B. Am. Meteorol. Soc., 74, 1007–1023, 1993.
Klein Tank, A. M. G., Wijngaard, J. B., K ¨onnen, G. P., B ¨ohm, R., Demar ´ee, G., Gocheva, A., Mileta, M., Pashiardis, S., Hejkrlik, L., Kern-Hansen, C., Heino, R., Bessemoulin, P., M ¨uller-Westermeier, G., Tzanakou, M., Szalai, S., P ´alsd ´ottir, T., Fitzgerald, D., Rubin, S., Capaldo,
15
M., Maugeri, M., Leitass, A., Bukantis, A., Aberfeld, R., van Engelen, A. F. V., Forland, E., Mietus, M., Coelho, F., Mares, C., Razuvaev, V., Nieplova, E., Cegnar, T., Antonio L ´opez, J., Dahlstr ¨om, B., Moberg, A., Kirchhofer, W., Ceylan, A., Pachaliuk, O., Alexander, L. V., and Petrovic, P.: Daily dataset of 20th-century surface air temperature and precipitation series for the European Climate Assessment, Int. J. Climatol., 22, 1441–1453, doi:10.1002/Joc.773,
20
2002.
Klein, H. and Benedictow, A.: EMEP MSC-W (Meteorological Synthesizing Centre-West) Data Note 1/2006: Transboundary data by main pollutants (S, N, O3) and PM, ISSN 1890-0003, 2006.
Kukla, G. and Karl, T. R.: Nighttime warming and the Greenhouse-Effect, Environ. Sci. Technol.,
25
27, 8, 1468–1474, 1993.
Lefohn, A. S., Husar, J. D., Husar, R. B., and Brimblecombe, P.: Assessing historical global sulfur emission patterns for the period 1850–1990, Report number: DOE/ER/30234—1, pre-pared for the US department of energy, 190 pp. [NTIS DE96014790], 1996.
Liepert, B. G. and Kukla, G. J.: Decline in global solar radiation with increased horizontal
30
visibility in Germany between 1964 and 1990, J. Climate, 10, 2391–2401, 1997.
Liu, B., Xu, M., Henderson, M., and Gong, W.: A spatial analysis of pan evaporation trends in China 1955-2000, J. Geophys. Res., 109, D15102, doi:10.1029/2004jd004511, 2004.
ACPD
8, 7051–7084, 2008
Diurnal temperature range over Europe
between 1950 and 2005 K. Makowski et al. Title Page Abstract Introduction Conclusions References Tables Figures ◭ ◮ ◭ ◮ Back Close Full Screen / Esc Printer-friendly Version
Interactive Discussion Mishchenko, M. I., Geogdzhayev, I. V., Rossow, W. B., Cairns, B., Carlson, B. E., Lacis, A.
A., Liu, L., and Travis, L. D.: Long-term satellite record reveals likely recent aerosol trend, Science, 315, 1543, doi:10.1126/science.1136709, 2007.
Mylona, S.: Sulphur dioxide emissions in Europe 1880–1991 and their effect on sulphur con-centrations and depositions, Tellus, 48, 662–689, 1996.
5
Norris, J. R. and Wild, M.: Trends in aerosol radiative effects over Europe inferred from ob-served cloud cover, solar “dimming” and solar “brightening”, Geophys. Res. Lett., 112, D08214, doi:10.1029/2006JD007794, 2007.
Ohmura, A. and Lang, H.: Secular variations of global radiation in Europe, IRS’88: Current problems in atmospheric radiation, edited by: Leonoble, J. and Geleyn, J. F., A. Deepak
10
Publ., Hampton, VA, 298–301, 1989.
Ohmura, A.: Observed long-term variations of solar irradiance at the earth’s surface, Space Sci. Rev., 125, 111–128, doi:10.1007/s11214-006-9050-9, 2006.
Pinker, R. T., Zhang, B., and Dutton, E. G.: Do satellites detect trends in surface solar radia-tion?, Science, 308, 850–854, doi:10.1126/science.1103159, 2005.
15
Robock, A. and Li, H.: Solar dimming and CO2effects on soil moisture trends, Geophys. Res. Lett., 33, L20708, doi:10.1029/2006gl027585, 2006.
Roderick, M. L. and Farquhar, G. D.: The cause of decreased pan evaporation over the past 50 years, Science, 298, 1410–1411, 2002.
Sanchez-Lorenzo, A., Brunetti, M., Calbo, J., and Martin-Vide, J.: Recent spatial and temporal
20
variability and trends of sunshine duration over the Iberian Peninsula from a homogenized dataset, J. Geophys. Res., 112, D20115, doi:10.1029/2007JD008677, 2007.
Sanchez-Lorenzo, A., Calb ´o, J., and Martin-Vide, M.: Time evolution of sunshine duration over Western Europe (1938–2004), J. Climate, accepted, 2008.
Stanhill, G. and Cohen, S.: Global dimming: a review of the evidence for widespread and
25
significant reduction in global radiation with discussion of its probable cause and possible agricultural consequences, Agr. Forest Meteorol., 107, 255–278, 2001.
Stanhill, G. and Cohen, S.: Solar radiation changes in the United States during the Twentieth Century: Evidence from sunshine measurements, J. Climate, 18, 1503–1512, 2005.
Stechikov, G. L. and Robock, A.: Diurnal asymmetry of climatic response to increased CO2and
30
aerosol: forcings and feedbacks, J. Geophys. Res., 100(D12), 26 211–26 227, 1995.
Stern, D. I.: Reversal of the trend in global anthropogenic sulphur emissions, Global Environ. Change, 16, 207–220, doi:10.1016/j.gloenvcha.2006.01.001, 2006.
ACPD
8, 7051–7084, 2008
Diurnal temperature range over Europe
between 1950 and 2005 K. Makowski et al. Title Page Abstract Introduction Conclusions References Tables Figures ◭ ◮ ◭ ◮ Back Close Full Screen / Esc Printer-friendly Version
Interactive Discussion Stone, D. A. and Weaver, A. J.: Factors contributing to diurnal temperature range trends in
twentieth and twenty-first century simulations of the CCCma coupled model, Clim. Dynam., 20, 435–445, doi:10.1007/s00382-002-0288-y, 2002.
Smith, S. J., Pitcher, H., and Wigley, T. M. L.: Future sulphur dioxide emissions, Climatic Change, 73, 267–318, doi:10.1007/s10584-005-6887-y, 2005.
5
Streets, D. G., Wu, Y., and Chin, M.: Two-decadel aerosol trends as a likely expla-nation of the global dimming/brightening transition, Geophys. Res. Lett., 33, L15806, doi:10.1029/2006GL026471, 2006.
Trenberth, K. E., Jones, P. D., Ambenje, P., Bojariu, R., Easterling, D., Klein Tank, A., Parker, D., Rahimzadeh, F., Renwick, J.A., Rusticucci, M., Soden, B., and Zhai, P.: Observations:
Sur-10
face and Atmospheric Climate Change. The Physical Science Basis. Contribution of Work-ing Group I to the Fourth Assessment Report of the Intergovernmental Panel on Climate Change, edited by: Solomon, S., Qin, D., Manning, M., Chen, Z., Marquis, M., Averyt, K. B., Tignor, M., and Miller, H. L., 987 pp., 2007.
Vestreng, V., Myhre, G., Fagerli, H., Reis, H., and Tarrason, L.: Twenty-five years of continuous
15
sulphur dioxide emission reduction in Europe, Atmos. Chem. Phys., 7, 3663–3681, 2007,
http://www.atmos-chem-phys.net/7/3663/2007/.
Vose, R. S., Easterling, D. R., and Gleason, B.: Maximum and minimum temper-ature for the globe: An update through 2004, Geophys. Res. Lett., 32, L23822, doi:10.1029/2005GL024379, 2005.
20
Wild, M., Gilgen, H., Roesch, A., Ohmura, A., Long, C. N., Dutton, E. G., Forgan, B., Kallis, A., Russak, V., and Tsvetkov, A.: From dimming to brightening, Science, 308, 741–908, doi:10.1126/science.1103215, 2005.
Wild, M., Ohmura, A., and Makowski, K.: Impact of global dimming and brightening on global warming, Geophys. Res. Lett., 34, L04702, doi:10.1029/2006GL028031, 2007.
ACPD
8, 7051–7084, 2008
Diurnal temperature range over Europe
between 1950 and 2005 K. Makowski et al. Title Page Abstract Introduction Conclusions References Tables Figures ◭ ◮ ◭ ◮ Back Close Full Screen / Esc Printer-friendly Version
Interactive Discussion Table 1. Data for each investigated region, including overall Europe and each trend type.
Order: Western Europe N–S; Eastern N–S, surrounding regions, Europe; Columns from left to right: (1) Name of the region, (2)R2and significance codes for each coefficient (–<90%, o 90%–95%, x 95%–99%, xx 99%–99.999%, xxx>99.999%), columns (3) to (5) equal to column
(2) but for higher order polynomial fits, (6) number of stations for the mean calculations, and (7) data period (for more details see example in Appendix A1).R2’s in bold denote the best suitable model according toR2, significance and residuals (not shown), which was subsequently used in Fig. 2. 1st 2nd 3rd 4th No. Period Norway 0.15 xx 0.17 – 0.26 o 0.32 x 4 51–05 – x x x x o Sweden 0.15 xx 0.15 – 0.16 – 0.20 – 5 51–03 – – – – – – Finland 0.01 – 0.25 xxx 0.27 – 0.28 – 3 51-05 xxx – – – – – Great Britain <0.01 – 0.14 xx 0.14 – 0.14 – 3 50–05 xx – – – – – Denmark 0.06 o 0.18 xx 0.30 – 0.33 – 5 50–03 x – – xx – – East Germany (DDR) <0.01 – <0.01 – <0.01 – <0.01 – 12 50–05 – – – – – – West Germany (BRD) <0.01 – 0.12 x 0.12 – 0.12 – 13 51–05 x – – – – – BeNeLux <0.01 – 0.02 – 0.04 – 0.06 – 9 51–05 – – – – – – Alpine 0.01 – 0.24 xxx 0.25 – 0.25 – 2 50–05 xxx – – – – – France 0.02 – 0.11 x 0.11 – 0.11 – 25 50–05 x – – – – – Italy 0.03 – 0.42 xxx 0.52 xxx 0.59 – 4 51–03 xxx xxx – xxx x xx
ACPD
8, 7051–7084, 2008
Diurnal temperature range over Europe
between 1950 and 2005 K. Makowski et al. Title Page Abstract Introduction Conclusions References Tables Figures ◭ ◮ ◭ ◮ Back Close Full Screen / Esc Printer-friendly Version Interactive Discussion Table. 1. Continued. 1st 2nd 3rd 4th No. Period Spain 0.02 – 0.05 – 0.05 – 0.08 – 9 51–05 – – – x – – Portugal 0.05 o 0.05 – 0.06 – 0.12 – 3 50–05 – x o x o o
Russia & Belarus 0.02 – 0.02 – 0.22 xx 0.22 – 36 50–03 – xxx – xxx – – Baltic States 0.13 xx 0.15 – 0.16 – 0.17 – 9 50–04 – – – – – – Poland 0.07 o 0.17 o 0.17 0.17 – 2 66–05 x – – – – – FCZS 0.02 – 0.03 – 0.04 – 0.16 x 3 51–04 – – xx – xx x Ukraine 0.37 xxx 0.37 – 0.37 – 0.37 – 9 51–05 – – – – – – FYR 0.08 x 0.11 – 0.13 – 0.26 x 4 56–04 – – xx – xx x Romania 0.01 – 0.05 – 0.13 x 0.16 – 19 61–05 – x – o – – Iceland 0.07 o 0.07 – 0.18 x 0.22 – 4 51–05 – x – x – – Algeria 0.17 xx 0.19 – 0.37 xx 0.37 o 3 50–05 – xxx – xx – – Turkey <0.01 – 0.04 – 0.13 – 0.13 – 3 50–04 – o – x – – Europe 0.01 – 0.14 x 0.21 – 0.21 – 168 56–03 x – o FCZS – Former Czechoslovakia, FYU – Former Yugoslavia.
ACPD
8, 7051–7084, 2008
Diurnal temperature range over Europe
between 1950 and 2005 K. Makowski et al. Title Page Abstract Introduction Conclusions References Tables Figures ◭ ◮ ◭ ◮ Back Close Full Screen / Esc Printer-friendly Version
Interactive Discussion
(a) (c) (b)
Fig. 1. Sketch of mean diurnal temperature (T ) cycle under (a) weak anthropogenic
radia-tive influence, (b) enhanced shortwave radiaradia-tive cooling – “global dimming” (represented by the black arrows) and long-wave radiative warming (represented by the grey arrows), and (c) weakening shortwave radiative cooling – “global brightening” (thinner black arrows) and contin-ued long-wave radiative warming. (DTR: diurnal temperature range;T -MAX/-MIN: daily mean
maximum/minimum;T -MEAN: daily mean temperature, SW: shortwave, LW: longwave, ∆T1/3:
ACPD
8, 7051–7084, 2008
Diurnal temperature range over Europe
between 1950 and 2005 K. Makowski et al. Title Page Abstract Introduction Conclusions References Tables Figures ◭ ◮ ◭ ◮ Back Close Full Screen / Esc Printer-friendly Version
Interactive Discussion
a c b d
e g f h
i k j l
Fig. 2. Time series of annual mean DTR for each investigated region. All y-axes are scaled to 3 degrees for a better comparability. Graphs from row 1–5 are geographically arranged – except: surrounding regions of Europe as well as European mean are in the last row. The order of the best suitable polynomial trend model according to Table 1 is indicated in brackets next to the name of the region and the investigated period. Thick, grey, solid line presents 7 yr running mean. The thick, black, dashed line shows the fitted trend model, if no black line is plotted none of the models was significant above the 90% level.
ACPD
8, 7051–7084, 2008
Diurnal temperature range over Europe
between 1950 and 2005 K. Makowski et al. Title Page Abstract Introduction Conclusions References Tables Figures ◭ ◮ ◭ ◮ Back Close Full Screen / Esc Printer-friendly Version Interactive Discussion q s r t m o n p u w v x Fig. 2. Continued.
ACPD
8, 7051–7084, 2008
Diurnal temperature range over Europe
between 1950 and 2005 K. Makowski et al. Title Page Abstract Introduction Conclusions References Tables Figures ◭ ◮ ◭ ◮ Back Close Full Screen / Esc Printer-friendly Version
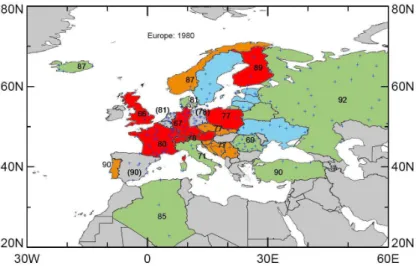
Interactive Discussion Fig. 3. Distribution of statistical significant, fitted DTR trend models. Blue – linear (all trends
are negative), red – second order (all trends show first a decrease, then an increase), green – third order (all trends show first an increase, then a decrease, then an increase) orange – forth order polynomial. Numbers are the year of reversal from decrease to increase in the 7 yr running mean, derived from the annual mean DTR of region/country where denoted. The trend model is not significant (>90%) if the numbers are in brackets, consequently the investigated
region is also not color-coded (Spain, East Germany, Benelux). Blue crosses represent stations investigated.
ACPD
8, 7051–7084, 2008
Diurnal temperature range over Europe
between 1950 and 2005 K. Makowski et al. Title Page Abstract Introduction Conclusions References Tables Figures ◭ ◮ ◭ ◮ Back Close Full Screen / Esc Printer-friendly Version Interactive Discussion 6 5 70 75 80 85 90 Great Britain Germany (BRD) Romania Italy Poland FYU Alpine FCZS Germany (DDR) Spain Benelux France Norway Denmark Algeria Iceland Turkey Finnland Portugal Russia Europe
Fig. 4. Reversal of 7 yr running mean DTR trends. Diamonds represent the year of reversal of DTR as calculated from 7 yr running mean trend. Dashed lines show additionally the period covered by values within the lowest 10% of the amplitude of maximum DTR minus minimum DTR (of 7 yr running mean values) for the period 1965–1995. For more details see example in Appendix A2.