Detection of the lunar body tide by
the Lunar Orbiter Laser Altimeter
The MIT Faculty has made this article openly available.
Please share
how this access benefits you. Your story matters.
Citation
Mazarico, Erwan, Michael K. Barker, Gregory A. Neumann, Maria T.
Zuber, and David E. Smith. “Detection of the Lunar Body Tide by the
Lunar Orbiter Laser Altimeter.” Geophysical Research Letters 41,
no. 7 (April 4, 2014): 2282–2288.
As Published
http://dx.doi.org/10.1002/2013gl059085
Publisher
American Geophysical Union (AGU)
Version
Final published version
Citable link
http://hdl.handle.net/1721.1/97925
Terms of Use
Creative Commons Attribution-NonCommercial-NoDerivs License
RESEARCH LETTER
10.1002/2013GL059085Key Points:
• Altimetric data are used to cre-ate radial constraints on the tidal deformation
• The body tide amplitude is estimated from the crossover data
• The estimated Love number is con-sistent with previous estimates but more precise
Correspondence to: E. Mazarico, mazarico@mit.edu
Citation:
Mazarico, E., M. K. Barker, G. A. Neumann, M. T. Zuber, and D. E. Smith (2014), Detection of the Lunar Body Tide by the Lunar Orbiter Laser Altime-ter, Geophys. Res. Lett., 41, 2282–2288, doi:10.1002/2013GL059085.
Received 18 DEC 2013 Accepted 13 MAR 2014
Accepted article online 17 MAR 2014 Published online 4 APR 2014
This is an open access article under the terms of the Creative Commons Attribution-NonCommercial-NoDerivs License, which permits use and dis-tribution in any medium, provided the original work is properly cited, the use is non-commercial and no modifications or adaptations are made.
Detection of the lunar body tide by the Lunar Orbiter
Laser Altimeter
Erwan Mazarico1,2, Michael K. Barker2,3, Gregory A. Neumann2, Maria T. Zuber1, and David E. Smith1
1Department of Earth, Atmospheric, and Planetary Sciences, Massachusetts Institute of Technology, Cambridge,
Massachusetts, USA,2NASA Goddard Space Flight Center, Greenbelt, Maryland, USA,3Sigma Space, Lanham,
Maryland, USA
Abstract
The Lunar Orbiter Laser Altimeter instrument onboard the Lunar Reconnaissance Orbiter spacecraft collected more than 5 billion measurements in the nominal 50 km orbit over ∼10,000 orbits. The data precision, geodetic accuracy, and spatial distribution enable two-dimensional crossovers to be used to infer relative radial position corrections between tracks to better than ∼1 m. We use nearly 500, 000 altimetric crossovers to separate remaining high-frequency spacecraft trajectory errors from the periodic radial surface tidal deformation. The unusual sampling of the lunar body tide from polar lunar orbit limits the size of the typical differential signal expected at ground track intersections to ∼10 cm. Nevertheless, we reliably detect the topographic tidal signal and estimate the associated Love number h2to be0.0371 ± 0.0033, which is consistent with but lower than recent results from lunar laser ranging.
1. Introduction
The Lunar Reconnaissance Orbiter (LRO) mission [Chin et al., 2007] was launched in June 2009 to provide the high-resolution data sets needed to prepare for future human exploration, such as topography [Smith
et al., 2010a] and visible and thermal imagery. After a successful 1-year Exploration mission and a 2-year
Science mission, LRO continues to operate in its 2-year Extended Science mission, still producing a wealth of new data.
The Lunar Orbiter Laser Altimeter (LOLA) [Smith et al., 2010a] is the first multibeam space laser altimeter. With its five-beam cross pattern and 28 Hz firing frequency, it mapped the Moon’s topography at higher resolution and better accuracy in a few months’ time [Smith et al., 2010b] than any previous lunar mission [e.g., Araki et al., 2009]. The altimetric data of the LOLA instrument, precise to ∼10 cm, were also invaluable in enabling precise orbit reconstruction significantly better (<20m total position error) than the original position knowledge requirements (50 m) [Chin et al., 2007], through the use of altimetric crossovers in the orbit determination process [Mazarico et al., 2012].
More recently, our knowledge of the lunar gravity field has taken a quantum leap with the successful Gravity Recovery and Interior Laboratory (GRAIL) mission [Zuber et al., 2013a]. Beyond the important geo-physical implications [Zuber et al., 2013b; Wieczorek et al., 2013; Andrews-Hanna et al., 2013], the improved lunar gravity field resolution and accuracy yield even more precise orbits for lunar orbiters such as LRO [Mazarico et al., 2013].
1.1. Rationale
The more accurate spacecraft orbit determination enables new scientific goals for LOLA, as the orbit recon-struction error level becomes comparable to the altimeter intrinsic precision. The detection of the tidal deformation of the lunar shape was not part of the LOLA instrument objectives because of its difficulty: in addition to the specific sampling geometry from orbit, the typical radial surface deformation expected between two recurring observations is less than 10 cm, whereas the individual altimetric measurement noise is ∼10 cm and the radial position knowledge was anticipated to be no better than ∼1m. Nevertheless, after a focus on orbit accuracy [Mazarico et al., 2012], and with nearly 4 years of near-continuous measure-ments resulting in millions of ground track intersections, we will show that we detected the tidal surface deformation signal in the raw LOLA elevation data set.
This direct detection is important because it does not depend on but can support other complex models of the lunar interior that can rely on lunar laser ranging (LLR) measurements which are not as sensitive to
Geophysical Research Letters
10.1002/2013GL059085
the effect of the body tide alone [Williams et al., 2008]. In addition, if the lunar tidal response is not uniform spatially, the LLR results would be insensitive, due to the retroreflectors being concentrated on the nearside and at low latitudes. On the other hand, the LOLA data are global and more uniformly distributed.
1.2. Tide Modeling
Lunar body tide models can be complex, such as Williams et al. [2008, 2010, 2013] in which the orbit and ori-entation of the Moon are integrated numerically and tidal parameters concurrently fit to the LLR data. Here we use a simple analytical model, driven by the DE421 ephemerides and lunar orientation model [Williams
et al., 2008] to calculate the degree-2 tidal potential, V, due to the Earth and Sun from their Moon-fixed
positions [Kaula, 1966]. The tidal displacement at the surface, written here for clarity ignoring the Sun, is given by 𝛿rtide(t, r, 𝜙, 𝜆) = h2 V(t, r, 𝜙, 𝜆) g(𝜙, 𝜆) = h2 GMr2 D3 3 cos2𝜑 − 1 2g(𝜙, 𝜆)
where t, r,𝜙, and 𝜆 are the time, radius, longitude, and latitude, respectively; 𝜑 is the angle to the sub-Earth point and D the distance between the Earth and the Moon centers; g is the surface gravity; and h2is the tidal
Love number describing the efficiency of the response in terms of radial deformation. In this work, we use an a priori h2value of 0.03786, equal to the DE421 value derived from a constrained fit to LLR data [Williams et al., 2008]. The DE421 ephemeris is also used by the LRO project and the LOLA science team for processing
and data archival to the Planetary Data System.
Although the Moon is rotating synchronously around the Earth, the sub-Earth point can shift by 7–8◦in longitude and latitude from its average position, due to optical librations. The eccentricity of the Moon’s orbit also moderates the amplitude of the bulge, causing time-variable radial displacements.
Thus, while the maximum displacement is ∼50 cm, it is mostly static and effectively part of the background topography, whose range is ∼20 km. Small oscillations around that mean deformation are due to the eccen-tricity and pole orientation, but solar perturbations on the Moon’s orbit and orientation produce additional longer-period signals.
1.3. Outline
We will first describe the LOLA instrument characteristics, its in-flight performance (section 2.1) and the reconstructed spacecraft position accuracy (section 2.2). In section 2.3, we will then discuss the distribution of the altimetric crossovers and show how they can be used to obtain precise relative position informa-tion between pairs of LOLA profiles. We will compare the radial crossover offsets directly to the tidal model predictions (section 3.1) and present a more comprehensive method to distinguish the tidal signal from remaining orbital errors (section 3.2). Finally, we will discuss these results (section 3.3) and summarize our findings (section 4).
2. Data Description
2.1. The LOLA Instrument
Designed to provide short-wavelength terrain and slope data to enable future landings on the lunar sur-face, the LOLA instrument is a high-frequency multibeam system. A diffractive optical element at the end of the laser beam expander produces a cross-shaped far-field pattern composed of five spots. At the nominal 50km altitude, each spot is 5 m wide and the spot centers are 25 m apart [Smith et al., 2010a, Figure 2]. The cross pattern is rotated by 26◦with respect to the flight direction, to optimize the coverage of the surface with the five profiles: each profile is separated by about 10 m cross-track, and the average along-track dis-tance between spots is also 10 m. The multibeam configuration enables proper two-dimensional sampling of the surface topography, which was not the case with previous laser altimeters. The cross-track informa-tion can help match two independent topographic profiles around their intersecinforma-tion point, removing or reducing the ambiguities that exist with purely one-dimensional profiles.
As explained in Smith et al. [2010b], the thermal blanket protecting the LOLA instrument from the space environment was tightly attached to both the beam expander and the receiver telescope. As the spacecraft transitions from the dayside to the cold nightside, the strong outer layer of the blanket contracts and pulls the beam expander out of alignment from the five detector fields of view. Fortuitously however, this dis-placement is such that two out of the five laser spots fall inside the nominal fields of view of two other spots.
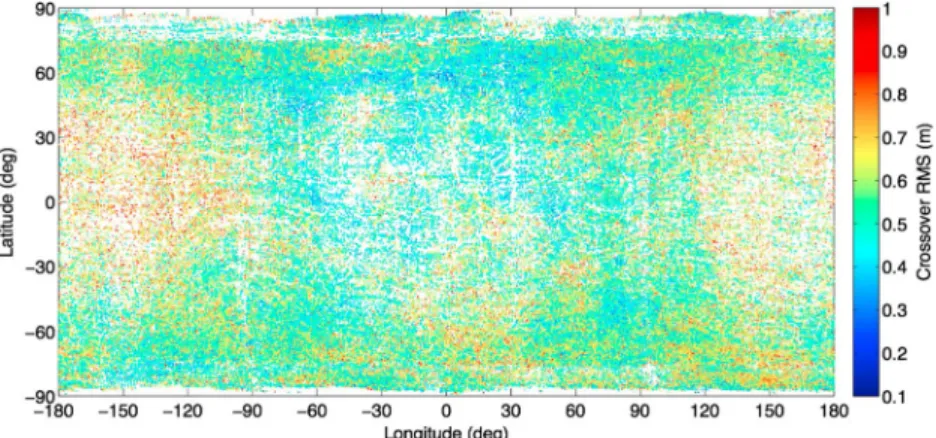
Figure 1. Spatial distribution of the selected LOLA crossovers. Color indicates the radial residual root-mean-square (RMS)
of fit after crossover adjustment (section 2.3.3) and is correlated with surface roughness. Only half of the crossovers are shown for clarity.
Consequently, LOLA continues to collect altimetry over the nightside but in diminished mode (two profiles, or ∼40% of nominal returns).
This complicates the analysis of the LOLA data by introducing time-dependent thermally driven signals to the LOLA pointing. It affects the quality of the altimetric crossovers, primarily by reducing the number of cross-track profiles from five to two when on the nightside.
2.2. LRO Position Knowledge
Before the GRAIL gravity fields [Zuber et al., 2013b] became available, the LRO orbit determination relied on bootstrapped gravity solutions tuned to minimize orbital overlaps [Mazarico et al., 2012]. These models per-formed better geodetically than the Lunar Prospector models [Konopliv et al., 2001; Mazarico et al., 2010a], with an orbit consistency of about 20 m in total position and less than 1.5 m radially. With the degree and order 420 GRAIL gravity field of Zuber et al. [2013a], the accuracy of the orbits determined from the LRO radiometric tracking data improved further in the nominal orbit phase, to ∼10m in total position and about 50cm radially [Mazarico et al., 2013]. The LOLA altimetric profiles that we use here are geolocated from those high-quality orbits, in order to minimize the impact of orbit reconstruction errors on the results.
2.3. Altimetric Crossovers 2.3.1. Definition and Distribution
Crossovers are locations where two spacecraft ground tracks intersect. They are advantageous when an altimeter is operating because the altimetric data can be transformed into geodetic constraints on the spacecraft trajectory, the instrument pointing, and the changes in surface height. Except for those, the two measurements should yield the same planetary radius.
The number of crossovers grows quadratically with the number of orbits, so naturally we maximize the temporal baseline of our data set. Because LOLA cannot reliably measure laser returns at ranges larger than ∼120 km, the altimetric data are exclusively concentrated in the Southern Hemisphere in the ellipti-cal commissioning orbit (July–September 2009) and the quasi-frozen orbit to which LRO was transitioned in December 2011. In order to limit the heterogeneity of the crossovers included in the tide estimation, we restrict our analysis to the LOLA nominal orbit data, e.g., September 2009 to December 2011.
As noted by Rowlands et al. [2009], because the Moon is a slow rotator and the LRO orbit has a near-polar inclination, the crossover distribution is very different from what the Mars Orbiter Laser Altimeter encoun-tered at Mars [Neumann et al., 2001]. The primary effect is that few crossovers occur at low latitudes. Moreover, to minimize the effects of thermally related pointing offsets and possible measurement biases due to uncalibrated range walk at lower pulse energies (section 2.1), we only consider the crossovers where both tracks reliably measure the five spots (i.e., both tracks are on the dayside and away from the termina-tor). This considerably reduces the number of selected crossovers, in particular in the polar regions. Despite those restrictions designed to retain only the most promising LOLA crossovers, with 9902 orbits in our study period, our initial sample consists of nearly 500, 000 crossovers (Figure 1).
Geophysical Research Letters
10.1002/2013GL059085
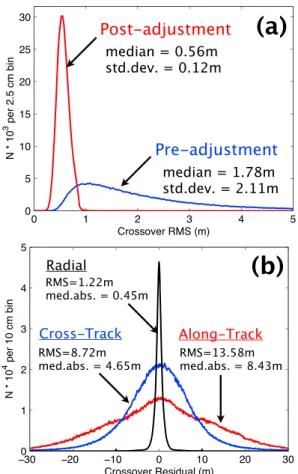
Figure 2. (a) Distribution of RMS radial residuals before
(blue) and after (red) adjustments. (b) Distribution of radial (black), cross-track (blue), and along-track (red) offsets. For clarity, the counts for the cross-track and along-track distributions are multiplied by 5.
2.3.2. Crossover Adjustment Method
At every crossover location, we estimate the rel-ative offset between the two altimetric profiles following the method described in Mazarico et al. [2010b]. Briefly, the concept is to interpolate the points from each track onto the other track and to minimize the residual height differences by esti-mating a single three-dimensional displacement between both tracks, in a local stereographic pro-jection. Typically, each track contains between 200and 1000 altimetric ranges in the common intersection area. The multibeam pattern of the LOLA ground track is especially important for the low-latitude crossovers, where intersecting tracks are nearly parallel. If no cross-track informa-tion was available (single-beam altimeter case), this geometry would prevent any realistic use of these crossovers.
We use the raw LOLA elevation data, without any prior correction for tide or geoid. As the cost function is not necessarily well behaved because of the interpolations involved, we improved the algorithm by initiating the minimization from 50 random guesses, more than enough to reach con-sensus and avoid local minima. Thus, for each crossover, we obtain a three-dimensional offset vector that brings both altimetric segments in best agreement and associated error estimates.
2.3.3. Results
After excluding crossovers with poor fits, high radial errors (> 1 m), large slopes (> 20◦), and high off-nadir angles (> 5◦), the total sample size is 354, 840. The radial residual root-mean-square (RMS) improves by a factor of 3 after applying each crossover’s best-fit offset vector, decreasing from 1.78 ± 2.11 m to 0.56 ± 0.12 m (Figure 2a). The lunar farside generally has higher RMS (Figure 1), likely indicating that the remaining residuals are the inevitable result of interpolating a rough surface from spots tens of meters apart.
Figure 2b shows the distributions of the relative offsets estimated by the crossover adjustment during mini-mization. Their statistics are consistent with the orbit reconstruction accuracy given by Mazarico et al. [2013]. The offset distributions in the horizontal directions are widened due to aliasing between the LOLA bore-sight model errors (20–150μ rad) and the seasonal spacecraft yaw flips. In the present study, we focus solely on the radial offsets, which are the new data we will use to detect the body tide. The detection of the body tide in the horizontal direction is unlikely at present given the large spread in horizontal crossover offsets (Figure 2b). M. K. Barker et al. (manuscript in preparation, 2014) will focus on the recovery of the boresight model corrections from the horizontal crossover adjustments.
3. Detection of the Body Tide
3.1. Initial Comparison to Tidal Model
To assess the quality of the new crossover measurements, we directly compare the relative radial dis-placements we obtained in section 2.3.3 to the radial deformation differences predicted at the crossover times by our simple tidal deformation model (section 1.2) with an a priori h2 = 0.03786. Figure 3a shows
a two-dimensional histogram of both sets, with warmer colors indicating a higher density. Because most crossover time separations are multiples of ∼14 days, the predicted radial offsets are generally small. The vertical scatter, an order of magnitude larger than the expected tidal signal amplitude, is due to the
(a)
RMS=1.25m N=354,840(b)
RMS=0.39m N=354,840Figure 3. (a) Two-dimensional histogram of measured and
predicted radial offsets. The red line is the1 ∶ 1line, not a fit. (b) Same as Figure 3a but after subtracting the orbital errors estimated by least squares (section 3.2).
remaining orbital errors. Nevertheless, the crossover measurements appear qualitatively consistent with the model (1 ∶ 1 line).
3.2. Comprehensive Least Squares Inversion
We follow this first look at the crossover offsets with a more formal least-squares inversion. In addition to our parameter of interest, h2, we
esti-mate a large number of “nuisance” parameters designed to absorb the effects of time-dependent orbital errors with frequencies higher than the tidal period. Due to the long temporal support of the crossovers (more than 2 years), it is not practi-cal to directly model the orbital errors with a fine time step (e.g., enough to sample an orbit period) [Neumann et al., 2001]. Instead, because orbital errors are typically once-per-revolution pertur-bations whose amplitude (A) and phase (𝜓) vary slowly with time, we use the associated param-eters u = A sin(𝜓) and v = A cos(𝜓), sampled every orbit (∼2 h). This is supported by the tempo-ral signature of the radial crossover offsets, initially dominated by the orbital errors. In total, we have 9799 uand 9799 v orbital parameters and one tidal parameter, h2. These empirical parameters also
guard against the low-degree gravity coefficients used for the LRO orbit determination, including the Love number k2, affecting our results.
For a given crossover with associated times t1and
t2, the modeled radial offset is𝛿r(t1) −𝛿r(t2) with
𝛿r(t) = 𝛿rorb(t) + h2 V(t)
g
= u(t) sin M(t) + v(t) cos M(t) + h2V(t)
g
where M(t) is the LRO true anomaly and V(t) the tidal potential, both known quantities.
The partial derivatives of the radial offset with respect to h2and the u, v parameters are trivial, and we accumulate the partial derivatives for all 354, 840 crossover measurements into a normal equation. Before inverting the system, we add a second-derivative smoothing constraint that favors slow changes in the u and v parameters. In addition to preventing singularities in the original matrix for the few 2 h periods with no crossover, it yields less noisy time series for the orbital errors and more importantly guards against over-fitting the data. The combined matrix is inverted using Cholesky decomposition, and we obtain the solution and its associated covariance matrix.
The estimated orbital errors closely follow the individual crossover offsets. The recombined radial amplitude
A = √u2+ v2, not shown, has a median value of 51 cm and a standard deviation of 1.26 m. Its magnitude
and temporal behavior are consistent with the orbit overlap results of Mazarico et al. [2012]. The correlations of the u and v parameters with h2are very small (RMS< 0.05, and a maximum less than 0.14). We also
com-puted the variance inflation factor (VIF), which measures the multicolinearity and possible aliasing among model parameters. We obtained a VIF of 2.9, which is below the threshold of 5 for sufficient orthogonality recommended by Rogerson [2001], itself significantly more restrictive than the more commonly used value of 10 [Hair et al., 1995]. This suggests that the estimated h2value is not significantly affected by colinearity
with the u and v parameters.
3.3. Results
Figure 3b shows the same 2-D histogram after removing the contribution of the estimated orbital errors from the measured crossover radial offsets. The vertical scatter due to orbital errors is significantly reduced,
Geophysical Research Letters
10.1002/2013GL059085
bringing the overall RMS from 1.25 m to 0.39 m. The largest fit residuals occur near the poles where the predicted tidal signal is smallest, but where fluctuations in instrument temperature may start to affect the coalignment of the LOLA receiver telescope and beam expander.
It is clear that the signature of the radial deformation due to the tide is detected from the LOLA crossover data. The estimated Love number is h2 = 0.0371, with a formal uncertainty of 0.0011 (or 3%). We obtained a similar uncertainty (0.0007) with a bootstrapping technique, by performing the inversion of 500 random resamplings of the full population. This estimated h2is 2% smaller than the a priori value from Williams et al. [2008] h2 = 0.03786 ± 0.0076 (20% uncertainty) [Williams et al., 2010], but we note that more recent
interior models derived from LLR and GRAIL data inferred larger values: 0.0476 ± 0.0064 [Williams et al., 2013] and 0.04240 (Williams et al., Lunar interior properties from the GRAIL mission, under review). We scale our formal uncertainty by a factor of 3 to avoid incompatibility with these values obtained from models that used the latest GRAIL k2results [Lemoine et al., 2013; Konopliv et al., 2013], resulting in an estimate of
h2= 0.0371 ± 0.0033. However, we note that while the LLR data are sensitive to a variety of effects, the LOLA crossover data are more directly sensitive to the body tide itself.
4. Summary and Future Work
We analyzed ∼350,000 LOLA crossovers to obtain accurate relative displacements between track pairs at intersection locations. We can account for the radial displacements as the combined effects of body tide surface deformation and of errors in spacecraft position reconstruction. The latter are modeled as high-frequency parameters to enhance the recovery of the tidal Love number h2. After least squares
inver-sion of the LOLA crossover data, we obtained an h2value of 0.0371 ± 0.0033, which is consistent with recent
estimates based on LLR data.
In future work we will improve the calibration of the nightside two-spot tracks to increase the number of usable crossovers and provide a more uniform temporal sampling. We will assess the spatial homogeneity of the surface deformation response to the forcing potential. Differences would reveal asymmetries in the lunar interior, which could have remained undetected by the nearside LLR data.
References
Andrews-Hanna, J. C., et al. (2013), Ancient igneous intrusions and the early expansion of the Moon revealed by GRAIL gravity gradiometry, Science, 339, 675–678, doi:10.1126/science.1231753.
Araki, H., et al. (2009), Lunar global shape and polar topography derived from Kaguya-LALT laser altimetry, Science, 323, 897–900, doi:10.1126/science.1164146.
Chin, G., et al. (2007), Lunar Reconnaissance Orbiter overview: The instrument suite and mission, Space Sci. Rev., 129, 391–419, doi:10.1007/s11214-007-9153-y.
Hair, J. F., et al. (1995), Multivariate Data Analysis, Macmillan, New York.
Kaula, W. M. (1966), Theory of Satellite Geodesy: Applications of Satellites to Geodesy, Blaisdell Publishing Co., Waltham, Mass. [Reprinted by Dover Publications, New York, 2006; ISBN: 0-486-41465-5.]
Konopliv, A. S., S. W. Asmar, E. Carranza, W. L. Sjogren, and D. N. Yuan (2001), Recent gravity models as a result of the Lunar Prospector mission, Icarus, 150, 1–18, doi:10.1006/icar.2000.6573.
Konopliv, A. S., et al. (2013), The JPL lunar gravity field to spherical harmonic degree 660 from the GRAIL primary mission, J. Geophys. Res. Planets, 118, 1415–1434, doi:10.1002/jgre.20097.
Lemoine, F. G., et al. (2013), High-degree gravity models from GRAIL primary mission data, J. Geophys. Res. Planets, 118, 1676–1698, doi:10.1002/jgre.20118.
Mazarico, E., F. G. Lemoine, S.-C. Han, and D. E. Smith (2010a), GLGM-3: A degree-150 lunar gravity model from the historical tracking data of NASA Moon orbiters, J. Geophys. Res., 115, E05001, doi:10.1029/2009JE003472.
Mazarico, E., G. A. Neumann, D. D. Rowlands, and D. E. Smith (2010b), Geodetic constraints from multi-beam laser altimeter crossovers, J. Geod., 84(6), 343–354, doi:10.1007/s00190-010-0379-1.
Mazarico, E., D. D. Rowlands, G. A. Neumann, D. E. Smith, M. H. Torrence, F. G. Lemoine, and M. T. Zuber (2012), Orbit determination of the Lunar Reconnaissance Orbiter, J. Geod., 86(3), 193–207, doi:10.1007/s00190-011-0509-4.
Mazarico, E., F. G. Lemoine, S. J. Goossens, T. J. Sabaka, J. B. Nicholas, D. D. Rowlands, G. A. Neumann, M. H. Torrence, D. E. Smith, and M. T. Zuber (2013), Improved precision orbit determination of Lunar Orbiters from the GRAIL-derived Lunar Gravity Models, 23rdAAS/AIAA Space Flight Mechanics Meeting, AAS 13-274, Kauai, Hawaii.
Neumann, G. A., D. D. Rowlands, F. G. Lemoine, D. E. Smith, and M. T. Zuber (2001), Crossover analysis of Mars Orbiter Laser Altimeter data, J. Geophys. Res., 106, 23,753–23,768, doi:10.1029/2000JE001381.
Rogerson, P. A. (2001), Statistical Methods for Geography, Sage, London.
Rowlands, D. D., F. G. Lemoine, D. S. Chinn, and S. B. Luthcke (2009), A simulation study of multi-beam altimetry for lunar reconnaissance orbiter and other planetary missions, J. Geod., 83(8), 709–721, doi:10.1007/s00190-008-0285-y.
Smith, D. E., et al. (2010a), The Lunar Orbiter Laser Altimeter investigation on the Lunar Reconnaissance Orbiter mission, Space Sci. Rev., 150, 209–241, doi:10.1007/s11214-009-9512-y.
Smith, D. E., et al. (2010b), Initial observations from the Lunar Orbiter Laser Altimeter (LOLA), Geophys. Res. Lett., 37, L18204, doi:10.1029/2010GL043751.
Wieczorek, M. A., et al. (2013), The crust of the Moon as seen by GRAIL, Science, 339, 671–675, doi:10.1126/science.1231530. Acknowledgments
This work was supported by NASA grants NNX09AM53G and NNG09HP18C. We thank the LRO project and the LOLA Engineer-ing and Science teams. We also thank T. Sabaka for his advice and assistance with the least squares inversion. The authors thank C.K. Shum and J.G. Williams for their constructive comments. The Editor thanks C.K. Shum and an anonymous reviewer for their assistance in evaluating this paper.
Williams, J. G., D. H. Boggs, and W. M. Folkner, (2008), DE421 lunar orbit, physical librations, and surface coordinates, Rep. IOM 335-JW,DB,WF-20080314-001, Jet Propul. Lab., Pasadena, Calif.
Williams, J. G., S. G. Turyshev, and W. M. Folkner (2010), Lunar geophysics and lunar laser ranging, Ground-based Geophysics on the Moon, Abstract no. 3038, Tempe, Ariz.
Williams, J. G., D. H. Boggs, and W. M. Folkner, (2013), DE430 lunar orbit, physical librations, and surface coordinates, Rep. IOM 335-JW,DB,WF-20130722-016, Jet Propul. Lab., Pasadena, Calif.
Zuber, M. T., D. E. Smith, D. H. Lehman, T. L. Hoffman, S. W. Asmar, and M. M. Watkins (2013a), Gravity Recovery and Interior Laboratory (GRAIL): Mapping the lunar interior from crust to core, Space Sci. Rev., 178, 3–24, doi:10.1007/s11214-012-9952-7.
Zuber, M. T., et al. (2013b), Gravity field of the Moon from the Gravity Recovery and Interior Laboratory (GRAIL) mission, Science, 339, 668–671, doi:10.1126/science.1231507.