Publisher’s version / Version de l'éditeur:
Journal of the Acoustical Society of America, 53, 6, pp. 1535-1543, 1973-06
READ THESE TERMS AND CONDITIONS CAREFULLY BEFORE USING THIS WEBSITE. https://nrc-publications.canada.ca/eng/copyright
Vous avez des questions? Nous pouvons vous aider. Pour communiquer directement avec un auteur, consultez la
première page de la revue dans laquelle son article a été publié afin de trouver ses coordonnées. Si vous n’arrivez pas à les repérer, communiquez avec nous à PublicationsArchive-ArchivesPublications@nrc-cnrc.gc.ca.
Questions? Contact the NRC Publications Archive team at
PublicationsArchive-ArchivesPublications@nrc-cnrc.gc.ca. If you wish to email the authors directly, please see the first page of the publication for their contact information.
NRC Publications Archive
Archives des publications du CNRC
This publication could be one of several versions: author’s original, accepted manuscript or the publisher’s version. / La version de cette publication peut être l’une des suivantes : la version prépublication de l’auteur, la version acceptée du manuscrit ou la version de l’éditeur.
Access and use of this website and the material on it are subject to the Terms and Conditions set forth at
Acoustical privacy in the landscaped office
Warnock, A. C. C.
https://publications-cnrc.canada.ca/fra/droits
L’accès à ce site Web et l’utilisation de son contenu sont assujettis aux conditions présentées dans le site LISEZ CES CONDITIONS ATTENTIVEMENT AVANT D’UTILISER CE SITE WEB.
NRC Publications Record / Notice d'Archives des publications de CNRC:
https://nrc-publications.canada.ca/eng/view/object/?id=eb05ad5c-f8a0-4898-84fd-aa5acc33802a https://publications-cnrc.canada.ca/fra/voir/objet/?id=eb05ad5c-f8a0-4898-84fd-aa5acc33802a
A. C . C . Warnock
Building Physics Section, Division of Building Research, National Research Council of Canada, Ottawa, Canada
(Received 27 November)
Two landscaped oflices were used for field studies of the acoustical isolation value of masking noise, absorptive ceilings and partial-height screens. The occupants of one of the oflices were recruited for a subjective study of the relative acceptability of various masking noises. The study showed that this group consistently preferred
less noise - a conclusion that contradicts some previous experience. Interviews indicated that the acceptability
of masking noise is closely linked to the occupants' activities and the resulting need for privacy. Propagation measurements were made under a flat lay-in ceiling configuration to determine the effectiveness of screens, ceiling materials and ceiling baffles. The ceiling baffles were not found to be a practical means of ensuring a low ceiling reflection coeflicient. The results of the measurements are analyzed in terms of changes in articula- tion index. Consideration of the area disturbed by a hypothetical speaker emphasizes the importance of small relative changes in articulation index caused by small changes in physical parameters.
Subject Classification: 2.3.
INTRODUCTION
The landscaped office is becoming more and more prevalent and, as a result, the problems peculiar to it are being studied at some length. Especially in dispute is the precise value of certain elements to the land- scaped office. Particular ceiling systems of varying degrees of complexity have their proponents and opponents. Ceiling baffles are praised or disparaged; screens also may be overrated or summarily dismissed. Electronic masking systems are regularly recommended but the noise spectrum used varies in character accord- ing to the dictates of the consultant or supplier.
The studies described here were carried out in two different offices with the intention of clarifying some of these issues. Both objective and subjective experiments were performed and each is dealt with separately. The subjective experiments were carried out in an office section measuring 180 ftX6O ft where the staff was a mixture of professional, administrative, and clerical workers. One series of subjective experiments was de- signed to provide information on staff reaction to differ- ent masking spectra a t different sound levels. A second series was meant to evaluate the masking effectiveness of the different sounds. Objective propagation studies were used to determine the importance of ceiling ab- sorption and baffle and screen configuration.
I. USER REACTION TO MASKING NOISE
When an electronic masking system is used in an open office, it is usually advised that the staff be kept unaware of its existence. This avoids unnecessary prob- lems with complaints from persons using the masking system as a focus for verbal sublimation of other un- voiced minor grievances.
However, in this case, some information on the staff's reactions to various levels and spectrum shapes was
desired and they were informed a t the outset that a masking system would be in operation. They were told that it was believed that such a system would improve their working conditions and that their help was needed in ascertaining the best spectrum shape and optimum level of sound. Thus while the subjects were aware that their acoustic environment would vary they did not know just exactly how.
A. Experiment I
Each day the office staff were presented with two different masking sounds, one in the morning and another in the afternoon. These sounds differed either in level or in spectrum shape but not both. The subjects were asked to mark a card giving their preference using a 5-point scale with the following categories: much prefer morning; slightly prefer morning; no preference; slightly prefer afternoon; and much prefer afternoon.
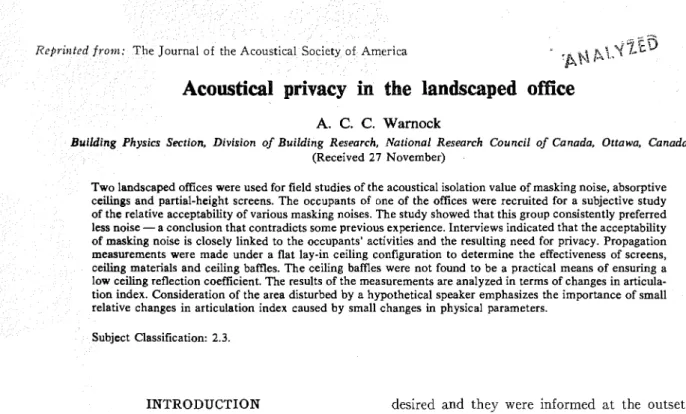
Figure 1 shows the spectra used in the experiment. Described generally, these diminished with frequency
a t 3, 5, and 7 dB/octave and were denoted 1, 2, and 3,
respectively. The shape of spectrum 4 was adjusted by ear, without the use of a spectrum analyzer, until it was free of pronounced hiss, rumble, or other distin- guishing feature. Three sound levels were used in the experiments: 51,48, and 45 dBA. These are denoted A, B, and C. Thus B2 is spectrum 2 a t a level of 48 dBA. (These levels do not include normal office noise, e.g., typewriters and conversational sounds.) During the course of the experiment the comparisons were repeated in reverse order to eliminate any possible time-of-day effects, but no such effects were found.
The results obtained from these comparisons were
somewhat of a surprise to the experimenters. The office
staff unequivocally rejected the masking noise system. When asked to choose between noises differing in level,
W H R N O C K
F R E Q U E N C Y . H E R T Z
FIG. 1. Masking spectra used in obtaining user reaction. All are
a t a level of 48 dB, with the exception of the bottom ambient
spectrum which is a t a level of 45 dBA. The curves are displaced
from each other by 10 dB for clarity. These were all measured a t
a standard position in the middle of the office.
they clearly chose the quieter condition. When asked to choose between any two spectra, no marked prefer- ences emerged. Even when asked to choose between
spectra 1 and 2 there was no marked preference al-
though spectrum l was deemed by the experimenters to have too much high-frequency content. Figure 2 sum- marizes most of the results obtained.
The induction heating/cooling units around the ex- terior walls of the office emitted a fairly loud hissing sound that was quite prominent in some areas and added to the general background noise level. For conl- parison the induction units were switched off for a day and a choice requested between 45-dBA masking sound and the low background noise level of about 40 dBA that resulted when the air diffusers were off. Even this very low background noise condition was preferred to the slight amount of masking noise.
B. Experiment 2
These results were quite unexpected and, in the hope of gaining some insight into the reasons for them, a longer experiment lasting two weeks was initiated. During the first week the spectrum marked B4 in Fig. 1 was broadcast at 48 dBA. During the second week, the masking system was switched off. At the end of this experiment the staff were interviewed individually and asked for their reactions to the previous two weeks and about their privacy requirements. Quite a number of the staff had not noticed any difference between the two weeks but of those who had, the preference again was for the quieter condition.
From the interviews it was obvious that the staff in this particular office had no great desire for privacy and their work was of such a nature that intruding
speech sounds did not distract them. Thus, to this particular office staff, the masking noise was an un- warranted intrusion. I t should be emphasized that this result is a t variance with that obtained in other offices where the nature of the work demanded a higher degree of isolation. In those cases, the staff readily accepted an increase in background sound level to ensure a greater degree of privacy.
In one such experiment1 employees with expressed need for privacy were allowed to adjust the level of masking noise to suit themselves. Initially the level was
set at 50 dBA but this was considered too high fol
comfort. After a few days the level settled on was 48 dBA. This was considered unobtrusive but high enough to create a satisfactory privacy condition.
Other work2 has shown that when the baclrground
level increases beyond about NC 40 (48 dBA) persons
talking will raise their voices to compensate for the in- creased noise. It would seem then that 48 dBA is about the ma~imuin masking level that can usefully be employed.
C. Experiment 3
One unfortunate feature of the above experiments was that the occupants of the space. were made aware of the masking noise and questioned repeatedly about it. Thus, in this respect, the situation was artificial. I t was considered worthwhile, therefore, to conduct one last experiment without forewarning the occupants. After three months of no artificial noise the masking system
was again switched on and adjusted to about 1 dBA
above the natural background-noise level in the office. Each week the level was increased by about 13 dBA. When the level reached approximately 47 dBA the sound was noticed and coinplaints were made about it.
L O W E R L E V E L H I G H E R z Y O 5 d B l O C T S P E C T R U M 7 d B l O C T I'IG. 2. Summary of subjective reactions to masking noise. (a) Mean response when subjects chose between spectra
at different levels. (b)
Mean response when subjects were choosing
between spectrum 2 and
, l C O U S T I C A I , P R I V A C Y I N
D. Conclusions '
T H E 1 , A N D S C A P E D 0 I ; I : I C E
I t was obvious from these esperi~nents that therc are
office workers for whoill aural privacy is not a prime consideration. Their work does not demand a high degree of concentration so they are not disturbed by sounds from neighboring work stations. For the group considered here low background noise levels were pre- ferred, so no masking system should be usecl. The acoustical ceiling material was not particularly ab- sorbent (NRC=0.45) but since the loss of privacy caused by ceiling reflections was not important, it was not necessary to install more efficient material.
Faced with designing an office for a group such as this, the designer could economize on acoustical frills and concentrate on more important factors affecting
user satisfaction. If the structure of the organization
is such that the office may be occupied at a later date by a staff requiring a higher degree of privacy, then economics may necessitate the initial installation of high-quality ceiling boards, absorptive treatment of vertical surfaces, and the wiring for a masking systenl, even if not immediately required.
11. SPEECH-INTELLIGIBILITY TESTS
A. Subjective Tests
The effectiveness of a given noise spectrum as a masking device can be estimated by making objective measurements and using standard articulation index
calculation^.^ I t was considered worthwhile, however, to look into the possibility of a direct subjective nlea- sure of speech intelligibility.
The standard articulation index tests require the use of a trained test crew. In this case it was not possible to obtain a trained crew, and the services of about a dozen volunteers were used. They were given an audio- metric examination and, provided their hearing was rated normal for their age, they were accepted. The resultant spread in aural acuity and listening skills was reflected in the test scores.
C A L C U L A I E D A R T I C U L A T I O N I N D E X
FIG. 4. Mean percentage score on Grifiths' rhyming test versus calculated articulation index for all test positions and noise con- ditions. T h e straight lines are linear rcgressio~l lines.
The test chosen was one developed by Grifliths4 for another purpose. I t was chosen for its ease of use and scoring and because no training is required for the test crew. The listeners are presented with a test form con- taining 250 words arranged in rhyming groups of five. The talker reads one of the five words and the listener is obliged to mark the one he believes he heard. The
listener must make a guess if he is not sure what he
heard and the chance score on the test, therefore, is 20%.
The test was administered in a central part of the
ofice that was vacated during the lunch period. The talker monitored his voice level by observing the peak excursion on a sound-level meter set to the A-weighted scale with fast response and maintaining a peak ex- cursion of 55 dBA. The estimated equivalent long-term rms of the speech is about 55 dB.
Thirteen listener positions were selected and after each test the listeners moved to new positions. Usually about eight to ten tests were administered under one masking sound condition during each lunch period. The mean score was then calculated for each position.
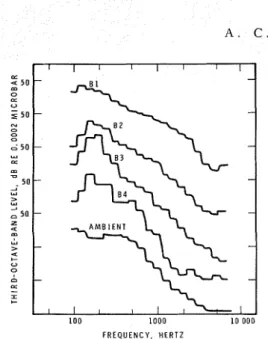
The results obtained were as expected, i.e., the louder the noise, the lower the score; the greater the noise in the critical bands around 2000 Hz, the lower the score. The mean subjective score in each position for all test conditions was normalized to the score obtained with no masking noise. These normalized scores were then averaged to produce Fig. 3, which shows the etiective- ness of the different noise conditions in masking speech.
:: 0 . 8
C1
0.6 B. Objective Tests
-
I t was considered of interest to compare the sub- jective scores obtained with objective predictions for each listener position and noise condition. To do this, propagation measurements and noise level measure-
ments were made as follows :
AMBIENT A 3 8 3 A 2 6 2 8 1 ~ 4 (1) The speaker-listener propagation relation was N O I S E C O N D I T I O N determined by placing a loudspeaker at the talker posi- FIG. 3. Mean subjective score for different noise conditions tion and measuring the in A-weighted level at
normalized t o score obtained under ambient conditions. each listener position. In each case the loudspeaker was
D I S T A N C E F R O M L O U D S P E A K E R . F E E 1
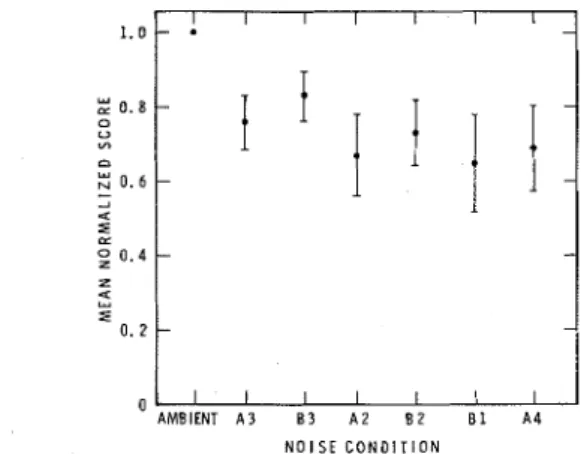
FIG. 5. Propagation in office with and without baffles on 5 ft centers. (a) 5-ft-high screen 3 ft from loudspeaker, (b) 5-ft-high screen 6 ft from loudspeaker.
turned directly to the listener position; a separate cor- rection for talker orientation was made later.
(2) The background noise level in dBA in each posi-
tion was measured for each test condition.
(3) From this information the articulation indes was calculated in each case (assuming an ideal voice with a long-term rins level of 65 dB a t 3 ft and assuming that the speaker was talking directly to each listener position). Azimuthal corrections were then made for the actual orientation of the talker. This resulted in a set of calculated articulation indices for each test con- dition and for each listener position.
The correlation between the calculated articulation index and the mean subjective test score can be seen in Fig. 4. The two lines are the linear regression lines. There is no a priori reason to expect a linear relationship but this analysis leads to a correlation coefficient of 0.82 which is quite satisfactory in view of the experi- mental conditions. I t is necessary, however, to point out a discrepancy in the foregoing, i.e., that the ideal
voice level assumed in the A1 calculations was 65 dB
whereas the real voice level was closer to 55 dB. This difference of 10 dB, if taken into account, forces a re- duction in the calculated articulation index values of 0.33. This would mean that when the articulation index is zero, subjects can score 50% on the Griffiths' test.
This result seemed to warrant further investigation so a comparison between the standard intelligibility test5 and the Griffiths' test was made in the laboratory using a carefully selected and trained test crew. The results obtained exhibited the same behavior again. I t
would seem that this feature then is a charact '
the Griffiths' test.
To achieve acceptable privacy in an ope the sense of freedom from intrusion), it considered that the articulation indes sh
than 0.15. I11 the range of articulation index fr
down to zero, small changes in articulation in duce large changes in sentence intelligibility tests used to evaluate the articulation index in region should either be very sensitive to small changes in articulation index or very accurate. The Griffiths' test is not sensitive enough in this region and unless used with a carefully selected crew, is not accurate enough. I t must be concluded, therefore, that the Griffiths' test is not suitable for making q
reliable estimates of the articulation index i office.
In view of the difficulties associated w' subjective articulation index measurement appear that objective measurements will
most comtnon and n ~ o s t easily used inethod
articulation indes estiinations in the op Nothing in this work suggests that objective ments are unsuitable.
111. PHYSICAL MEASUREMENTS
The measurements described here were performed in two different offices which had standard lay-in ceiling
boards supported on T bars. The behavior of sound in
ofices was determined by broadcasting continuous pink noise from a loudspeaker and measuring the sound pres- sure level as a function of distance for different screen and baffle configurations and different ceiling materials. All the screens used were 5 ft wide. Figure 5 shows the A-weighted sound-pressure levels obtained in one office where baffles were added to the basic ceiling in a modi- fied herringbone pattern which gave a separation of 5 ft. These baffles were 8 f t X l ft and were made of glass fiber covered with porous cloth. The basic ceiling was mineral fiber tile which had a Noise Reduction Coeffi- cient (NRC) of 0.45, as measured in a reverberation
room on a No.
7
mounting. I t can be seen that, in thiscase, the baffles did not decrease the signal measured behind the screen and therefore no iGrovement in privacy was obtained.
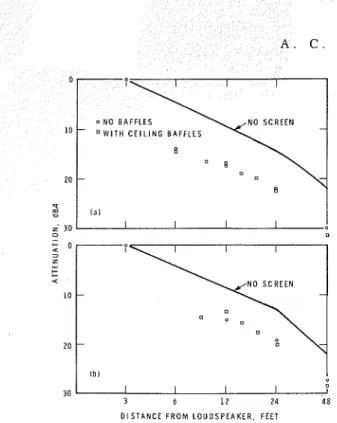
In the second office a study was made of two different ceiling boards used alone and with two different baffle configurations. The ceiling materials were A, fissured
mineral-fiber board
Q
in. thick with an NRC of 0.55and B, glass-fiber board
Q
in. thick faced with porouscloth, with an NRC of 0.85. The baffles were constructed from 4 f t X l ft sheets of $-in. plywood. These were covered on the side facing the loudspeaker with $-in. glass fiber which was coated with a perforated vinyl. The baffles were suspended from the ceiling in parallel rows a t right angles to the line of measurement. B d e
separations of 2 and 4 f t between rows were used.
seen in Figs. 6 and
7
.
I n Fig. 6(a), for theial required is comparable to the ceiling itself. ew design it is economically sensible to install a
D I S T A N C E F R O M L O U D S P E A K E R . FEET
basic materials without baffles. Two screen
and no intervening screen a t a distance of 12 ft.
in front of the loudspeaker.
F~~~ such analyses it is possible to calculate the by reading along a row. For a fixed ceiling condition,
changes in articulation index that occur when changes the benefits obtained by altering screen size and dis-
are made in the ceiling baffle configuration, screen con- tance from the source are found by reading down a
figuration, or basic ceiling material. Since the intrusive- column.
ness of speech or lack of speech privacy is the major The conclusions to be drawn from I are in
essence the same as those already stated. The addition of the baffles on 2-ft centers can improve the acoustically hard ceiling until it is as good as the more absorbent N O S C R E E N
ceiling. However, as already noted, this is not usually an economically sound solution. The results obtained with baffles added to the more absorbent ceiling seem slightly a t odds with the dBA results but this might be attributed to the fact that the glass-fiber ceiling board
FIG. 6. Propagation with
different ceiling materials 30 1 2 24 is relatively transparent to sound and there may be
and baffle arrangements for D I ~ T : N C E FR:M L O U D S P E A K E R , F E E T some anomalies due to plenum effects. I n any event,
4 ft 8 in. screen at 3 ft.
(a) Material B, NRC= the baffles do have some effects but would again appear
N O S C R E E N to be an unattractive solution.
0.85. (b) Material A, NRC
l o
=0.65. I n view of the improvement obtained by utilizing a
0 -
+ more absorbent ceiling material, one might reasonably
4
z, A A assume that the signal received behind the screen could
0 4 ' . 0 . c. be reduced still further by using a material that is as
IbJ absorbent as possible. This obviates the need for bafRe
30
3
,
24 construction and installation. Ceiling boards approach-D I S T A N C E F R O M L O U D S P E A K E R . F E E T ing NRC values of 1.0 are readily available but, un-
A . C . C . W A R N O C K
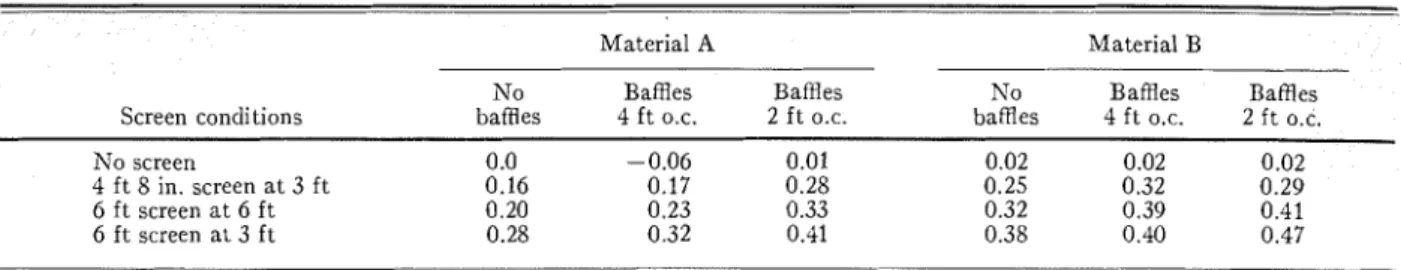
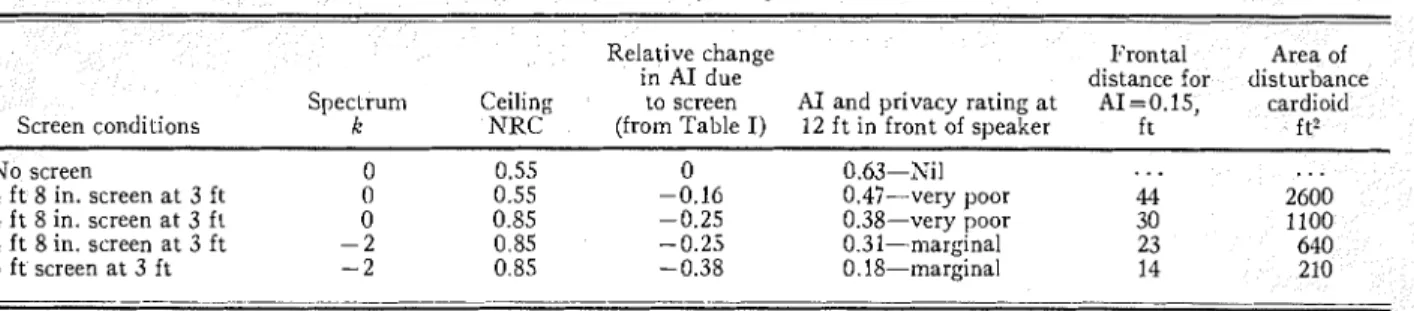
TABLE I. Calculated decrease of articulation index with respect to a reference condition at 12 ft from the loudspeaker under "laterial
A with no intervening screen and no baffles.
Material A Material B
No Baffles Baffles No Baffles Baffles
Screen conditions bafRes 4 ft O.C. 2 ft O.C. baffles 4 f t O.C. 2 ft O.C.
No screen 0.0 -0.06 0.01 0.02 0.02 0.02
4 ft 8 in. screen a t 3 ft 0.16 0.17 0.28 0.25 0.32 0.29
6 ft screen a t 6 ft 0.20 0.23 0.33 0.32 0.39 0.41
6 ft screen at 3 ft 0.28 0.32 0.41 0.38 0.40 0.47
fortunately, circumstances prevented their being tested under these conditions. In the light of other r e ~ e a r c h , ~ one must assume that a more absorbent ceiling would perform at least as well as the best configuration tested here.
As the experimental data point to the interaction of screen and ceiling as the most important privacy- determining factor, it seelns convenient at this point to consider the function of a screen in the open oflice. Sound at the important speech frequencies can reach
the other side of a screen in four ways : by direct trans-
mission through the screen; by diffraction around the screen; by reflection from vertical flanking surfaces; and, by reflection froin the ceiling.
The direct transmission can easily be reduced to a negligible level by the appropriate choice of construc- tion materials. In the absence of any flanking reflections, the insertion loss of a screen of a given size in a given configuration is determined by diffraction and can be
estimated from the work of illaekawa."n a large open
office, flanking due to reflection from vertical surfaces may be a problem around the perimeter and in the vicinity of colunms, large filing cabinets, or other pieces of furniture. However, any such potential reflectors, especially perimeter walls and columns, are generally treated with absorbent materials. The dominant re- flecting surface that affects every work station is the ceiling.
I t is a straightforward task to calculate the mag- nitude of a signal reflected from the ceiling to a neigh-
I b l
z'30
m
O C T A V E B i N O C l t l l E R F R E Q U E N C Y
FIG. 8. Octave band attenuation with respect to levels measured at 3 ft for speaker-microphone separation of 12 ft. (a) Material A, 6 ft screen at 3 ft. (b) Material B, 6 ft screen at 3 ft. (c) Material A, 4 ft 8 in. screen at 3 ft. (d) Material B, 6 ft 8 in. screen at 3 ft.
boring work space if the reflection coefficient for the particular angle of incidence is known. To illustrate the importance of the ceiling-reflection properties Fig. 9 has been produced and shows the articulation index calculated for two screen sizes as a function of ceiling- reflection coeflicient. For the purposes of this figure, an ideal voice of 65-dB long-term rills was assumed with
the octave band levels shown in Table 11. This table
also shows the assumed noise spectruin which has a
level of 48 dBil. The talker and listener were assumed
to be a t a height of 4 ft under a 9-ft-high ceiling and
separated by a distance of 12 ft. The diffracted signals
shown in Table I1 were calculated according to Mae-
kawa's data for a semi-infinite screen, while the reflected signal was obtained assuming the same reflection co- efficient in each band. Although this is an idealized calculation such considerations lead to the same con- clusion as does the empirical data, namely that the ceil- ing is the single most iinportant acoustical surface in the open plan office in that it determines the perform- ance of the screens.
The ceilings investigated here were standard flat s!.stems modified by adding baffles. Coffered ceilings and open systeins with absorbent baffles suspended below exposed service ducts have been proposed and used. At this time one can only guess at the perfor- mance of these systems. Obviously a simple measure- ment of absorption will not suffice and the problem of rating such ceilings requires research and discussion.
0.5 - C Z Lu ; 0.4- - u. u. Lu 0 " 0 . 3 - Z 0 - +. U
;
0 . 2 - Lu w 0.1 - O O 0.1 0.2 0 . 3 0.4 A R T I C U L A T I O N I N D E X FIG. 9. Articulation index calculated behind screens 5 ft and 6 ft high for varying ceiling re- flection. Talker-listener separation is 12 ft.A C O U S T I C A L P R I V A C Y I N
IV. PULSE MEASUREMENTS
The propagation experiments described so far used continuous pink noise as a s i s a l . The received signal
level therefore included diffracted sound. and ceiling
-
and other reflections. Steps were taken to eliminate most of the unwanted reflections but these were not entirely successful. I n an attempt to separate these components, some propagation measurements were made in the second office using pulses of sound instead of continuous random noise. The pulse received a t a movable nlicrophone was displayed on an oscilloscope and compared with a reference pulse, monitored 6 in. in front of the loudspeaker. I t was possible to identify the combined direct and diffracted pulses that arrived first and reasonably accurate results were obtained for these.
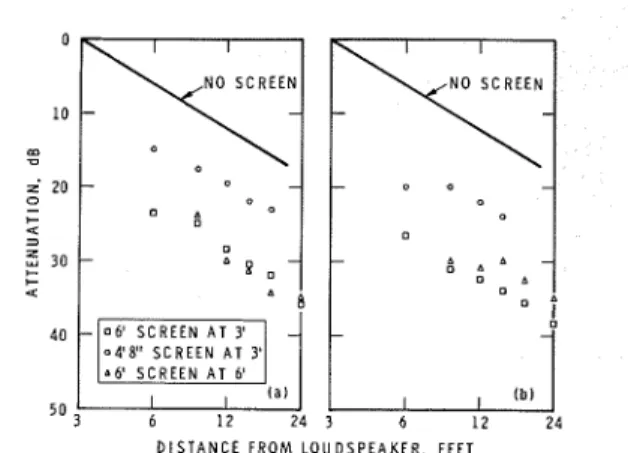
Figure 10 shows the direct pulse level as a function of distance for two frequencies, 1000 and 2000 Hz, and for three screen conditions. From this one can estimate the ultimate attenuation that is possible with the screen a t these two frequencies without reflections. The in- sertion loss obtainkd for the 6-ft-high screen agrees quite well with predictions from Maekawa's theory. The agreement is not as good for the smaller screen but this is probably due to the relatively large size of the source. Comparing the values of attenuation a t the 12 ft distance in Fig. 10 with those in Fig. 8, one can see the differences due to flanking reflections. The reflections were easily seen in the oscilloscope photographs but the complesity of the traces precluded complete identifi- cation of the surfaces causing the reflections.
To some degree it was possible to identify the pulse from the ceiling. However, the pulse was generally dis- torted and mixed with other reflections from un- identified surfaces and the accuracy obtained for the ceiling reflection measurements was too low to allow reliable conclusions to be drawn.
V. AREA OF DISTURBANCE
AROUND A TALKER
The changes in articulation index or signal level found to be important in esperiments such as these
TAULE 11. Octave-band levels (in dB) used to calculate A1 behind screen under different ceilings. (The results of the calcu- lations are shown in Fig. 13.)
Octave-band center frequency 250 500 1000 2000 9 0 0 Peak voice signal a t
12 ft in absence of screens 60 61 56 50 46 Noise spectrum [48 dBA] 48 47 43 37 31 Diffracted voice signal for
6 ft screen a t 6 ft 50 49 43 33 26 Diffracted voice signal for
5 ft screen a t 6 ft 52 52 46 38 32
T H E L A N D S C A P E D O F F I C E
D I S T A N C E F R O M L O U D S P E A K E R . FEE1
FIG. 10. Direct pulse measurements in second office for (a) 1000 Hz. (b) 2000 Hz.
often appear quite small to lay observers who are only concerned with the most economical method of obtain- ing user satisfaction. I t has been found effective to translate these signals and A1 changes into the area or range of disturbance around an individual occupant. This permits a strictly economic approach to the assess- ment of the influence of various acoustical parameters. Over a fairly wide range in A1 one can write without
serious error :
A1 = [Speech long-term rms (dB)
+12-Noise [dBA]+k]/30.
Constant k takes into account the varying effectiveness
of the masking noises due to spectral differences. An examination of some typical spectra showed that this
constant is usually in the range -2< k < +2. The ex-
pression above is in error a t the extremes of the range of A1 and would not hold for spectra that were very different from the ideal speech contour or the typical fairly smooth masking spectrum which is commonly used. For the purposes of this discussion, however, it is quite adequate.
The voice level a t any required distance can be esti- mated by assuming a level of 65 dB a t 3 ft from the talker and a reduction of 5 dB for each doubling of distance. (This value may be limited by reflections from the floor.) The lack of rigor in the foregoing and in the ensuing approach is considered acceptable in view of the resulting heuristic simplicity. With these two as- sumptions and an assumed noise level of 48 dBA, which would appear to be optimum, one only has to know
the value of k for the particular spectrum in use to be
able to calculate the A1 a t any distance in the absence of any intervening screens. Figure 11 gives an example of idealized plots of A1 versus distance for the different conditions listed in Table 111, which also lists some of the information gleaned from the figure. Using such a diagram and the corrections from Table I, it is easy to illustrate how a small change in A1 caused by improving the masking spectrum or by altering the screen condi-
I n the same zone, this change of A1 causes a c 3 f t in the distance one must be from the talk
A. The Disturbance Cardioid tain acceptable privacy.
tour can be drawn around an individual which is the between two adjacent workspaces, it is of
locus of AI=O.lj. Assuming that the screen conditions to make point-to-point calculations. However,
effect of small changes in AI.
The areas of these cardioids are marked on the figure it becomes much easier to demonstrate the irnpor
and are also listed in the Table 11. The area changes of making small improvements to the articulation
are clearly quite large. However, Fig. 13, which is a
plot of cardioid area versus the value of the articulation VI. CONCLUSIONS
index a t 12 ft from the talker, shows that when one is
almost in the acceptable privacy zone, a change in A1 There never was any doubt that a lnaslting noise sys-
tem would lower the signal-to-noise ratio in an open
x - ,., 0 5 0 6 - = D - -
-
a 2 0 4 - u = FIG. 1 2 . Distur-b
-
- . . . - bance cardioids cor-a ~ A A R G I N A L P R I V A C Y responding to the
four conditions b, c, d, and e in Table 111.
3 6 10 20 I0 10 50 The numbers are
O I S I A N C I F R O I S P I A K I R F E I T the areas in square
feet.
FIG. 11. Variation of articulation index with distance from the speaker (a) No intervening screen; 48 dBA noise with k = O . (b) 4 f t 8 in. screen 3 ft from talker; 48 dBA noise with k = O , ceiling material A. (c) 4 ft 8 in. screen 3 f t from talker; 48 dBA noise with k = O , ceiling material B. (d) 4 f t 8 in. screen 3 f t from talker;
48 dBA noise with k = - 2 , ceiling material B. (e) 6 f t screen a t
-
3 f t from talker; 48 dBA noise with k = - 2 , ceiling material R. OFT
to a point on the other side is the core problem in taining privacy in the open office. One has to consi parison of the short pulsed sound study with the con- tinuous sound results seems to indicate that the major component is usually the reflected sound. The work of
A R T I C U L A T I O N I N D E X , 1 2 I N F R O N T O F ~ ~ T A L K E R Maekawa confirms this and predicts that, in the absence
of ceiling or other reflections, the screens will perform
ce cardioids versus articulation index well enough to provide privacy at typical distances. The
best ceiling then is obviously one that gives no reflection a t all, but an adequate ceiling need only allow the hence lower the intelligibility of intruding screen to perform as well as is necessary to achieve
was widely held, however, that aural privacy at typical separations.
emely important in open offices. Our findings I n addition to the flat ~ ~ u n d - ~ b ~ ~ ~ b i n ~ ceilings dis-
indicate that there are cases where this is not cussed here, other systems such as coffered ceilings have
nversel~, experience with other has been used. To complicate matters further sound absorp-
arly demonstrated that lack of privacy can cause a tion must generally be integrated with lighting and
eat deal of discontent. ventilation requirements as well. There is, therefore,
Id be in mind then need to develop acoustical criteria and test methods
ere the does not demand a that can be applied to all such systems, preferably both
in the laboratory and in the field.
ACKNOWLEDGMENT
course inconsistent with the major virtue of the open This paper is a contribution from the Division of
office which is the quick rearrangement of people and Building Research, National Research Council of
activities in the space, and the office could not then be Canada, and is published with the approval of the
successfully used at a later date by a staff with greater director of the Division.
need for ~ r i v a c v .
If future use includes a possible increase in privacy
needs, then economics would dictate a good initial 'L. W. Hegvold, "Experimental Masking Noise Installation in an Open Planned Office," Nat. Res. Council of Canada, Div.
acoustic treatment. While the office is occupied by a of Building Research, ~ ~N~~~ N ~ . ~ h563, 1971. ,
staff less concerned with privacy, it is probably best 2 ~N. Hamme and D. N . Huggins, "The Problem of .
to keep the masking sound off or at a very low level. Acoustical Specifications for Office Landscape Ceilings," J.
Otherwise the use of the system, even unannounced, AcOust. SOc. Am. 5 2 v 120
"'American National Standard Methods for the Calculation of
may lead to some user disatisfaction. Where a masking the Articulation Test,,, ANSI S3.5, 1969.
system is used to attain privacy it is best not to an- 45. D. ~ r i f f i t h ~ , "Rhyming Minimal Contrasts: A Simplified
nounce its presence. Little good will come of operating Diagnostic Articulation Test," J. Acoust. Soc. Am. 42, 236
it a t a levei greater than 4 8 d ~ ~ . - (1967).
A~~~~~~~~ ceiling can be used to improve a 5"~merican Monosyllabic Word Intelligibility," S3.2, 1960. Standard Method for Measurement of
relatively reflective ceiling but only when they are 6 ~ . Maekawa, "Noise Reductions by Screens," ~ p p l . ~ c o u s t .
mounted closely together. This is not an economical 1, 157 (1968).