Conjunctive input processing drives feature
selectivity in hippocampal CA1 neurons
The MIT Faculty has made this article openly available.
Please share
how this access benefits you. Your story matters.
Citation
Bittner, Katie C, Christine Grienberger, Sachin P Vaidya, Aaron D
Milstein, John J Macklin, Junghyup Suh, Susumu Tonegawa, and
Jeffrey C Magee. “Conjunctive Input Processing Drives Feature
Selectivity in Hippocampal CA1 Neurons.” Nature Neuroscience 18,
no. 8 (July 13, 2015): 1133–1142.
As Published
http://dx.doi.org/10.1038/nn.4062
Publisher
Nature Publishing Group
Version
Author's final manuscript
Citable link
http://hdl.handle.net/1721.1/109917
Terms of Use
Article is made available in accordance with the publisher's
policy and may be subject to US copyright law. Please refer to the
publisher's site for terms of use.
Conjunctive input processing drives feature selectivity in
hippocampal CA1 neurons
Katie C. Bittner1, Christine Grienberger1, Sachin P. Vaidya1, Aaron D. Milstein1, John J. Macklin1, Junghyup Suh2, Susumu Tonegawa2, and Jeffrey C. Magee1
1Howard Hughes Medical Institute, Janelia Research Campus, Ashburn, VA 20147, USA
2RIKEN-MIT Center for Neural Circuit Genetics at The Picower Institute for Learning and Memory and Howard Hughes Medical Institute at Massachusetts Institute of Technology, Cambridge, MA, 02139, USA
Abstract
Feature selective firing allows networks to produce representations of the external and internal environments. Despite its importance, the mechanisms generating neuronal feature selectivity are incompletely understood. In many cortical microcircuits the integration of two functionally distinct inputs occurs nonlinearly via generation of active dendritic signals that drive burst firing and robust plasticity. To examine the role of this processing in feature selectivity we recorded CA1 pyramidal neuron membrane potential and local field potential in mice running on a linear
treadmill. We found that dendritic plateau potentials are produced by an interaction between properly timed input from entorhinal cortex (EC3) and hippocampal CA3. These conjunctive signals positively modulate the firing of previously established place fields and rapidly induce novel place field formation to produce feature selectivity in CA1 that is a function of both EC3 and CA3 input. Such selectivity could allow mixed network level representations that support context-dependent spatial maps.
Introduction
The neuronal microcircuit is a fundamental processing unit of nervous systems and as such is intricately involved in producing the network computations that drive behavior. Many cortical microcircuits show a stereotyped organization that may allow them to implement a common set of core operations1. One such core operation is derived from the fact that most cortical microcircuits receive at least two functionally distinct afferent inputs from different brain areas1. In pyramidal neuron based microcircuits, these different inputs are spatially segregated with long-range inputs mainly innervating the most distal apical tuft dendrite
Users may view, print, copy, and download text and data-mine the content in such documents, for the purposes of academic research, subject always to the full Conditions of use:http://www.nature.com/authors/editorial_policies/license.html#terms
Correspondence to: Jeffrey C. Magee, Howard Hughes Medical Institute, Janelia Research Campus, 19700 Helix Dr, Ashburn, VA 20147, USA, ; Email: [email protected]
Author contributions
KCB and JCM designed experiments, KCB and CG performed in vivo recordings, SPV and AM performed in vitro recordings, JJM
HHMI A
uthor Man
uscr
ipt
HHMI A
uthor Man
uscr
ipt
HHMI A
uthor Man
uscr
ipt
regions and more local inputs usually forming synapses onto the proximal perisomatic dendrites2–5. The electrical isolation present within most pyramidal neurons determines that each functional class of inputs is initially processed in relative independence of the other6–9. However, active dendritic mechanisms, such as backpropagating action potentials (bAPs) and dendritic Ca2+ plateau potentials, allow the different afferent input streams to interact nonlinearly when they arrive with appropriate coincident timing6–13. Additionally, the initiation of dendritic plateau potentials is known to robustly induce rapid and long-lasting changes in synaptic strength and dendritic excitability10,14. This form of input interaction or integration could support a nonlinear combination of the input streams to produce neurons with a feature selectivity that is a function of both input paths6,9. Such a population will, in turn, generate mixed or multi-modal network representations with advantageous
computational properties15,16.
In the CA1 region of the hippocampus, long-range external information from EC3 arrives onto the most distal dendritic regions of principal neurons while more local internal information from hippocampal area CA3 arrives onto proximal perisomatic
dendrites2,3,17,18. In vitro studies have shown that these inputs can be integrated supra-linearly with the exact level of amplification being dependent upon the coincidence of the two input pathways. A voltage-gated Ca2+ channel and NMDA receptor dependent dendritic plateau potential generated in the distal apical dendritic regions mediates this nonlinear form of dendritic integration9–11. Recently, several in vivo studies have provided strong evidence that dendritic plateau potentials and the complex burst firing they produce are present during both anesthetized and awake conditions13,19–21. Such active dendritic processing could mediate a nonlinear interaction between EC3 and CA3 inputs that allows the CA1 circuit to associate contextual and spatial information, thus generating and maintaining context dependent spatial maps10,22–25.
Results
Intracellular characterization of place specific firing
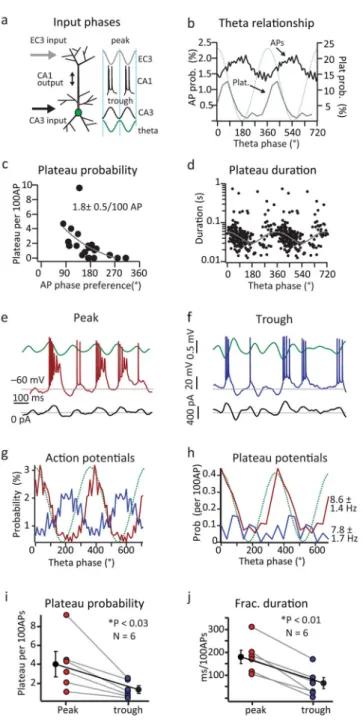
To investigate dendritic plateau potentials in awake behaving mice, we trained water-scheduled mice to run head-fixed on a linear track treadmill for a sucrose/water reward delivered each trial (lap) at the same location on a ~2 meter track (Fig 1a)26. Extracellular recordings under these conditions have demonstrated that CA1 pyramidal neurons fire at specific locations on the track and these place cells have similar properties to those recorded from freely moving animals26. We obtained simultaneous whole-cell intracellular and LFP extracellular recordings in area CA1 of dorsal hippocampus of navigating mice (Fig 1b). The activity profiles of recorded neurons generally fell into three categories; silent cells, non-place cells and non-place cells (Supplementary Fig 1; see methods for criteria). At this point we will restrict our analysis to place cells, which exhibited location specific AP firing at rates that were similar to those measured using extracellular methods (mean peak rate; 14.3±1.5 Hz, N=22 neurons from 21 mice; Fig 1 and Supplementary Fig 2)26. Consistent with previous intracellular recordings of place cells19–20, we observed a ramp-like depolarization in the subthreshold membrane potential (ramp) (mean ramp amplitude; 7.9±1.0 mV, N=22; Fig 1 and Supplementary Fig 2), an increase in the amplitude of intracellular theta
HHMI A
uthor Man
uscr
ipt
HHMI A
uthor Man
uscr
ipt
HHMI A
uthor Man
uscr
ipt
oscillation (thetain) (mean Δtheta; 2.8±0.26 mV, N=22; Fig 1 and Supplementary Fig 2) and
phase precession of both APs and thetain at the preferred firing location (Supplementary Fig
2). The entire population of place fields spanned the length of the belt (Fig 1d).
Detection and properties of dendritic plateau driven complex spiking/burst firing
We also observed bursts of APs that were driven by characteristic Vm depolarizations that are the signature of dendritic plateau potential initiation (Fig. 1e–g and Supplementary Fig 3)10,13,19,20. Plateau events were detected as a threshold crossing (−35 mV) of the smoothed intracellular voltage (Supplementary Fig 3). The threshold value was determined from dual dendritic and somatic in vitro voltage recordings with simultaneous calcium imaging (Supplementary Fig 3f–j). The average duration of plateau events in vivo, measured as the time spent above threshold, was 56 ± 4 ms and the amplitude of these events from baseline Vm was 41 ± 0.3 mV (Fig 1h, i, N=17 cells, 226 events) similar to that recorded in vitro (Supplementary Fig 3) and from anesthetized mice21. We also found that the probability of plateau initiation varied between laps and was positively correlated with ramp amplitude, Δtheta, and peak firing rate (Supplementary Fig 4). NMDAR blockade using intracellular MK801 reduced plateau probability and duration consistent with the pharmacology of plateau potentials recorded in vitro and in anesthetized mice (Supplementary Fig 5)10,11,21.
Spatio-temporal properties of plateaus
To examine the microcircuit mechanisms of plateau potential initiation we measured the extracellular theta phase preference of plateaus and APs in all place cells. In vitro studies predict that plateaus should be initiated when EC3 and CA3 input are coincidently active. Extracellular studies, however, have shown that EC3 and CA3 inputs tend to be active at different phases of theta with the phase preference of EC3 being near the peak of theta, while CA3 inputs are most active near the trough of extracellular theta27,28. Consistent with previous reports for CA1 cells, the phase preference of APs recorded here was near the trough of extracellular theta (173±16°; 12784 events; 21 neurons). The phase preference of plateaus, however, was more advanced than APs (56±7°; 223 events; 16 neurons; two-tailed unpaired t-test, p=1.8e−6; Fig 2b), making their phase preference more similar to that previously reported for EC3 input. Plateaus also displayed a significantly higher level of theta modulation (APs: 0.43±0.04; plateaus: 0.92±0.03; two-tailed unpaired t-test, p=4.9e−4). Interestingly, we observed a relationship between plateau probability and AP theta phase preference of individual neurons where plateau probability was higher in those cells showing the most advanced theta phase preference (Fig 2c). Plateau durations also had a phasic relationship with the LFP such that the duration of plateau events decreased as the theta phase of their initiation moved from the peak of extracellular theta to the trough, farther from the preferred phase of EC3 input (Fig 2d). Together these results are consistent with previous in vitro data showing that dendritic Ca2+ plateaus occur when CA3 input is appropriately timed to drive AP output and backpropagation to coincide with EC3 input.
Experimental manipulation of perisomatic Vm and AP firing phase
We further examined this temporal relationship by manipulating the phase of perisomatic Vm fluctuations and resultant CA1 firing thereby mimicking the impact of either advanced or delayed CA3 input. For this we used a closed loop experiment in which we online filtered
HHMI A
uthor Man
uscr
ipt
HHMI A
uthor Man
uscr
ipt
HHMI A
uthor Man
uscr
ipt
and variably delayed the extracellular LFP and then used the resulting waveform to drive current injection into the recorded cell (Fig 2 and Supplementary Fig 6). In the first condition we minimized the delay to produce advanced Vm fluctuations and spiking biased towards the peak of extracellular theta (APs peak near 45°; Fig 2e, g). In the second condition we increased the delay on the injected current to produce later phase Vm
fluctuations and the cells preferentially spiked near the trough of extracellular theta (~200°; ~95 ms delay; Fig 2f, g). Plateau probability and normalized duration were significantly higher when spiking was biased towards the peak of extracellular theta (prob. 4.1 ± 1.2 plateau/100AP; duration 183.2 ± 41 ms/100AP; N=6; Fig 2i, j) than when spiking was near the trough (prob. 1.3 ± 0.4 plateau/100AP; duration; 63.5 ± 33.5 ms/100AP; N=6; Fig 2i, j) even though the average firing rates were similar under the two conditions (peak: 8.6 ± 1.4 Hz; trough: 7.8 ± 1.7 Hz; N=6). The phase preference of plateaus under these conditions was similar to the control (Fig 2h). This manipulation provides further evidence that plateau potentials in CA1 pyramidal neurons are preferentially generated when CA3 input drives AP output to coarsely overlap with synaptic input from EC3.
Experimental reduction of EC3 input to CA1
To elucidate the role of the distal long-range input we recorded from mice expressing archaerhodopsin (Arch) in EC3 pyramidal cells (see methods and Fig 3a)17. We inhibited synaptic input from EC3 neurons by activating Arch in the axons and terminals of these cells using an optical fiber fitted inside the LFP electrode that was located in stratum radiatum near the recorded neuron (3–5s duration 594nm laser pulses, Supplementary Fig 7 and Supplementary Discussion). A similar manipulation reduced synaptically evoked EPSP area ~30% in hippocampal brain slices from these transgenic mice (Supplementary Fig 8). Activation of Arch impacted our measures of burst firing (Fig 3e, f) and significantly reduced plateau probability and normalized duration by ~50% (nolight vs light: prob. 3.8 ± 0.8 vs 1.7 ± 0.5 plateau/100AP; duration; 63.4 ± 6.8 vs 27.8 ± 6.0 ms/100AP; N=8 neurons; Fig 3c, d, g–i and Supplementary Fig 9). The ramp amplitude and peak firing rates were also slightly, but significantly, reduced by this modest decrease in EC3 input
(Supplementary Fig 9c–e) while running speed was comparable for laps with and without light stimuli (nolight: 29.6±1.6 cm/s; light: 28.5±1.3 cm/s; N=8). This manipulation of the distal synaptic input stream indicates that EC3 input has a critical role in generating plateau potentials in awake behaving mice.
The role of EC3 and CA3 pathways in the generation of plateau
We next examined the relative contribution of each individual pathway in plateau initiation by performing an in vitro experiment that allows independent pathway activation. Here we paired separate stimulation of either the EC3 or CA3 input pathways with long duration current injections (300–600 pA; 400 ms) into CA1 pyramidal soma. Pairing of current injection with EC input pathway stimulation increased the occurrence of dendritic plateau potentials, quantified as associated tuft Ca2+ signal area (600 pA alone, 50 ± 11 ΔF/F ms; +EC, 151 ± 16 ΔF/F ms; N=6 neurons; Fig 3l and n). This was not the case, however, when the same currents were injected together with similarly sized CA3 input pathway
stimulation. Instead Ca2+ plateau initiation was rare and not different than that observed for current injection alone (600 pA alone, 50 ± 11 ΔF/F ms; +CA3, 60 ± 10 ΔF/F ms; N=6; Fig
HHMI A
uthor Man
uscr
ipt
HHMI A
uthor Man
uscr
ipt
HHMI A
uthor Man
uscr
ipt
3m and n). This result highlights the special, perhaps necessary, role of the EC3 pathway in the production of plateau potentials in CA1 pyramidal neurons. For its part, CA3 input appears to provide apical dendritic depolarization and perhaps most importantly to produce AP output that backpropagates into the distant regions of the apical dendrite to interact with the EC3 input7–10.
Gain modulation of place-field firing by plateau initiation
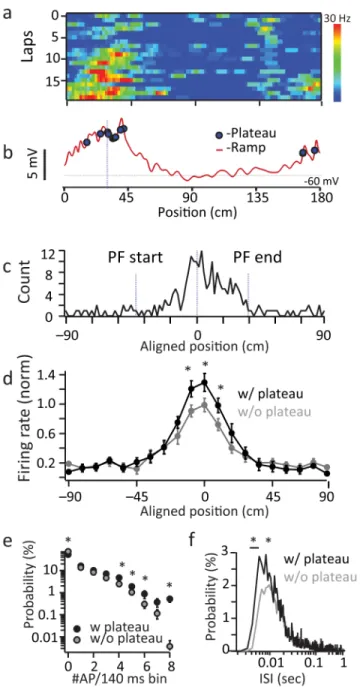
To determine the impact of these events on CA1 output we calculated plateau probability as a function of the animal’s location. We found that during place field traversals, plateau probability was highest within the field and peaked near the place field center, consistent with previous reports of intracellularly recorded complex spiking (bootstrapped permutation test; p=1e−4; Fig 4a–c)19. Importantly, plateau potentials positively modulated the frequency of infield AP firing (~30% increase in peak firing rate) in a manner consistent with an increase in firing rate gain and heavily increased the incidence of high frequency firing and short inter-spike interval (ISI) events (Fig 4d–g). These data indicate that the generation of plateau potentials elevates in-field AP firing frequency by promoting high frequency burst firing output from CA1 pyramidal neurons. In addition to this effect on firing rate, burst firing output should also be particularly effective at transmitting information to downstream regions due to the facilitating nature of CA1 pyramidal neuron synapses 29,30. Thus, one function of dendritic plateau potential initiation appears to be a somewhat unique gain modulation of place-field firing rate via the induction of high frequency bursts of AP output within the field.
Considering all of the above data, dendritic plateau potentials appear to operate as coincidence detectors that signal the presence of correlated or conjunctive EC3 and CA3 input by modulating the rate and mode of AP output in CA1 pyramidal neurons. Such a nonlinear input interaction would allow the association of internal and external features through a burst-firing related output modulation mechanism that could produce a mixed representation of space and context useful for encoding episodic memory15,16,22–25.
Spontaneous plateaus are associated with novel place field formation
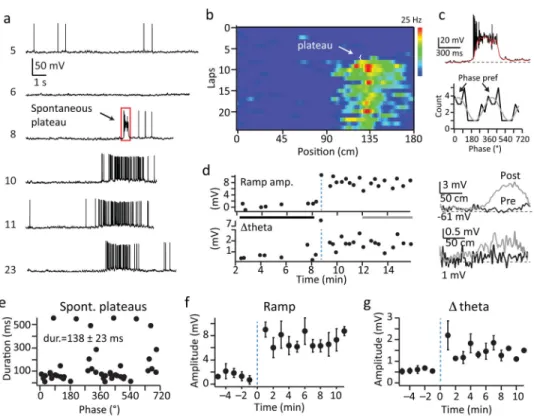
In addition to the above described ability of plateau potentials to produce a robust gain modulation of CA1 output, plateau were also observed to be associated with the rapid formation of novel place fields. We found that a subset of pyramidal neurons abruptly transitioned from either silent or non-place firing into position-specific firing at a particular time during the recording session (N=6 neurons, Fig 5 and Supplementary Fig 10). Inspection of the Vm traces during this transition revealed the presence of long duration plateau driven complex spiking that consisted of bursts of high frequency action potentials (APs) riding on top of large (~40 mV) and long lasting (138±23 ms, N=22 events) depolarizations in all neurons expressing novel place field formation (Fig 5a, c; and Supplementary Fig 10). Vm traces from laps following the dendritic plateau potential displayed a consistent location-specific increase in firing rate (mean peak firing rate = 12.7±2.2 Hz; N=6) that was driven by large amplitude, slow Vm depolarizations (ramp; pre=0.8±0.2 mV, post=6.9±1.0 mV; N=6; p=2.3e−9, paired two-tailed t-tests) and substantial intracellular Vm theta oscillations (Δtheta; pre=0.6±0.2, post=1.7±0.4 mV; N=6; p=1.6e−4,
HHMI A
uthor Man
uscr
ipt
HHMI A
uthor Man
uscr
ipt
HHMI A
uthor Man
uscr
ipt
paired two-tailed t-tests) at the location on the track where the plateau appeared for the remaining duration of the recordings (19.8±4.2 laps; 9.6±1.2 min; N=6) (Fig 5, and Supplementary 10). The above data suggest a role for dendritic plateau potentials in the rapid formation of new place fields in CA1 pyramidal neurons.
Induced plateau drive novel place field formation
To more directly test if plateau potentials are sufficient to induce place field formation we developed a closed-loop experiment to evoke plateau potentials at specific locations along the track. Although naturally occurring plateaus require coincident input from CA3 and EC3 we were able to induce plateau potential initiation through intracellular current injection (300 ms, ~600 pA, Fig 6) at the same location along the track for repeated laps (~5 laps, Fig 6 and Supplementary Fig 11). The induced plateau potentials had similar properties as naturally occurring plateaus (phase preference, 25°± 15°, N=102 events; phase modulation index, 0.83±0.04, N=102 events, duration, 56±10 ms, N=141 events). Such repeated plateau initiation was sufficient to induce spatially selective AP firing at the location of the current injection (mean peak firing rate: 15.4±2.1 Hz; N=14 neurons) in 93% of cells tested (14 of 15 neurons). This position-specific firing was driven by the rapid appearance of a large amplitude Vm depolarization (ramp; pre=0.8±0.2 mV, post 7.2±0.6 mV; N=14; p=2.5e−11, paired two-tailed t-tests, Fig 6d, e, g) and Vm theta oscillation (Δtheta; pre=0.6±0.2 mV, post=1.7±0.2 mV; N=14; p=7.4e−8, paired two-tailed t-tests; Fig 6d, e, h). The induced place fields were stable for the remaining duration of the recording (15.1±1.8 min; N=14) and for a large number of laps (39±7 laps; N=14). In most respects the induced place fields were similar to those of non-induced place cells, in that the mean peak firing rate, ramp amplitude, phase precession of APs, phase precession of intracellular theta and AP theta phase preference were not significantly different from standard place cells (Supplementary Fig 11d–f; two-tailed unpaired t-tests). However, Δtheta was slightly, but significantly, reduced in the induced place fields when compared to standard place cells (Supplementary Fig 11e; two-tailed unpaired t-test). Input resistance did not change following place field induction (pre; 69.5 ± 2.8 MΩ, post 73.1 ± 3.5 MΩ; N=14 neurons, p=0.48; paired two-tailed t-test; Supplementary Fig 12).
We also observed that the amplitude of the resulting position-specific increase in Vm ramp depolarization and firing rate did not vary as a function of position for induced plateau initiation (N=14; F=0.2425, ANOVA; Fig 6i). This indicates that there is no spatial bias to place field generation and that the only determinant was the position of repeated plateau potential initiation. These observations suggest that CA1 pyramidal neurons receive proportional levels of input from presynaptic cells that are tuned to all possible spatial locations and as a result are equally capable of expressing place-specific firing at any potential position.
High frequency single spiking is not effective
To determine whether the plateau potentials or the associated high frequency AP firing was the main driver of place field formation we next used a current injection waveform that generated a similar number of high frequency AP trains but that did not contain any plateau potentials (train of 30 at 100 Hz, ~1 nA, 2ms duration pulses). The trains of APs induced
HHMI A
uthor Man
uscr
ipt
HHMI A
uthor Man
uscr
ipt
HHMI A
uthor Man
uscr
ipt
only a small increase in the ramp amplitude (ramp; pre=1.1±0.3 mV, post=1.9±0.4 mV; N=6 neurons; p=0.007, paired two-tailed t-tests) that was both smaller than that induced by plateau initiation (p=4.7e−9; unpaired two-tailed t-test) and insufficient to produce a lasting increase in position-specific firing rate (0.8±0.1 Hz, N=6; Supplementary Fig 13). There was no significant effect on intracellular theta oscillations (Δtheta; pre=0.7±0.1 mV,
post=0.8±0.1 mV, N=6 neurons; p=0.41, paired two-tailed t-tests). These data indicate that dendritic plateau potentials, but not high frequency AP firing, are sufficient for rapid place field generation in CA1 pyramidal neurons during our behavioral task.
Plateau increase the amplitude of incoming input
We next sought to determine the mechanism of the plateau induced novel place field formation. Given the previously described ability of plateau potentials to induce synaptic plasticity10,14, a straightforward prediction is that synaptic potentiation at the position of the plateaus drives subsequent place specific firing. Alternatively, plateaus could produce an increase in the frequency of inputs present at a given position of the track. An analysis of Vm fluctuations can distinguish between these two possibilities, as Vm variance is a linear function of the frequency of inputs but increases as the square of EPSP amplitude
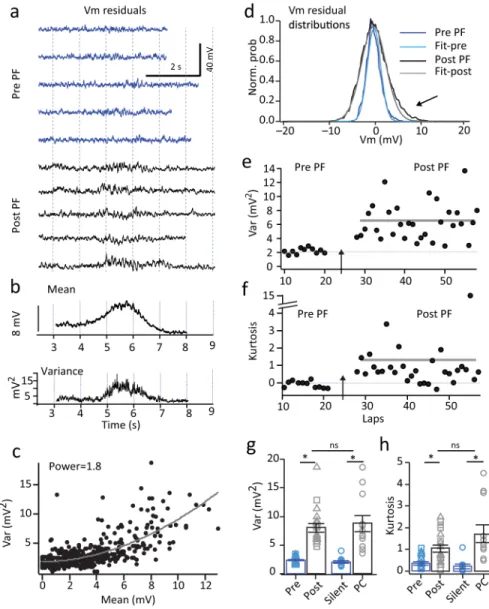
(Supplementary Fig 14)31,32. The analysis showed that both spontaneous and induced place field generation caused the variance of Vm fluctuations within the fields to increase nearly four-fold over laps without place field firing (pre= 2.4±0.1 mV2, post=8.0±0.8 mV2; N=19 neurons; p=8.5e−9, paired two-tailed t-tests; Fig 7) and variance was found to increase as approximately the square of the mean Vm (Var-mean plots were best fit by power function with mean power=1.7±0.2; N=19 neurons). Additionally, place field generation caused an increase in the higher order moments (particularly excess kurtosis) of the Vm distribution (pre= 0.36±0.08, post=1.0±0.2; N=19 neurons; p=3.2e−5, paired two-tailed t-tests; Fig. 7f, h). The observed large increase in Vm variance within the induced place fields and the supra-linear relationship to the mean Vm is consistent with a position specific increase in EPSP amplitude rather than an increase in the frequency of the synaptic inputs
(Supplementary Fig 14).
We next performed the Vm fluctuation analysis on the place cell and silent cell populations. This analysis showed that place cells had within field Vm variance that was approximately four-fold higher than that of silent cells (silent = 2.0 ±0.2 mV2, n=10; PC=8.8±1.4 mV2, n=12; p=4.8e−7, unpaired two-tailed t-tests; Fig 7g) and was not different than that found in neurons with induced place fields (unpaired two-tailed t-test; p=0.42; Fig 7g). The degree of nonlinearity in the relationship between Vm variance and mean was also not different from that of induced place fields (power=1.6±0.2; N=15 neurons; unpaired two-tailed t-test; p=0.30). Together these analyses support the idea that an elevation in position specific synaptic weight is an important mechanism underlying place field firing in hippocampal CA1 pyramidal neurons.
Impact on sharp wave/ripple related activity
Finally, we observed that the induction of novel place fields by plateau potential initiation during active running was associated with an alteration in the activity of neurons during subsequent sharp-wave ripple (SPW/R) network states that occurred within non-exploratory
HHMI A
uthor Man
uscr
ipt
HHMI A
uthor Man
uscr
ipt
HHMI A
uthor Man
uscr
ipt
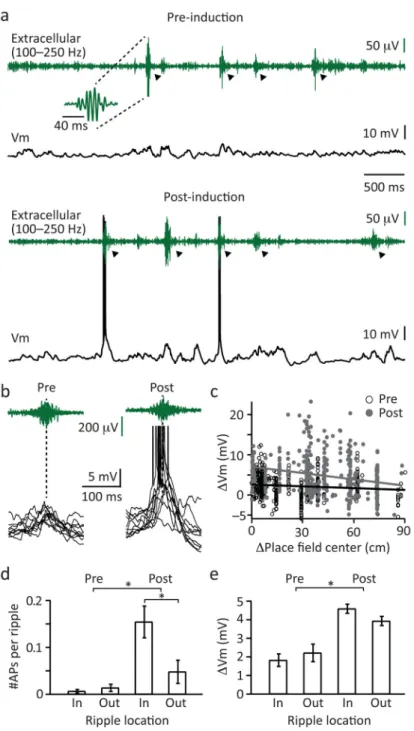
periods. When rodents stop actively exploring an environment the hippocampus transiently enters a distinct network state that is characterized by short duration (<100 ms), high frequency (~200 Hz) oscillations in the extracellular field potential (Figure 8) 33,34. We observed that the level of intracellular Vm depolarization produced during ripple activity is significantly enhanced following the induction of place fields during active exploration (pre: 2.0±0.3 mV; post: 4.3±0.2 mV; N=16; Fig 8c). Furthermore, this enhanced level of Vm depolarization also increased the number of APs produced during ripple activity (pre: 0.01±0.004 AP; post: 0.10±0.025 mV; N=16; Fig 8d). The effect, particularly on AP firing, was most pronounced when ripples occurred at positions on the track that were near the location of the induced place field (post in: 0.154±0.034 AP; post out: 0.047±0.026 AP; N=16; Fig 8d). These data indicate that a common mechanism, plateau potential mediated plasticity, underlies neuronal feature selectivity during both distinct hippocampal network states (theta versus SPW/R states), further strengthening the concept that the neuronal activity associated with ripples is a reactivation of the activity that occurred during active exploration.
Discussion
In summary, we have shown that dendritic plateau potentials enhance place field firing rates and the incidence of complex spike burst firing in CA1 pyramidal neurons. The timing of plateau potential initiation coincides with EC3 input to CA1 cells and plateau probability is increased when perisomatic Vm is manipulated to drive CA1 spiking near the theta phase preference of EC3 input. Furthermore, optogenetic inhibition of EC3 input in the behaving animal as well as independent pathway activation in the slice suggest a unique role for EC3 input in the generation of dendritic plateau potentials. These data are consistent with previous in vitro studies that have shown dendritic plateau potentials produce a nonlinear integration of CA3 and EC3 input streams, the size of which is related to the degree of correlation.
In addition the data show that dendritic plateau potentials are sufficient to induce place field formation in CA1 pyramidal cells and that the underlying mechanism is likely to be a strengthening of synaptic inputs active around the time of plateau generation. The ability of plateaus to induce fields at any position along the track indicates that a given CA1 pyramidal cell receives input tuned to all spatial locations and is therefore equally able to express location-specific firing at any position. We did not find any evidence of a position specific bias in the number or frequency of inputs suggesting that CA1 cells receive an
approximately proportional amount of inputs for all regions of the linear track and that the generation of a long-duration plateau potential chooses the particular feature for which the neuron will be selective (Supplementary Fig 15). The plateau potential driven increase in synaptic input also appears to result in an enhanced reactivation during SPW/R activity, implicating a common mechanism for position specific firing during both active exploration and non-exploratory network states. Furthermore, since CA3 is considered to be the source of SPW/R activity35,36 the plasticity evoked by dendritic plateaus should involve CA3 inputs to CA1 pyramidal neurons.
HHMI A
uthor Man
uscr
ipt
HHMI A
uthor Man
uscr
ipt
HHMI A
uthor Man
uscr
ipt
The two mechanisms currently thought to be involved in the formation of place fields in hippocampal neurons are a linear combination of different periodic grid cell inputs37,38 and various Hebbian-type synaptic plasticity mechanisms39,41. The data presented here indicate that input potentiating plasticity mechanisms rather than location dependent increases in input numbers are the most prominent determinant of position selective firing in CA1 place cells. However, there remains the possibility that variations in EC3 input, mediated by overlapping grid-cell input, may regulate the probability of plateau potential initiation in a position-dependent manner. This could potentially connect the two mechanisms. The observation that dendritic plateau potentials were much more effective than high frequency APs at rapidly producing long-lasting place specific input potentiation has implications for the rules governing place field formation in CA1 pyramidal neurons. Since plateau potentials are induced by the conjunction of two input pathways (EC3 and CA3) it follows that CA1 neurons may use somewhat nonstandard associative learning rules42,43 to form place fields with properties that are a function of both CA3 and EC3 input. Additional experiments are needed to determine the exact synaptic mechanisms and induction rules involved in the generation of CA1 place fields.
Interestingly the spontaneous plateaus that were found to induce place fields were
approximately three fold longer than those plateaus produced within existing place fields or those induced by current injections. This suggests that there may be some special condition associated with their initiation. Such a condition could be subcortical input driving both the dendritic dis-inhibition and neuromodulation that are likely required for such long duration events. Future experiments manipulating these elements should reveal the detailed circuit mechanisms involved in spontaneous plateau generation. In the end the plasticity produced by plateau potentials is capable of generating a place field within a single trial and such rapid field induction is a known property of CA1 pyramidal neuron activity during exploration44–46. While it is not entirely clear how long novel place fields will persist, the continued generation of plateau potentials within the new field could enhance their stability and this could be another important function for plateau generation within place fields. Although we have above mainly focused on the role of excitatory input in dendritic plateau potential generation, inhibitory inputs are also likely to play an important part in regulating these signals26,47–49. In particular, dendritically targeting interneurons that display a late theta phase firing preference are well suited to control the initiation and duration of dendritic plateau potentials. Along these lines, Oriens Lacunosum-Moleculare (OLM) interneurons are known to reduce complex spike probability and duration as well as influence spatial learning26,49 underscoring the role that inhibitory elements play in this microcircuit operation.
This and other studies present evidence that active dendritic integration in pyramidal neuron based cortical microcircuits supports a fundamental operation, the nonlinear interaction of long-range and local inputs that leads to firing rate modulation and neuronal
plasticity6–11,15,16,50. Indeed, evidence of a similar nonlinear modulation of tuned responses by active dendritic processing has been reported in layer 5 pyramidal neurons of the barrel cortex of behaving mice6,7, and a comparable form of dendritic plateau driven plasticity has been observed in neocortical neurons both in vitro and in anesthetized mice14,50. Additional
HHMI A
uthor Man
uscr
ipt
HHMI A
uthor Man
uscr
ipt
HHMI A
uthor Man
uscr
ipt
experiments are needed to fully explore the roles of various cortical microcircuit elements in what appears to be a candidate general microcircuit operation or low-level computation.
Methods
All experiments were performed according to methods approved by the Janelia Farm Institutional Animal Care and Use committee (Protocol 12–84).
Surgery and training schedule
Custom made titanium head plates with an opening over the right hippocampus were affixed to the skulls of 5–6 week old mice using Loctite brand super glue and dental acrylic while under either isofluorane or ketamine/xylazine anesthesia. The skull underneath the head implant opening was covered with super glue and future locations for the craniotomies for the whole cell and field recordings were marked using stereotactic coordinates (2.0 caudal, 1.7 lateral for whole cell and 3.6–3.7 caudal, 1.7 lateral for field). After 5–7 days of recovery from surgery animals running wheels were added to the animals cages and animals were placed on a water schedule protocol receiving 1.5 ml/day. After 5–7 days of water
scheduling, animals were placed on the head fixation apparatus on either a training rig or the experimental rig for 20–40 minute sessions/day for 5–14 days. Mice were trained to run for a 10% sucrose/water reward delivered once for every rotation of the belt (approximately 2m) at the same location through a licking port. Mice were supplemented with additional water after training sessions to ensure they received 1.5ml/day. Mice were used for recording after the number of trials (laps) completed per day was similar for 2–3 days. Animals that started training on the training rig were trained for at least 2 sessions on the experimental rig. The belt the animal used for training was the same belt used during the experimental session. The day prior to recording animals were anesthetized using either isofluorane or ketamine/ xylaxine and two small (approximately 0.5mm in diameter) craniotomies, one for the patch electrode and one for the field electrode, were drilled at previously marked locations. The dura was left intact and craniotomies were covered with silicone elastomer (Kwik-cast, World Precision Instruments).
Behavioral set up and control
The linear track treadmill contains a belt made from velvet fabric (McMaster Carr) coated with visual and tactile cues as previously described26. There were three types of cues covering the length of the belt, glue spines, Velcro tabs, and white spots. The belt is self-propelled and the mouse experiences all three sets of local cues per rotation of the belt. The sucrose/water reward was delivered through a custom fabricated lickport controlled by a solenoid valve (Parker) between the glue spines and Velcro. Licks were detected as a beam break using a thru beam optical sensor (Panasonic). Photoelectric sensors were positioned at 3 locations on the belt between each cue type and used to determine the relative location of the animal along the belt and trigger the reward delivery, laser shutter, and spatial current injections. The animal’s speed was measured using a rotary encoder attached to one of the wheel axles. The valve, sensors, and encoder were controlled with a custom built
microprocessor (Arduino) behavioral box interfaced with a Matlab gui. A separate
HHMI A
uthor Man
uscr
ipt
HHMI A
uthor Man
uscr
ipt
HHMI A
uthor Man
uscr
ipt
microprocessor (Arduino) interfaced with a Matlab gui was used to control the laser shutter and spatial current injections based on the animals relative position on the belt.
In vivo electrophysiology
For each animal prior to whole cell patching, the depth of the pyramidal cell layer was detected using an extracellular recording. Extracellular electrodes were glass patch electrodes broken so that the resistance when filled with 0.9% NaCl was 1.5–3 MΩ. The extracellular electrode used to determine the pyramidal cell depth for whole cell recording was mounted vertically on a micromanipulator (Luigs and Neumann). The extracellular signal was monitored using an audio amplifier (Grass Technologies) and the electrode was advanced thorough the cortex and the pyramidal cell layer was identified when theta
modulated spikes were prevalent and the amplitude of ripples increased typically 1.1–1.3mm below the surface of the brain. The extracellular electrode to be used for LFP recordings during whole cell patching was mounted to a second micromanipulator (Narishige) on a 40– 45° angle relative to Bregma, unless otherwise indicated, and advanced through the more caudal craniotomy. For most experiments this extracellular electrode was advanced until detection of the pyramidal cell layer but not through. For EC3 inactivation experiments the fiber containing electrode was advanced approximately 200–300 μm beyond the pyramidal cell layer in order to position the light near EC3 axons. To correct for any location
differences in theta phase between the LFP electrode location and the location of whole cell patch recordings, we recorded the two LFP signals simultaneously. Long taper whole cell patch electrodes (7–12 MΩ) were filled with (in mM) 134 K-Gluconate, 6 KCl, 10 HEPES, 4 NaCl, 0.3 MgGTP, 4 MgATP, and 14 Tris-phosphocreatine. Whole cell patch electrodes were advanced through the cortex with 6–8 psi of pressure to prevent the electrode tip from clogging. Upon entry into the hippocampus (approximately 100–200 μm from depth measured using extracellular electrode), the pressure was reduced to 0.3–0.4 psi. Cells were identified by reproducible increases in electrode resistance. All recordings were made in current clamp using a Dagan BVC-700A amplifier and digitized at 20 kHz using an Instrutech ITC-18 with HEKA patch-master acquisition software. For the experiments in Figure 2, the LFP was filtered using a single pole high-pass filter with 1Hz cut-off frequency followed by a second order Butterworth low-pass filter with a 12Hz cut off, delayed, and amplified using a custom built FPGA device controlled by a Matlab gui. The filtering procedure produced an ~25 ms lag in the peak of the filtered response compared with the unfiltered LFP. During whole cell recording, the amount of amplification was adjusted until the current injection was sufficient to elicit spiking in either of the two delay conditions. To bias spiking towards the peak of extracellular theta the filtered LFP was used with either 0 or 10 ms additional delay over that introduced by the instrument (25–35 ms total delay). To produce spiking on the trough of extracellular theta the LFP was filtered and inverted prior to injection (producing the equivalence of a ~95 ms total delay). The exact timing of the current injection relative to the LFP was subject to any theta phase offsets between the local LFP and that at the recording location. All data were grouped based on the actual timing of the spiking relative to the LFP phase as measured during data analysis.
HHMI A
uthor Man
uscr
ipt
HHMI A
uthor Man
uscr
ipt
HHMI A
uthor Man
uscr
ipt
Optical fiber containing LFP electrode preparation
To prepare an optical fiber containing electrode, 9-um core fiber (1550 BHP, Thorlabs) with one end connectorized, was loaded through the perfusion port of an electrode holder, stripped, cleaved, and etched in hydrofluoric acid in two steps: 5 mm of fiber etched to 30 um diameter, then the last 1mm of fiber etched to 8–10 μm. The etched fiber was loaded into a quartz (1.0/0.7 mm or 1.2/0.9 mm OD/ID, Sutter Instruments) electrode with a tip size of 12–20 μm. The fiber positioning inside the pipette was adjusted until the fiber tip was recessed 100–500 μm from the pipette tip. These optical fiber containing electrodes (LFP/ fiber) were filled with saline the day of the experiment and used on subsequent days until the power out of the device dropped by more than 50% or the electrical resistance increased by 2-fold. For laser light delivery, the output of a 594 nm laser (Mambo, Cobolt) was fiber-coupled into a single-mode fiber patch cable using a 3.3 mm focal length aspheric lens and the fiber mounted on a fiber-launch translation stage (MBT616D, Thorlabs) with associated hardware for FC/APC connectors. APC angled connectors were necessary to prevent back reflections into the laser head. The coupling fiber was connected to the LFP/fiber electrode using a FC/APC-FC/APC coupler. Optical throughput of a freshly prepared LFP/fiber electrode was 60–70%, and laser power out of the LFP/fiber electrode between 7–12 mW for silencing experiments.
Photodetector for in vivo intensity measurements
To determine the light intensity profile for LFP/fiber electrodes we constructed a photodetector device that could measure local light intensities in vivo. To construct the photodetector a plug of 645 nm emitting quantum dots (QPP-645, Ocean Nanotech) was imbedded in epoxy at the tip of a pipette. This photodetector pipette also contained a 200 um core, 0.22 NA fiber, etched at one end to 40 um diameter, and fully inserted and glued into the photodetector pipette, in order to collect quantum dot fluorescence excited by laser light (Supplementary Fig. 7a). This fiber was connected to a bandpass filter (641/75, Semrock) and fluorescence was measured using a fiber-coupled spectrometer (QE65000, Ocean Optics). For the in vivo work, the photodetector was mounted onto the same manipulator used for patch experiments and inserted in a behaving animal at the same location as a patch electrode, to record the light intensity as a function of depth from the cortical surface. The laser light intensity was also measured at several distances from the LFP/fiber electrode tip, in order to generate an in vivo laser intensity heat map (Supplementary Fig. 7b). The photodetector was calibrated in saline using a 200 μm core fiber coupled to a 561nm laser as a light source of spatially defined light intensity using the same geometry as that used in vivo.
EC3 inactivation
To inactivate EC3 inputs, we crossed EC3 expressing Cre mice (pOxr1-cre)17 with mice expressing LSL-Arch-GFP-WPRE (Ai35D, Allen Brain Institute) or Rosa-CAG-LSL-ArchT-EGFP-WPRE-bGHpA (Ai40D, Allen Brain Institute) to express Arch or ArchT selectively in EC3 neurons. There were no detectible differences in data from Arch or ArchT expressing mice so data were combined from these two mouse lines. Arch expressed in EC3 axons and terminals was activated using light delivered through an optical fiber containing
HHMI A
uthor Man
uscr
ipt
HHMI A
uthor Man
uscr
ipt
HHMI A
uthor Man
uscr
ipt
LFP electrode (see above). The electrode was mounted at an approximately 50° angle relative to Bregma and after detection of the pyramidal cell layer was advanced an additional ~300μm into stratum radiatum. EC3 was inhibited by activating Arch with 3–5s long 594 laser pulses within the putative place field during running typically every other trial (Fig 3b). Laser powers were 7–12 mW measured in air at the tip of the LFP/fiber electrode before an experiment. Light intensity at the location of EC3 axon terminals is estimated to be 14–36 mW/mm2, based on in vivo measurements of light intensity using the photodetector (above and Extended Data Fig 5).
In vitro electrophysiology (Fig 3 and Supplementary Fig 3)
400 μm transverse hippocampal slices were cut from 8–10 week old male C57/Bl6 mice using Leica Vibratome VT1200S after perfusing an isoflurane-anesthetized animal with ice-cold solution containing in mM: 210 Sucrose, 25 NaHCO3, 2.5 KCl, 1.25 NaH2PO4, 0.75
CaCl2, 7 MgCl2, 7 Glucose. Slices were incubated for 30 mins at 35°C in, and then recorded
from at 35°C, in a solution containing: 125 NaCl, 25 NaHC03, 3 KCl, 1.25 NaH2PO4, 1
MgCl2, 1.3 CaCl2, and 25 dextrose. All solutions contained fresh Na pyruvate (3 mM) and
ascorbic acid (1 mM), and were bubbled with 95% O2 and 5% CO2. Cells were visualized
using an Olympus BX-61 microscope using a water-immersion lens (60X, 0.9 NA, Olympus, Melville, NY). Whole cell current clamp recordings were performed using a Dagan BVC-700 (Minneapolis, MN) in active “bridge” mode and analougue-filtered at 10 kHz before being digitized at 50kHz using Prairie View acquisition software (Bruker Technologies, Middleton, WI). The pipette solution was the same as described for the in vivo electrophysiology but also included 100μM OGB-6f and 50 μM Alexa 594 (Invitrogen). Dual recordings were performed by first filling the soma and then target-patching the dendrite using a galvanometer-based two-photon laser scanning system (Ultima; Bruker Technologies, Middleton, WI; using Chameleon Ultra II; Coherent, Auburn, CA). Line-scans for Ca2+ imaging were performed with excitation at 920 nm using a frequency of 150 Hz. Ca2+ imaging was performed in the distal apical dendritic regions because this is known to be the site of dendritic plateau potential initiation in pyramidal neurons6–11. Trains of EPSPs were elicited by electrically stimulating axons in the Str. radiatum or Str. lacunosum moleculare using a platinum-iridium alloy bipolar micro-electrodes (MicroProbes,
Gaithersburg, MD) placed ~100–150 μm away from the recording site.
In vitro electrophysiology (EC3 inactivation, Supplementary Fig 8)
Longitudinal slices through area CA1 of the dorsal hippocampus (400μm) were prepared using standard procedures from 5–11 week old EC3 cre x Ai35 or Ai40D male or female mice. Slices were prepared as above with the following changes to recording solutions: cutting solution contained 197.2 sucrose, 28 NaHC03, 2.5 KCl, 1.25 NaH2PO4, 7 MgCl2, 1
CaCl2, and 7 dextrose, incubation solution contained 65.73 sucrose, 79.33 NaCl, 26
NaHC03, 2.83 KCl, 1.25 NaH2PO4, 3 MgCl2, 1.2 CaCl2, and 19 dextrose, and recording
solution contained 119 NaCl, 25 NaHC03, 3 KCl, 1.25 NaH2PO4, 1 MgCl2, 1.3 CaCl2, and
25 dextrose with 2 μm SR 95531 hydrobromide (gabazine) and 50 nm CGP 55845. Trains of EPSPs were elicited by electrically stimulating PP axons using a platinum-iridium alloy microelectrode (MicroProbes, Gaithersburg, MD) placed ~700–850 μm away from the recording site. Theta burst stimuli consisted of 5 pulses at 100 Hz delivered 5 times with an
HHMI A
uthor Man
uscr
ipt
HHMI A
uthor Man
uscr
ipt
HHMI A
uthor Man
uscr
ipt
inter-burst interval of 150 ms. Stimulus intensity was set such that the peak amplitude of the response to a burst recorded at the distal dendritic trunk was ~5–10 mV. For whole-field Arch activation in slices, broad spectrum light from an X-Cite lamp (Lumen Dynamics, Ontario, Canada) was passed through a 55nm wide bandpass excitation filter centered at 590nm and delivered through a 20X objective (Carl Zeiss, Germany), resulting in light intensities at the sample of ~30–60 mW/mm2.
Data analysis
The firing fields of single neurons were determined by first dividing the length of the belt into 100 bins. For each bin, the number of APs discharged in the bin was divided by the time the animal spent in the bin in order to generate a vector of firing rates. The firing rate vector was smoothed by a running average (boxcar) of 5 bins. Periods when the mouse ran slower than 5 cm/s were removed from analysis. Neurons were considered place cells if the firing rates of a series of the adjacent bins was 0.2 of the peak for at least 20 cm (10 bins) and had a mean in-field firing rate more than 3 times larger than the mean out-of-field firing rate. To produce mean place field firing frequency plots for the population of place cells (Fig 1d) the peak of the spatial firing rate distribution of each cell was centered at 100 cm (peak determined from smoothed (5 pixel Gaussian kernel) firing rate distribution). The aligned spatial firing rate distributions were normalized by dividing by the peak firing rate of each neuron and then this population was averaged to produce a single distribution. This mean normalized distribution was then binned (10 cm). Only neurons with a plateau probability >1/100 APs were used in this analysis as well as the ISI distributions shown in Figure 4c (N=8).
To quantify the average baseline Vm, APs were removed by deleting all points 0.26 ms before and 3.4 ms after a threshold value (dVm/dt = 50 V/s) and baseline Vm was defined as the peak of Vm histograms (Vm mode) from the resulting traces using a bin size of 0.2 mV. All traces were corrected for baseline drift on a lap-by-lap basis by determining the average deviation of the most hyperpolarized 5% of measured AP voltage thresholds from an expected value of −50 mV. To determine the properties of plateau potentials underlying complex spiking we used a signal detection protocol that began by smoothing the above trace with a running average (401 point, ~20 ms) boxcar procedure following linear interpolation of the deleted AP points. Events were detected from this trace by threshold crossing (−35 mV). This value was determined as a conservative estimate of where Vm distributions deviate from normal (Gaussian)(Supplementary Fig. 3). A second threshold level was evaluated (−30 mV) and other than decreasing the total number of events detected by 12% no quantitative differences were observed in any parameters. For the in vitro dual recordings, a burst of APs was classified as a plateau potential if the dendritic membrane potential corresponding to a somatic AP failed to re-polarize below −30 mV. Plateau amplitude was calculated as the difference of event peak and the baseline Vm and plateau duration was the time between the positive going and negative going threshold crossings. Plateau probability was determined by dividing the total number of plateau events by the total number of APs per cell. To analyze ramps of depolarization we low-pass filtered (<3 Hz) the raw AP-deleted traces using an FIR filter with a 200 ms Hamming window. Ramp
HHMI A
uthor Man
uscr
ipt
HHMI A
uthor Man
uscr
ipt
HHMI A
uthor Man
uscr
ipt
amplitude was quantified as the difference between peak (10 cm average around most depolarized value) and the baseline (10 cm average around most hyperpolarized value). To analyze subthreshold Vm theta oscillations we band-pass filtered (4–11 Hz) the raw AP-deleted traces using an FIR filter with a 200 ms Hamming window and the amplitude vector was derived using the Hilbert transform. The change in theta envelope (Δtheta) was
calculated in the same manner as the ramp amplitude.
The theta phase of APs and thetain were determined by first band-pass filtering the
extracellular LFP in the theta range (4 to 11 Hz) and then a vector of instantaneous phase was derived using the Hilbert transform. The theta phase of each AP threshold crossing and thetain peak depolarization was found by interpolating from the vector of instantaneous
phase. Theta phase histograms of AP and plateaus were produced by dividing the theta cycle into 36 or 10 equal phase bins, respectively. The phase histogram of the APs and plateau events were computed for each individual neuron. Each AP phase histogram was fit by a sine function and the phase preference and modulation index were determined from the peak and modulation depth (peak-trough/peak) determined from this fit. These same values were determined for the plateau from smoothed plateau phase histograms (3 bin Gaussian window). For the population averages in Figure 2c, histograms of each neuron were first normalized by dividing by the total number of events found in each neuron. To determine if there were any offsets in the phase of the recorded theta oscillation, in all recordings a reference LFP recording was performed at the site of the whole-cell recording simultaneous with the standard LFP recording and the theta phase peaks of the two simultaneously recorded LFP signals were compared. Most phase peak differences were less than 10° and no corrections were performed. However, differences between 10° and 40° were found in five neurons and these differences were corrected for during analysis.
For the determination of phase precession of APs and thetain the phase values of these events
were binned into 10 cm spatial bins for each individual neuron. For the population, the average phase of the first 10 cm of the place field (start location is the proximal position where rate is 20% peak firing) was compared with the average phase of the last 10cm of the place field (end location is distal position with 20% peak firing).
The impact of EC3 inhibition on plateau properties was characterized in place cells (N=8) where EC3 was inhibited by activating Arch within the place field on alternating laps (Fig 3b). Average event probability (per 100 AP), duration and total duration (probability multiplied by duration) were determined for periods of running during the when the laser shutter was opened (light) and these events were compared to those detected at the same spatial location on the belt (average position of the light periods) for control laps (nonlight). The level of place field induction was quantified as the difference in the mean Vm ramp of all laps before plateau or AP initiation versus the mean Vm ramp of all laps recorded between ten and fifteen minutes post induction (or the final five minutes for shorter recordings). The Vm ramp for each lap was calculated as above. For the plots in figure 5F&G the data are mean±sem with the number of neurons in each point being
3,4,5,6,6,6,5,4,6,6,5,5,5,3,3,3. For the plots in figure 6g&h the data are mean±sem with the number of neurons in each point for the plateau induction protocol being
HHMI A
uthor Man
uscr
ipt
HHMI A
uthor Man
uscr
ipt
HHMI A
uthor Man
uscr
ipt
8,9,14,14,14,14,14,14,13,14,11,12,11,9,9,9,10,10,10,10 and 3,4,6,6,6,6,6,5,6,6,6,4,5,4,5,4,4,4,3,2 for the AP induction protocol.
A non-stationary fluctuation analysis (NSFA) was performed on Vm by first aligning each trace to the center of the place field (peak of Vm ramp) and then generating a mean trace from the aligned traces for each condition (pre vs post). The location of the average place field center was used for the condition where no place field firing was evident (pre-). No aligning was performed on silent cells. Next APs were subtracted as above and the intracellular theta oscillation subtracted from each wave using the bandpass filtered trace generated as above. The mean trace (Fig 7b) was then subtracted from each lap to produce a residual trace for each lap (Fig 7a). The trial-by-trial variance was calculated from a two second region centered on the peak of the place field of each lap and high-order moments calculated from the entire trace (Fig 7e, f). A mean variance trace was also calculated using the Vm residual for each lap (Fig 7b). To produce variance-mean plots the variance and mean were calculated (in 500 ms bins) for each lap and then combined into a single plot that was fit by the power function; y=mpx+b. In this case the variance was calculated from residual traces produced by subtracting the low pass filtered Vm (ramp Vm) from the Vm trace for each lap.
A simple simulation of random input integration was run to demonstrate the impact of changes in input unit frequency versus input unit amplitude. 300 Poisson-like interval input trains (150 excitatory and 150 inhibitory) were generated using the following function: nx+1=nx−log(U/λ), where nx+1 is the next interval, nx is the current interval, U is a random
number and λ is the rate. All intervals <4 ms were excluded to mimic AP refractory period. For standard conditions λ was set to produce approximately 20 Hz input rate per train (for simulation shown in Supplementary Fig 14; mean interval =48 ms, distribution decayed exponentially with τ=42 ms). Excitatory and inhibitory units were produced by convolving a “synaptic current” of the form f(t)=a(1−exp(−t/τr))5exp(−t/τd) where a is a constant and τr =
0.04 ms and τd = 0.8 ms with a “membrane filter” that was an exponential function with
τm=6.7 ms. Excitatory amplitudes were pulled from a Gaussian distribution with a mean
amplitude of 0.2 mV for control conditions while inhibitory units had an mean average of −0.2 mV. This produced inputs approximating unitary EPSP inputs recorded in CA1 neurons. A forcing function (green trace in Supplementary Fig 14a) was used to scale either amplitude or λ of only the excitatory trains. Input trains were summed for 20 simulated trials and a NSFA was performed as above. The equations governing this process are shown in Supplementary Fig 14 and they clearly indicate how variance is more sensitive (by the square) to changes in amplitude than rate. Overall the simulation shows that for conditions where inhibitory input rate does not increase significantly (i.e. 4X; Supplementary Fig 14g) it is impossible to achieve the levels of Vm variance (elevations of ~4X) observed in experimentally recorded place fields (with ~10 mV ramp) for this simple type of input integration model. Furthermore, even when extreme rate changes are used (6x excitation increase paired with 4x inhibition increase) the relationship between Vm variance and mean was approximately linear (Supplementary 14g). On the other hand, the relationship between Vm variance and mean was found to be greater than linear (power=1.7) when the forcing function was applied to unit amplitude (Supplementary Fig 14f).
HHMI A
uthor Man
uscr
ipt
HHMI A
uthor Man
uscr
ipt
HHMI A
uthor Man
uscr
ipt
Ripples were detected using the following algorithm. (1) LFP recordings from periods during which the animal did not run were concatenated and subsequently band pass filtered between 100 and 250 Hz using an FIR filter. (2) The envelope of the filtered signal was calculated using the Hilbert Transformation and ripples were subsequently detected as signals increasing above 7x standard deviation (SD) above baseline. (3) The onset and the end of the ripple were marked as the time points at which the envelope decreased below 3x SD of the baseline period; the time of the ripple peak was determined by peak detection between ripple onset and end. (4) The successful identification of the ripples and their features (peak, onset and end) was confirmed through visual inspection of the filtered signals along with the raw LFP signal. Vm periods during ripples were subsequently further
analyzed. The number of APs during a ripple was determined by the number of threshold crossings in the corresponding dVm/dt trace (threshold=50 V/s). Smoothed Vm traces (as above) were used to analyze ripple-associated subthreshold Vm. ΔVm was calculated as the difference between the mean Vm values centered ±10 ms around the ripple peak and the baseline Vm. For each lap, the baseline Vm value was determined by the peak of the Vm histogram (see above).
For the analysis in Figure 8 (N=16 neurons), the neuron’s place field was determined using the subthreshold slow Vm depolarization (or ramp), which is a typical intracellular feature of place fields20. To quantify the ramp the linear track was divided into 100 spatial bins (each 1.9 cm wide) and an average Vm value was calculated for each bin using the previously generated AP-deleted Vm trace. After calculating the mean ramp depolarization across all laps the place field was defined as locations on the linear track where the average of the subthreshold ramp continuously exceeded a baseline period (determined by visual
inspection) of about 10 neighboring bins (>19 cm) for at least 5 adjacent bins (= 9 cm). The remainder of the linear track was considered as outside the place field. These place fields covered on average 74 ± 2% (mean ± SEM) of the linear track. Ripple location was calculated relative to the mid-point between place field start and end (= place field center). Locations before and after the place field center were pooled together.
Statistical methods
No statistical methods were used to predetermine sample sizes, but our sample sizes are similar to or larger than those reported in previous publications19–21. Where appropriate, data were analyzed using two-tailed paired or unpaired t-tests. Plateau duration, amplitude and probability are shown in text to be normally distributed. We assumed the same for ramp and thetain amplitudes. If normality was uncertain we used non-parametric test as stated in
the main text or figure legends. All manipulations were done within single neurons with manipulations interleaved trial-by-trial (light vs nolight) or in blocks of 5 trials (current injections). Data were analyzed automatically without consideration of trial condition. To determine whether plateau counts displayed location dependence (Fig 4c), locations were shuffled 10000 times, resulting histograms were fit with a Gaussian and R2 values were compared between data histogram and shuffled (bootstrapped permuation test). Data are shown as mean ± SEM. Data collection and analysis were not performed blind to the experimental conditions.
HHMI A
uthor Man
uscr
ipt
HHMI A
uthor Man
uscr
ipt
HHMI A
uthor Man
uscr
ipt
A supplementary checklist is available.
Supplementary Material
Refer to Web version on PubMed Central for supplementary material.
Acknowledgments
We thank S. Royer, M. Karlsson, J. Osborne, J. Chen and S. Sawtelle for assistance in designing the experimental set up; J. Cohen and A. Lee for technical assistance; WL. Sun for fiber etching; B. Shields and M. Copeland for histology; M. Lengyel, E. Pastalkova, Y. Wang, and B. Lustig for discussions; and M. Mehta, J. Dudman, A. Lee and N. Spruston for comments on the manuscript. This work was supported by Howard Hughes Medical Institute and in part by RIKEN, Wako-shi Japan and HHMI to MIT (ST).
References
1. Shepherd, GM. The Synaptic Organization of the Brain. 5. Oxford University Press; New York: 2004.
2. Steward O, Scoville SA. Cells of origin of entorhinal cortical afferents to the hippocampus and fascia dentata of the rat. J Comp Neurol. 1976; 169:347–370. [PubMed: 972204]
3. Megias M, Emri Z, Freund TF, Gulyas AI. Total number and distribution of inhibitory and excitatory synapses on hippocampal CA1 pyramidal cells. Neuroscience. 2001; 102:527–540. [PubMed: 11226691]
4. Cauller LJ, Clancy B, Connors BW. Backward cortical projections to primary somatosensory cortex in rats extend long horizontal axons in layer I. J Comp Neurol. 1998; 390:297–310. [PubMed: 9453672]
5. Petreanu L, Mao T, Sternson SM, Svoboda K. The subcellular organization of neocortical excitatory connections. Nature. 2009; 457:1142–1145. [PubMed: 19151697]
6. Xu NL, et al. Nonlinear dendritic integration of sensory and motor input produces an object localization signal. Nature. 2012; 492:247–251. [PubMed: 23143335]
7. Harnett MT, et al. Potassium channels control the interaction between active dendritic compartments in layer 5 cortical pyramidal neurons. Nature. 2013; 79:516–529.
8. Larkum ME, Zhu JJ, Sakmann B. A new cellular mechanism for coupling inputs arriving at different cortical layers. Nature. 1999; 389:338–341. [PubMed: 10192334]
9. Larkrum M. A cellular mechanism for cortical associations: an organizing principle for the cerebral cortex. Trends Neurosci. 2013; 36:141–151. [PubMed: 23273272]
10. Takahashi H, Magee JC. Pathway interactions and synaptic plasticity in the dendritic tuft regions of CA1 pyramidal neurons. Neuron. 2009; 62:102–111. [PubMed: 19376070]
11. Tsay D, Dudman JT, Siegelbaum SA. HCN1 channels constrain synaptically evoked Ca2+ spikes in distal dendrites of CA1 pyramidal neurons. Neuron. 2007; 56:1076–1089. [PubMed: 18093528] 12. Jarsky T, Roxin A, Kath WL, Spruston N. Conditional dendritic spike propagation following distal
synaptic activation in hippocampal CA1 pyramidal neurons. Nature Neuroscience. 2005; 12:1667– 1676. [PubMed: 16299501]
13. Kamondi A, Acsady L, Buzsaki G. Dendritic spikes are enhanced by cooperative network activity in the intact hippocampus. Journal of Neuroscience. 1998; 18:3919–3928. [PubMed: 9570819] 14. Sjöström PJ, Häusser M. A Cooperative Switch Determines the Sign of Synaptic Plasticity in
Distal Dendrites of Neocortical Pyramidal Neurons. Neuron. 2006; 51(2):227–238. [PubMed: 16846857]
15. Salinas E, Sejnowski TJ. Gain modulation in the central nervous system: where behavior, neurophysiology and computation meet. The Neuroscientist. 2001; 7:430–440. [PubMed: 11597102]
16. Pouget A, Deneve S, Duhamel J-R. A computational perspective on the neural basis of
multisensory spatial representations. Nature Reviews Neuroscience. 2002; 3:741–747. [PubMed: 12209122]
HHMI A
uthor Man
uscr
ipt
HHMI A
uthor Man
uscr
ipt
HHMI A
uthor Man
uscr
ipt
17. Suh J, Rivest AJ, Nakashiba T, Tominaga T, Tonegawa S. Entorhinal cortext layer III input to the hippocampus is crucial for temporal association memory. Science. 2011; 334:1415–1420. [PubMed: 22052975]
18. Witter, et al. Cortico-hippocampal communication by way of parallel parahippocampal-subicular pathways. Hippocampus. 2000; 10:398–410. [PubMed: 10985279]
19. Epsztein J, Brecht M, Lee AK. Intracellular determinants of hippocampal CA1 place and silent cell activity in a novel environment. Neuron. 2011; 70:109–120. [PubMed: 21482360]
20. Harvey CD, Collman F, Dombeck DA, Tank DW. Intracellular dynamics of hippocampal place cells during virtual navigation. Nature. 2009; 461:941–946. [PubMed: 19829374]
21. Grienberger C, Chen X, Konnerth A. NMDA receptor-dependent multidendrite Ca(2+) spikes required for hippocampal burst firing in vivo. Neuron. 2014; 81:1274–1281. [PubMed: 24560703] 22. Wood ER, Dudchenko PA, Robitsek RJ, Eichenbaum H. Hippocampal neurons encode information
about different types of memory episodes occurring in the same location. Neuron. 2000; 27:623– 33. [PubMed: 11055443]
23. Markus EJ, et al. Interactions between location and task affect the spatial and directional firing of hippocampal neurons. J Neurosci. 1995; 15:7079–7094. [PubMed: 7472463]
24. Frank LM, Brown EN, Wilson M. Trajectory encoding in the hippocampus and entorhinal cortex. Neuron. 2000; 27:169–178. [PubMed: 10939340]
25. Leutgeb S, et al. Independent codes for spatial and episodic memory in hippocampal ensembles. Science. 2005; 309:619–623. [PubMed: 16040709]
26. Royer S, et al. Control of timing, rate and bursts of hippocampal place cells by dendritic and somatic inhibition. Nature Neuroscience. 2012; 15:769–775. [PubMed: 22446878]
27. Brankack J, Stewart M, Fox SE. Current source density analysis of the hippocampal theta rhythm: associated sustained potentials and candidate synaptic generators. Brain Res. 1993 Jul 2; 615(2): 310–27. [PubMed: 8364740]
28. Mizuseki K, Sirota A, Pastalkova E, Buzsaki G. Theta oscillations provide temporal windows for local circuit computation in the entorhinal-hippocampal loop. Neuron. 2009; 64:267–280. [PubMed: 19874793]
29. Thomson AM. Facilitation, augmentation and potentiation at central synapses. Trends Neurosci. 2000; 23:305–312. [PubMed: 10856940]
30. Xu W, et al. Distinct neuronal coding schemes in memory revealed by selective erasure of fast synchronous synaptic transmission. Neuron. 2012; 73:990–1001. [PubMed: 22405208]
31. Anderson JS, Lampl I, Gillespie DC, Ferster D. The contribution of noise to contrast invariance of orientation tuning in cat visual cortex. Science. 2000; 290:1968–1972. [PubMed: 11110664] 32. Kuhn A, Aertsen A, Rotter S. Neuronal integration of synaptic input in the fluctuation driven
regime. J Neurosci. 2004; 24:2345–2356. [PubMed: 15014109]
33. Buzsaki G, Horvath Z, Urioste R, Hetke J, Wise K. High frequency network oscillation in the hippocampus. Science. 1992:1025–1027. [PubMed: 1589772]
34. O’Neill J, Senior T, Csicsvari J. Place-selective firing of CA1 pyramidal cells during sharp wave/ ripple network patterns in exploratory behavior. Neuron. 2006; 49:143–155. [PubMed: 16387646] 35. Buzsaki G, Leung LW, Vanderwolf CH. Cellular bases of hippocampal EEG in the behaving rat.
Brain Res. 1983; 287:139–171. [PubMed: 6357356]
36. Sullivan D, Csicsvari J, Mizuseki K, Mongomery S, Diba K, Buzsaki G. Relationships between hippocampal sharp waves, ripples, and fast gamma oscillation: Influence of dentate and entorhinal cortical activity. The Journal of Neuroscience. 2001; 31(23):8605–8616. [PubMed: 21653864] 37. O’Keefe J, Burgess N. Dual phase and rate coding in hippocampal place cells: theoretical
significance and relationship to entorhinal grid cells. Hippocampus. 2005; 15:853–866. [PubMed: 16145693]
38. Rolls ET. Entorhinal cortex grid cells can map to hippocampal place cells by competitive learning. Network. 2006; 17:447–465. [PubMed: 17162463]
39. McHugh TJ, Blum KI, Tsien JZ, Tonegawa S, Wilson MA. Impaired hippocampal representation of space in CA1-specific NMDAR1 knock out mice. Cell. 1996; 87:1339–13349. [PubMed: 8980239]
HHMI A
uthor Man
uscr
ipt
HHMI A
uthor Man
uscr
ipt
HHMI A
uthor Man
uscr
ipt
40. Kentros C, Hargreaves E, Hawkins RD, Kandel ER, Shapiro M, Muller RV. Abolition of long-term stability of new hippocampal place cell maps by NMDA receptor blockade. Science. 1998; 280:2121–2126. [PubMed: 9641919]
41. Mehta MR, Quirk MC, Wilson MA. Experience-dependent asymmetric shape of hippocampal receptive fields. Neuron. 2000; 25:707–715. [PubMed: 10774737]
42. Song S, Miller KD, Abbott LF. Competitive Hebbian learning through spike-timing-dependent synaptic plasticity. Nature Neuroscience. 2000; 3:919–926. [PubMed: 10966623]
43. McClelland JL, McNaughton BL, O’Reilly RC. Why there are complementary learning systems in the hippocampus and neocortex: Insights from the successes and failures of connectionist models of learning and memory. Psychol Rev. 1995; 102:419–457. [PubMed: 7624455]
44. Hill AJ. First occurrence of hippocampal spatial firing in a new environment. Exp Neurol. 1978; 62:282–297. [PubMed: 729680]
45. Frank LM. Hippocampal plasticity across multiple days of exposure to novel environments. J Neurosci. 2004; 24:7681–7689. [PubMed: 15342735]
46. Monaco JD, Rao G, Roth ED, Knierim JJ. Attentive scanning behavior drives one-trial potentiation of hippocampal place fields. Nature Neurosci. 2014; 17:725–731. [PubMed: 24686786]
47. Palmer L, Murayama M, Larkum M. Inhibitory regulation of dendritic activity in vivo. Front Neural Circuits. 2012; 6:26. [PubMed: 22654734]
48. Jiang X, Wang G, Lee AJ, Stornetta RL, Zhu JJ. The organization of two new cortical interneuronal circuits. Nature Neuroscience. 2012; 16:210–218. [PubMed: 23313910]
49. Lovett-Barron M, Kaifosh P, Kheirbek MA, Danielson N, Zaremba JD, Reardon TR, Turi GF, Hen R, Zemelman BV, Losonczy A. Dendritic inhibition in the hippocampus supports fear learning. Science. Feb 21; 2012 343(6173):857–63. 2014. [PubMed: 24558155]
50. Gambino F, et al. Sensory-evoked LTP driven by dendritic plateau potentials in vivo. Nature. 2014