HAL Id: hal-02053807
https://hal-mines-albi.archives-ouvertes.fr/hal-02053807
Submitted on 1 Mar 2019HAL is a multi-disciplinary open access archive for the deposit and dissemination of sci-entific research documents, whether they are pub-lished or not. The documents may come from teaching and research institutions in France or abroad, or from public or private research centers.
L’archive ouverte pluridisciplinaire HAL, est destinée au dépôt et à la diffusion de documents scientifiques de niveau recherche, publiés ou non, émanant des établissements d’enseignement et de recherche français ou étrangers, des laboratoires publics ou privés.
Experimental study and numerical simulation of preform
infrared radiative heating
S. Monteix, F. Schmidt, Y. Lemaoult, G. Denis, M. Vigny
To cite this version:
S. Monteix, F. Schmidt, Y. Lemaoult, G. Denis, M. Vigny. Experimental study and numerical sim-ulation of preform infrared radiative heating. 2000 Quantitative InfraRed Thermography, Jul 2000, Reims, France. �10.21611/qirt.2000.026�. �hal-02053807�
EXPERIMENTAL
STUDY
AND
NUMERICAL
SIMULATION OF PREFORM INFRARED RADIATIVE
HEATING
Serge Monteix
(*), F. Schmidt
(*), Y. LeMaoult
(*), G. Denis
(**), M. Vigny
(**)(*)Ecole des Mines d’Albi-Carmaux Campus Jarlard, Route de Teillet, 81013 ALBI CT Cedex 09 (France) (**) Perrier-Vittel M.T., BP 43 88805 Vittel Cedex (France)
ABSTRACT
The injection stretch-blow moulding process of thermoplastic bottles requires an heating step before forming. An amorphous preform is heated above the glass transition temperature (80°C for the P.E.T.) using an infrared oven. This step is fundamental in order to determine the thickness distribution along the preform height and then insure high quality bottles.
Thus, the optimisation of the infrared oven is necessary. Various experiments have been conducted to characterise the heat source and the semi-transparent properties of the P.E.T. Measurements of air temperature inside the infrared oven and air cooling speed have been processed. These parameters have been implemented in control volume software that simulates the heating step. The surface temperature distribution of the preform has been measured using an infrared camera. Comparisons between experimental and numerical results for a rotating preform are presented.
1. Introduction
The injection stretch-blow moulding process of thermoplastic bottles requires a heating step before forming. An amorphous tube-shaped preform is heated above the glass transition temperature (80°C for the P.E.T.) using an infrared oven [1]. As the P.E.T. conductivity is low (0.29 W/m/K), halogen lamps permit a rapid heating with a high flux intensity. In addition, a cooling fan is necessary in order to prevent P.E.T. thermal crystallisation that will induce non-amorphous preform. However, there are plenty of parameters such as number of lamps, distance between halogen lamps and preform, electrical power of the lamps, air cooling speed, reflectors, rotation speed,…. Therefore optimising infrared oven in order to design new plastic bottles is still a long and costly work.
The main objective of this work was to develop numerical software using control volume method that simulates the heating step of the preform. For that, we have to take into account influent parameters of the heating step such as halogen lamps characterisation and P.E.T. spectral properties. In addition, we need to measure the preform temperature. We have used an 880 LW AGEMA infrared camera (connected to real time software) in order to measure external and internal preform surface temperature distribution, heat transfer coefficient along preform height. The air temperature surrounding the preform and inside the preform is measured using thermocouples.
2. Heat source characterisation
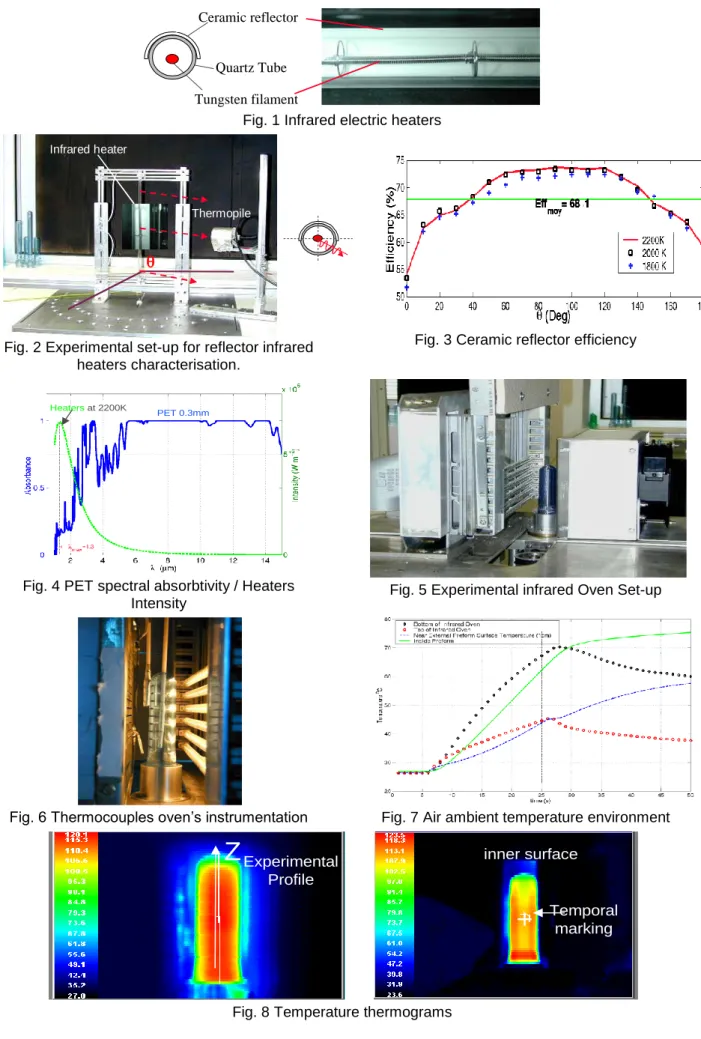
Halogen lamps commonly used for the heating step are presented in figure 1. They are composed of a coiled tungsten filament, contained in a quartz tubular enclosure coated with ceramic in its back (ceramic reflector). Between the concentric cylinders, there is a neutral gas (Argon) that allows high temperature of the filament without important evaporation of the tungsten.
Spectral properties of these elements have already been measured in previous paper [2]. Using these data, the tungsten filament and quartz tube temperatures are calculated using a net radiation method [3]. In a first approach, the reflectivity of tungsten and quartz elements is neglected.
Finally, the steady state heat balance equation leads to the following system of equations (1), solving using a Newton-Raphson method:
0 ln 2 0 ln 2 4 * 4 * 4 T T hS T S df d T T k L T S df d T T k L T S P Q Q Q Q Q Q Q f g Q f f f Q Q Q f g Q f f f (1)Where P is the electrical power of the lamps; the indices f and q refer respectively to the tungsten and the quartz tube; T is the temperature, L the lamp length, d the filament diameter, and the average emissivity and absorptivity. At the nominal lamp power of 1 kW, this model permits to calculate a filament temperature at 2500 K and quartz tube temperature at 1000 K.
In order to measure the ceramic reflector efficiency, experiments were performed using a thermopile detector with a large spectral bandwidth [0.25-26 m]. This experimental set-up is shown in figure 2. We measured the spatial directivity of the lamps with and without ceramic reflector, moving the flux sensor around the filament. The efficiency of the reflector
K
eff for each angle is calculated using:reflector) without lamp the from irradiate ntensity reflector with lamp the from irradiate ntensity i i Keff ( * 2 (2)
The efficiency coefficient is plotted versus angle in figure 3. The average value is about 68 %. In addition, we note that the temperature of the tungsten filament has no effect.
3.Characterisation of P.E.T. spectral properties
P.E.T. spectral properties measurements were performed using a 3-mm thick sheet. These sheets were processed by injection moulding in the same conditions than tubular preforms. Thermal analysis experiments were carried out in order to measure the sheets crystallinity. Samples of 10-15 mg weight were cut away from the thick sheet. The DSC experiments were performed on a Mettler calorimeter at a heating rate of 10°C/min. The average crystallinity value of these measurements was about 5 %, corresponding to an amorphous P.E.T., which means that diffusion of the radiation can be neglected.
Then we have proceeded to P.E.T. spectral properties measurements (transmitivity, reflectivity) using a Perkin-Elmer FT-IR spectrometer. The previous thick sheets were polished in order to obtain samples of 0.3-mm thickness. The measured absorbtivity is plotted versus wavelength (figure 4). The spectral distribution radiated by the tungsten filament at temperature of 2200 K is superimposed. It appears from these experimental data that the material is transparent at short wavelengths where the intensity of the radiation is maximum. In addition, the polymer is opaque for wavelengths in the range of 8 to 12 m with an average emissivity of 0.93. This bandwidth corresponds to the one of the infrared camera.
4. Experimental data
Figure 5.a shows the experimental set-up developed on the basis of industrial infrared oven using in injection blow moulding machines. This device consists of six halogen lamps (Philips 1000 W-235 V SK15) describes previously, monitored by power device. The preform is fixed on a rotating support to provide homogeneous hoop temperature. Behind the preform, there is a cooling fan controlled by a DC supply. A pneumatic system allows the preform displacement inside and outside the oven.
4.1 Measurement of the air temperature inside the oven
For the measurement of the air temperature inside the oven, J type thermocouples were used. They are connected to a Keithley recorder instrument. All thermocouples are shielded with aluminium adhesive tape. They are mounted in the oven as presented in figure 5.b. In order to place a thermocouple inside the preform, the top of the preform is drilled. Average data issued from a set of measures are plotted in figure 6. In particularly, we note that the temperature of the air inside the preform, still increase after the heating stop.
4.2 Measurement of surface temperature distribution
Typical infrared thermograms for external surface temperature distribution of the preform are presented in figure 7.
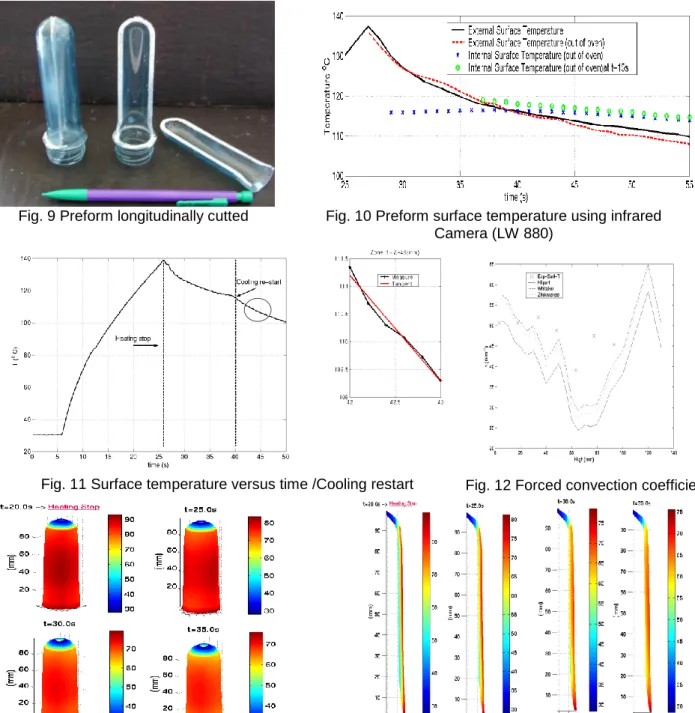
However, the internal surface temperature measurement is more tedious and necessitates developing a specific process. First, we have to cut the preform in its longitudinal-section (figure 8). Then, the two half-parts of the preform are sticking together using a conductive grease to insure joining during the heating time. All the lamps are set to the same temperature, coupled with the cooling fan, during 20 seconds. Then the rebuild preform exits from the oven in front of the camera. In order to make possible the internal surface temperature measurement, one half-parts is removed (immediately after preform recovering or after a characteristic inversion time). Comparison of external and internal surface temperature measurements versus time (figure 9) provides the temperature inversion throughout preform thickness (frequency of analysis is equal to 1 frame per second).
4.3 Measurement of air forced convection heat transfer coefficient
In this section, we want to determine the air forced convection heat transfer coefficient, generated by the cooling fan along the preform height. Two different methods are developed and compared. The first one consists in measuring air-cooling speed using a hot wire anemometer (Ans Snelco). The calculated Reynolds numbers deduced from these data are in the range between 4000 and 10000 that is to say a turbulent flow. Then, we identify from the literature [5,6,7] different classical relationships that are suitable for a cylinder in cross flow, i.e. Nu f Re, Pr
.The second method is based upon the preform surface temperature measured in presence of cooling flow. The following specific experimental procedure has to be observed in order to compute the heat transfer coefficient: first, a 20 seconds heating time coupled with cooling; then turn off heating and cooling in order to insure an uniform temperature throughout the preform thickness; then restart the cooling fan. Thus, the last step of the procedure allows solving analytically the energy balance integrated over the thickness if we assume that the main part of the preform is a hollow tube. For a given height, the relationship for the heat transfer coefficient h yields:
Re Ri Re T T dt T d Cp h o t 2 2 0 (3)Where T is the thickness-average temperature, Cp the P.E.T. heat capacity, the P.E.T.
specific mass, T the thickness-average ambient temperature, Re and Ri are respectively the
external and internal preform radii. Ri is computed using the depth penetration throughout the
preform (4) over a characteristic time t, for which we have sufficient temperature data to calculate the initial slope
dT dt t0
of the temperature-time plot (figure10).
t Re e Re Ri 2 (4)
Where is the P.E.T. diffusivity and the argument of the erf function, computing assuming the surface temperature has decreased of 90% at the depth thickness. In figure 11, we present a comparison between the heat coefficient measured using both methods. The agreement between the two different methods is fair. It permits to calculate an average air cooling heat transfer coefficient of 45 W/m2.K± 5.
All these process parameters will be useful for the numerical model assessment.
5. Modelling of infrared PET preform heating 5.1 Control-volume model
3D control-volume software, called PLASTIRAD, has been developed in order to compute heat transfer during the infrared-heating step. The preform is meshed using hexahedral elements so-called control volumes [8]. The temperature balance equation including radiative transfer (thermal power absorbed by the semitransparent P.E.T. preform radiates from halogen lamps) is integrated over each control volume and over the time interval from t to t+t (5):
t r t t p e e e dt d n dt d n T k dt d t T c . . (5) Wheree is the control-volume, qc the Fourier’s flux and qr the radiative heat flux. The
unknown temperatures are computed at the cell centres. Further details on the numerical procedure (view factor computation, volume source) are given in previous paper [9].
5.2 Numerical simulation
We performed simulation of the heating step for a P.E.T. preform, taking into account processes parameters introduced previously. The values of the main parameters are summarised in the table below.
Heating time (s) Cooling time (s) Number of lamps Distance lamps-preform (mm) Heat transfer coefficient (W/m2.K) Lamps Temperature (K) Rotation Speed r s-1) 20 20 6 20 45 2400 1.2
External surface temperature distribution versus time is presented in figure 12. In addition, numerical computations allow computing temperature distribution in the preform
cross-http://dx.doi.org/10.21611/qirt.2000.026
section (figure 13). Finally, a comparison between numerical and experimental data is presented in figure 14. Preliminary comparison shows a discrepancy, between computed and measured temperature. We observed that the computed temperature decreases more rapidly during the cooling step. We have to introduce a more accurate heat transfer coefficient and time dependent air temperature in order to improve the simulation.
Conclusion
Numerical simulations of P.E.T. preform heating stage have been performed successfully. Characterisations of halogen lamps and P.E.T. spectral properties have been processed in order to define assumptions necessary for describing the heat transfers inside the oven.
An original method was developed to measure the internal surface temperature of the rotating preform, using a cut-preform technique. This procedure allows measuring the so-called inversion temperature phenomenon. The forced convection coefficient due to the cooling fan was measured along the preform height using an infrared camera. In addition, the infrared oven was instrumented using thermocouples that provide the air temperature evolution inside the oven and inside the preform. The infrared camera is a powerful device in order to make quantitative temperature measurements and to assess the numerical simulations
All the measured parameters have been included in the numerical model. The agreement between numerical simulations and experimental data is fair considering the simple model used for absorption (Beer-Lambert law).
Future developments will include coupling between infrared heating simulations and stretch-blow moulding simulations.
Acknowledgements
Perrier-Vittel Company supports this work. Special thanks go to J-P. Arcens, C. Miquel and M. Farasse
Reference
[1] Rosato D. V., Blow Moulding Handbook. New York: Carl Hauser, 1989
[2] Le Maoult Y., F. Schmidt, El Hafi M., Lebaudy P., « Measurement and Calculation of Preform Infrared Heating », 4th International Workshop on Advanced Infrared Technology and Applications, Firenze, pp. 321-331, Sept. 15-16, 1997
[3] Petterson M., ”Heat Transfer and Energy Efficiency in Infrared Papers Dryers”, Ph. D. Thesis, Lund University, Sweden
[4] Özisik M.N.,” Finite Difference Methods in Heat Transfer “,CRC Press,1994 [5] Holman J. P.,” Heat Transfer”, Seventh Ed., Metric,1992
[6] Incropera F. De Witt D.P.,” Fundamentals of heat and mass transfer”, Third Ed. 1990 [7] Özisik N. M.,” Heat Transfer a Basic Approach “, Int. Ed., 1985
[8] Patankar S.V., « Numerical Heat Transfer and Fluid Flow », Ed. Mc Graw Hill, New-York, 1980
[9] Monteix S. ,” Experimental Study and Numerical Simulation of Preform or Sheet Infrared Radiative Heating”, AMPT’99, Dublin, 3-6 August 1999
Tungsten filament Ceramic reflector
Quartz Tube
Fig. 1 Infrared electric heaters
Thermopile Infrared heater
Fig. 2 Experimental set-up for reflector infrared heaters characterisation.
Fig. 3 Ceramic reflector efficiency
Heaters at 2200K
PET 0.3mm
Fig. 4 PET spectral absorbtivity / Heaters
Intensity Fig. 5 Experimental infrared Oven Set-up
Fig. 6 Thermocouples oven’s instrumentation Fig. 7 Air ambient temperature environment
Temporal marking
+
inner surfaceZ
Experimental ProfileFig. 8 Temperature thermograms
http://dx.doi.org/10.21611/qirt.2000.026
Fig. 9 Preform longitudinally cutted Fig. 10 Preform surface temperature using infrared Camera (LW 880)
Fig. 11 Surface temperature versus time /Cooling restart Fig. 12 Forced convection coefficient
Fig. 13 Numerical simulation of preform surface temperature versus time
Fig. 14 Numerical simulation of preform temperature versus time across thickness
Fig. 15 Experimental and Numerical Surface Temperature Results versus time