by
LISA CAROL GLITSCH
Subnitted in Partial Fulfillment
of the Requirements for the
Degree of Bacheloz· of Science
at the
MASSACHUSETl'S INSTITUTE OF TEX!HNOLOGY
June,
1976
Signature of Author
••••••••11•••••0•••·· .. " · · ·Signature redacted
Department of Physics,
_' / ' May7, 19?6
Certified
bySignature redacted
, , ~ . , . , : · r,, .-.. ,, 1.;,rrl\~;i,;
·;~;;~i;~;, , , , .
/
Signature redacted
•••••••••••••••e•••••••••••'••••••••~\t.,oe••••••••••• C ilff,111a11 k'Departmental
Accepted
byCommitttS~ on Theses
DETERMINATION OF THE SPLASH PROPERTIES OF
VARIOUS LIQUIDS USING HIGH-SPEED PHOTOGRAPHY
by
Lisa Carol Glitsch
Submitted to the Department of Physics in May of 1976 in the partial fulfillment of the requirements for the degree of Bachelor C Science.
ABSTRACT
The dynamics of the splashing process for various liquids has
been investigated using high-speed photography. A
dimensional-analysis method is used to correlate the height of the Rayleigh
jet and the degree of crown disintegration to the Weber (p VoR/1
)
and Reynolds (p VoR/fl) numbers of the liquids where O,j, andfl
are respectively the fluid properties of density, surface tension, and viscosity, R is the radius of the impingement droplet, and Vo
is the droplet impact velocity. In addition the effect of the
splash-pool depth on the jet height and the degree of crown disin-tegration were studied. Extensive data were taken for dyed water
and several data points were taken for toluene, ethanol, glycerin, olive oil, and mercury.
It has been found that the jet height increases as the liquid viscosity and surface tension decrease, that the jet height is
proportional to approximately the square of the droplet impact
velocity, and that the degree of crown disintegration is related
to the jet height. It was also found that the jet height is
related to the splash-pool depth when this depth is less than 15 mm for a water droplet 1.5 mm in radius. More explicitly, the jet height is zero at zero pool depth, approaches a constant value at a depth of 15 mm, and exhibits a maximum at the inter-mediate depth of approximately 9 mm.
Thesis Supervisora Harold E. Edgerton
ACKNOWLEDGEMENTS
The author is deeply indebted to Prof. Harold Edgerton for his kind and patient assistance and advice on how to take good pictures and to conduct research properly, to Mr. Bill McRoberts for his technical assistance, and to Ms. Jean Mooney for her
helpful comments. Finally the author would like to express her
deep appreciation to Dr. Earl Wolts, who typed and corrected the final document, and without whose valuable assistance this thesis would never have been completed.
TABLE OF CONTENTS Chapter Page Number Number Title Page 1 Abstract 2 Acknowledgements 3 Table of Contents 4 List of Tables 5 List of Figures 5 I. INTRODUCTION 6
II. APPARATUS AND PROCEDURES 11
III. RESULTS 15
IV. ANALYSIS OF RESULTS 21
V. CONCLUSIONS 30
VI. RECOMMENDATIONS 31
VII. APPENDICES 32
A. Calculation of data 32
LIST OF TABLES
Properties of Liquids Used in Thesis Range of Experimental Variables Summary of Experimental Data
LIST OF FIGURES
Experimental Apparatus
Photographs of Typical Splashes
Jet Height Versus the Weber Number
Jet Height Versus the Reynolds Number
Jet-Height Dependence on the Pool Depth for Water
Table Number II-2
III-2
Figure NumberIII-'
IV-1
IV-2
IV-3
Page Number 11 1818
Page Number14
17
24
26
28
CHAPTER I
INTRODUCTION
The phenomena associated with liquid drop splashes play important roles in many naturally occurring evetts such as soil erosion and
the dispersal of seeds and microorganisms. In addition, the electrical charges which are separated during splashing are responsible for
waterfall electrification and probably also play a role in separating electrical charges in natural clouds.
The first quantitative studies of splashes were conducted by Rayleigh (1879) and Worthington (1900, 1908), who first photographed the process. In the century following their studies much additional work, both theoretical and experimental, has been done to further
define the process. Numerical solutions to the Navier-Stokes equation
in two dimensions have been obtained to describe the dynamics of the
fluid during the splash (Harlow, June,11967; September, 1967).
Experi-mentally, relations have been determined for the maximum crater depth
produced by the impact (Engel, 1966, 1967; van de Sande, et al, 1974)
and for the number of spray droplets ejected during the splash (Hobbs and Kezweeny, 1967). Also, the effect of pool depth on the nature of the splash has been investigated (Hobbs and Osheroff, 19671 Macklin
and Hobbs, 1969).
Briefly, the events that occur during splashing are the following.
A drop impacts the surface of a liquid; a crater is formed; and the
displaced liquid is thrown up and around the drop in a circular wall. The wall rises in height to a maximum level as the drop penetrates the
surface and then collapses. The downward flow of liquid into the crater results in the ejection of a large column of liquid known as
the Rayleigh jet. The crater wall often pinches off into separate
drops producing a crown. Smaller droplets are also seen to spray
from the crown and jet. These droplets are responsible for the disperaal of microorganisms and for soil erosion. The results of the work which has been done to more completely describe the process are outlined in the subsequent paragraphs.
In Harlow's numerical solutions of the Navier-Stokes equations,
the system is modeled on the size of drop to dppth of pool ratio;ni and the impact velocity of the drop, neglecting both surface tension
and viscosity effects. His findings are summarized as follows: 1) When
a drop impinges on a flat plate, no upward motion of liquid is observed, instead the drop spreads across the plate in a lateral sheet at 1.6
times its impact speed. 2) When a drop splashes into a shallow liquid,
an upward motion is observed. Even a very thin film of liquid is
enough to interact appreciably with the lateral sheet to produc6 a
crown. However, no jet is observed. 3) In a deep pool splash the
crucial parameter is the impact velocity. As the velocity increases
above a critical value, the drop breaks into spparate pieces upon
impact and the splashing is changed. Below this critical value,
the process is normal, a crown and jet both forming. 4) Shortly
after the drop hits the surface of the liquid it is greatly distorted.
The mass in the drop is divided into three principle regions. Most
of the drop is in the base of the crater waiting to be pushed up into
the Rayleigh jet. A small amount is carried up the crater wall, and
downward jet was first observed experimentally by Hodgin (1975). The experimental and theoretical studies of Engel and van de
Sande describe the maximum crater depth in terms of the energies of
the splashing drop. The theorbtical results are based on solving
Laplace's equation in cylindrical coordinates,A invoking conservation
of energy. The equation derived by Engel to give Rm, the maximum radius of the cavity in the target liquid is,
r~f9Y2
17.4
~1
Rm
Rm=(
jV2
6.6667 gl0tg
+ +311.49
2 - 17.64912tg2/0t
wherepd is the density of the drop liquid and
Pt
that of thetarget liquid; d is the drop diameter; V is the impingement velocity;
g is the acceleration due to gravity; and X is the surface tension
of the target liquid. Although the experimental data agree well
with the theory, tests have been made only for drops with very high
velocities. It is not certain that the equation holds for low velocity
impacts.
Hobbs and Kezweeny, experimenting with a milk-water solution,
found a linear relation between the number of spray droplets produced
from the crown and the distance of fall of the drop. They also
determined that the number of droplets produced was related to the
amount of time that the crater wall remained above the surface. Their
results seem reasonable in light of the fact that the kinetic energy of the drop is linearly proportional to its distance of fall and that
the amount of time the crater wall remains above the surface is
related to the energy given to the liquid by the drop. Hobbs and
Osheroff, experimenting again with a milk-water solution, were the first to study the number of spray drops produced in splashes on
shallow liquids. When a drop impacts a shallow liquid the nature of the splash process is greatly altered because the boundary at the
bottom of the pool modifies the force configuration. Since a fluid
is incapable of withstanding shear stresses, the force exerted by a fluid at any given instant must always be perpendicular to its surface. The presence of the rigid boundary at the bottom of the liquid creates a surface where the condition of perpendicular forces must be satisfied
and thus the pressures which cause the rise of the crater wall and
Rayleigh jet are different in a shallow liquid than in a deep liquid.
Their results indicate that, for a drop radius of 1.5 mm, the depth
at which the bottom of the pool becomes noticeable is approximately
15 mm. Below this depth the maximum height of the Rayleigh jet and
the number of drops broken off from the jet increases with decrease in depth to a depth of about 8 mm at which point both fall off rapidly. The average number of drops into which the jet disintegrates was
found to be approximately
3.5.
Below 2 mm, no jet is formed. Thecrown is extremely unstable and tends to disintegrate completely
into rather large drops. Unfortunately as they counted only the
number of large, observable drops and did not try to record the number of smaller spray droplets produced, their results are of limited
usefulness since it is the small drops which are most important in
transport processes. Repeating their experiments with dyed water, which has a higher surface tension than the milk-water solution, they found no essential difference in the results except that the dyed water tended to rise much higher although producing approximately the
same number of jet drops.
splash process, no one has as yet determined the functional relation between the fundamettal fluid properties, density, viscosity, and surface tension and the nature of the splash involved, That is, the maximum rise of the Rayleigh jet and the size and height of the
crown. Harlow tties to dismiss the effects of surface tension and
viscosity as unimportant. Others have made generalized assumptions
regarding their effect which have been justified neither theoretically
nor experimentally. In this thesis andattempt has been made to
clarify the importance of fluid properties by experimentally testing
liquids of varying properties. In addition, the effect of the depth
of the target pool was studied. In all cases the splashes tested
were made with the drop and target liquids the same. A theory is
developed based on a dimensional analysis model to quantitatively
describe the general importance of fluid properties. It is the
author's hope that the empirical relation developed in this thesis will be of help to others who try to study the phenomena of splashing in the future.
CHAPTER II
APPARATUS AND PROCEDURES
Basically, the experimental apparatus consisted of a hypodermic needle and syringe which produced uniform droplets, a tank in which the splash was made, awl the photographic set-up which recorded the
splash, A total of six liquids were used as described in Table II-1.
In all cases, the drop and target liquid were identical.
Liquid
Water
Toluene
Glycerin
Ethanol
Olive oil
Mercury
Table II-1
Density(m)cc
1.000.88
1.26
.90
.918
13.546
PropertiesViscosity(cpoise) Surf. tension(dcne)
1.053
72.05
.590
28.5
1490.
63.4
1.20
22.7
84.0
41.5
1.534
476.
of Liquids Used In Thesis
The procedure for producing splashes in all liquids except
mercury was fairly similar. To produce a drop of reasonably constant
size, the liquids were forced under a constant pressure head through
a hypodermic needle fitted on a graduated syringe. The syringe was
mounted in a clamp which could be moved vertically on a ringstand. For all liquids except 6thanol, a 266gauge needle was used which
created drops ranging from 2.9 to 3.1 mm in diameter. For ethanol a
22 gauge needle was used producing drops from .8 to 1.2 mm in diameter. The tank in which the splashing occurredvwas a cylindrical metal
The procedure for mercury was different for two reasons. First it is very difficult to make a large drop with mercury, and second extra care must be taken to avoid contaminating the laboratory.
Mercury cannot be contained in a syringe. It sprays out the needle
in many tiny drops under its own weight. To form the splash drops,
a measured amount of mercury was placed in a funnel plugged with a
wooden rod. The rod was removed quickly so that the mercury would
fall out as one drop. The splash was made in a rectangular,
trans-parent plastic box 3" deep by 3" Thng by 1" widle. The box was
placed in a large tank with a glass front, and the floor was covered
with a heavy cloth to catch any extra drops which might escape.
Two different stroboscopic set-ups were used. All of the
pictures of the water splashes were taken with a 35 mm camera fitted
with extension tubes for close focusing and using a General Radio
1540 strobolume for illumination. With this light source the
max-imum f-stop which could be attained using Tri-X film was f-8. Since
at this aperture setting the depth of field when focusing on an
object
3
cm away isoonly a few millimeters, the resulting pictureswere unsatisfactory. To remedy this situation, a brighter light
source was found. For all of the 1lattrtfpltttns anaEG&G 4000 v flash
lamp hooked into a 6tAfcespacitor was used. With this bright source
pictures could be taken with a 4xfycamera using Plus-X film at f-32.
To trigger the flash, a pen light was aimed through the path of the drop at a photocell. When the drop passed through the light beam, the photocell emitted a negative electrical pulse which triggered the
strobe. A delay unit was added to the system so that various stages
Many pictures were taken of the crown and jet in order to study their size and shape. To measure the height of the jet, a ruler was
placed in the pool and the delay was carefully adjusted visually
until the flash caught the jet at its maximum height. When the jet
remained intact, the height of the jet was determined by measuring
the height of the jet body. However when the jet disintegrated or
pinched off into one or more drops, the height of the jet was determined
by the ascent of the first drop of radius larger than 1 mm. To avoid
parallax problems, the camera was positioned as closely as possible
in a horizontal plane even with the markings on the ruler. Several
pictures were taken to accurately determine the average height of the jet.
syringe penlight
4x5
camera
tank strobe lamp control unit and capacitorphoto-cell
delay unit Experimental Apparatus Figure II-lCHAPTER III
RESULTS
As Hobbs and Kezweeny
(1966)
have already shown that thenumber of minute spray droplets ejected from the jet is linearly
proportional to its maximum rise, the measurement of the maximum
jet height is sufficient to characterize the splashing process. In
all cases the maximum height of the Rayleigh jet was determined by
measuring either the maximum rise of the jet body, if the jet stayed
intact, or the maximum ascent of the first drop of radius larger
than I mm, if the jet disintegrated. There are two reasons for
choosing this particular drop size to determine the height of the
jet. In pictures which snow the jet before it disintegrates completely,
the head is seen to pinch off into a drop of approximately 1 mm radius. Since the jet is composed of the original drop fluid and contains
very little, if any, target fluid, it cannot rise to arbitrarily
large heights in one piece without breaking into smaller drops. Thus,
measuring the height of the first large drop is equivalent to measuring
the height of the jet. Furthermore, since drops of various sizes
are seen to shoot out of the head of the jet, it is necessary to standardize the size of the reference drop. Smaller drops carrying the same momentum as large drops rise much higher. Measuring the height of the first observable drop without taking into account its size would give meaningless results.
Because it is much more difficult to determine the height of the crown than that of the jet, as the crater wall rises at most
only 1 or 2 mm above the liquid surface and may or may not break into several drop3, the author chose to establish a scale from 0-4 to define the degree of disintegration of the crater wall, which is
also proportional to the number of spray droplets ejected. The
scale is defined as such: 0 - hotbreak-up of the wall whatsoever,
wall remains smooth; 1 - top of wall begins to wrinkle but does not
coalesce; 2 - crater wall forms bulges which do not break away as
drops, small drops are seen to spray from crown; 3 - large drops
of diameter greater than 1 mm break away from crown but most of
crown remains; 4 - entire crown disintegrates. Although mildly
subjective, this scale provides a reasonable depcription of the degree of crown disintegration and probably gives the best estimate
of the number of spray droplets efected outside of counting them
directly.
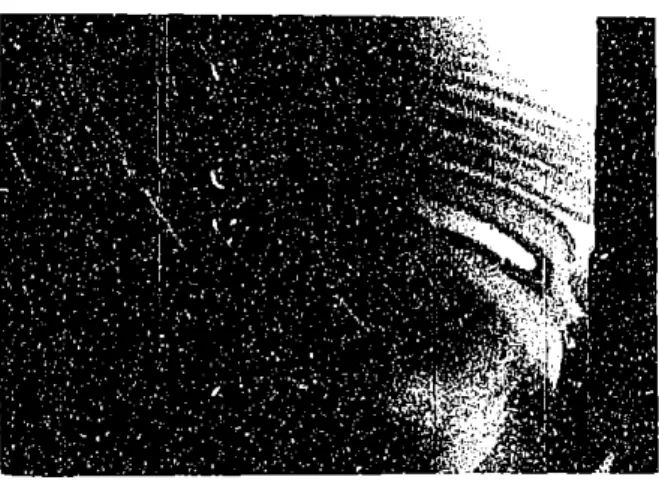
Approximately 250 experimental conditions were photographed
and analyzed for the jet height and crown disintegration. Typical photographs for each of the six experimental liquids are displayed
in Figure III-1. The ranges of drop heights (h), pool depths (D),
and droplet sizes (R) for each liquid are presented in Table III-1.
A summary of the results indicating the average jet height (H) and
crown disintegration (CD) obtained at the given experimental conditions
is displayed in Table 111-2. These results indicate that the jet height increases with drop size and splash height, decreases as the
surface tension and viscosity increase, and increases from
approxi-mately zero at small pool depths to a maximum before decreasing to
an essentially constant value at large pool depths. This last result is consistent with Harlow's calculations (1967) for small pool depths
---MO...D
jwl .W.rva
Water jet before complete pinch-off Toluene, h = 23 cm
Ethanol, h = 20 cm Mercury crown
Glycerin, h - 1001..m Olive oil, h = 100 cm
and Hobbs aid Osheroff's experimental findings (1967) at large
pool depths.
It should also be noted that mercury did not form a
jet at the presented drop heights and pool depths, possibly because
the small
container used to hold the
mercury may have
restricted the
liquid motion.
Table III-4 Liquid water-permane toluene-red j glycerin-wask ethanol-washa olive oil mercuryRange of Experimental Variables
h (cm)
D (cm)
wnt red ink 0-100 0 - 2.5
aint
10, 23
.5, .9
able blue ink
100
.5,
.9
able blue ink
10, 20
.5, .9
100
.5, .9
40
.9
Table 111-2 Summary of Experimental Data
I. Water
-=
72.05 dyne/cm
92
-1.053 opoise
-1.000 gm/cc
h (cm)
D (cm)
H -(m)
CD
2.6
0
0
-2.6
.5
933
0
2.6
.9
s25
0
5.3
0
0
-5.3
.5
.50
0
5.3
.9
.42
0
1090
0
0
0
10.0
.5
.60
0
10.0
.9
.80
0
!15.0
0
0
1
15.0
.5
.80
0
15.0
.9
1.62
1
15.0
1.5
1.52
0
15.0
2.5
1.50
0
R (cm)
.29-
.31.29-.31
.29--.31
.08-.12
.29--31
mnv MMWAMMMh (cm)
20.; 020.0
20*0
20.0
209030.0
30.0
30.0
30.0
30.0
50.0
50.0
50.0
50.0
50.0
75.0
75.0
75.0
75.0
75.0
100.0
100.0
100.0
100.0
100*0
II. Toluaneh (cm)
10.023.0
23.0
D (cm)
0
.5
.9
1.5
2.5
0
e5
-9
1-5
2.5
0
-5
-9
1.5
2.5
0
-5
-9
1.5
2.5
0
.5
.9
1.5
2.5
H(cm)
0
1.00 2.001.70
1.63
0
1.43
5.12
3.52
3.52
0
2.*026.95
4.67
4.70
0
3.00
9.37
6.27
6.30
0
3.97
11.97
7.50
7.50
-28.5
dyne/cm
f9
=D (cm)
.9
-9
95
H (cm)
1.09
2.25
1.95
CD
2
1
1
1
1
21
21
2
3
2 22
2
4
2
3
2
2
4
3
3
:3
3
.590
epoise
e-
.88
gm/cc
CD0
1
1
III. Glycerin
h
(cm)
100.0
100.0
-63.4
dyne/cm
f1
D (cm)
H(cm)
.5
.9
o35
-50
-1490
opoise
CD9
- 1.26gm/cc
0
0
IV. Ethanc h (am
10.0
10.0
20*0 20.0 V. Olivech (ci
100.(100.
A
=22.7 dyne/cm -fl
1 20 cpoise
1Q
D (cm)
H (cm)
CD
.5
.50
0
.9
1.05
0
.5
1.05
1
.9
4.00
1
oil a)2
2
=41.5 dyne/cm
f1
=84.0
D (cm)
H (cm)
.5
-22
.9
.40
epoise
CDf
.90 gm/cc
-
.918
gm/cc
0
0
VI. Mercury
h (cm)
40.0
-476 dyne/cm
D (cm)
.9
72
=1.534 opoise
H (cm)
CD
0
3
e
- 13.546gm/cc
mmm-mllCHAPTE IV
ANALYSIS OF RESULTS
Because the splashing mechanism depends in a complex way on
geometric and flow parameters, one expects a functional relation for the jet height of the following form:
H = f( Y ,p ,912 , Vo, RDD) (IV-I)
where: H a the Rayleigh height, cm
- the fluid surface tension, dyne/cm or gm/sec2
- the fluid density, gm/cc
L- the fluid viscosity, poise or gm/cm-sec
V0 - the drop impact velocity which depends on the
drop height, cm/sec
R - the drop radius, cm
D - the pool depth, cm
However, an experimental determination of this relation as stated is virtually an impossible task as one would have to make tests at all possible combinations of independent-variable values, which would require utilizing liquids with all combinations of surface tensions, viscosities, and densities.
Fortunately, the use of dimensional analysis obviates these difficulties by grouping the dependent variables into sets of dimensionless ratios and products which are varied by changing the
values of only one variable, naturally the one
bosteasily manipulated.
Mathematically, the method is based on the following theorem, Given
a function of n-1 variables, gi
-f(g
2, g
3...
'
egn), which may be
minimum number of independent dimensions required to specify the
dimensions of all the parameters g1, then the g's may be frouped into
n-m independent dimensionless ratios, called
T
parameters,expres-sible in fundtional form by G(TjTV 2 1 'a.'TFn-m) = 0
or
TTjM
F(Tfl, 3 '... 'n-). A parameter is independent if it cannot
be expressed as a product or quotient of any of the other parameters. The rigorous proof of this theorem is straightforward, but too
complicated to merit being described in detail. The essentials of the proof consist of writing the total derivative of g in terms of its partial derivatives with respect to the m separate dimensions. As there are m dimensions to describe n variables, a maximum of n-m
independent dimensionless ratiod can be attained.
In this problem, there are a total of four independent dimen-sionless parameters as there are seven variables with three independent dimensions (mass, length and time). Although only a finite number of independent dimensionless parameters exist, the set of all possible parameters which can be formed from any set of variables is very
large. Hence some care must be taken in choosing exactly the right
groups to ensure that the determined relation is meaningful and
logically consistent. Stmcebrprth tnrumn -pioefstA fsIuowaa to
determine the relation of the height of the Rayleigh jet to the fluid properties of surface tension and viscosity, these two properties
were grouped into the separate parameters, p V
/
(the WeberNumber, We) and p V0 R/st (the Reynolds Number, Re). As Hobbs
and Osheroff (1967) have already determined that the height is is sensitive to the pool depth, the third parameter was chosen to
functional relation which was determined was,
H/D
=F(R/D, p V
02R/
,
pVR/n
)
(IV-2)
Figure IV-1 is a plot of H/D vs the Weber number (pV 2R/t)
for four different values of R/D. This figure indicates that H/D for water is proportional to the Weber number for all pool depths tested with the exception of a discontinuity between te low and
high Weber-number lines. The discontinuity marks the p&int where
the head of the jet pinches off into a separate drop which rises higher than the jet body since the drop has a smaller mass and
carries the same momentum as the jet. Unfortunately as extensive
data was obtained only for water and not for the other liquids, which have different surface tensions, viscosities,.and densities,
Figure IV-3 merely indicates that H/D is proportional to v 2, as
a change in the Weber number also implies a change in the Reynolds
number, which is proportional to V0. Nevertheless, Figure IV-1
does indicate that if the jet height is proportional to WeaReb,
2a + b must equal 2, because We is proportional to V0 while Re
is proportional to V0.
It should be noted that the exact dependence of H/D on the Reynolds number could be obtained from a Figure IV-1 type plot if
extensive data for the other five liquids had been obtained. In
this case, H/D would be plotted versus the Weber number at a constant
R/D. Then the Reynolds numbers for the six liquids would be
calcu-lated at a constant Weber number and plotted versus H/D. After
several such curves were obtained at various Weber numbers, the dependence of H/D on the Reynolds number would be found.
An initial inspection of the limited data for the five liquids other than water indicates that H/D increases as the Reynolds
number increases, as the data points in Figure IV-1 for the low viscosity liquids (water, ethanol, and toluene) are well above the data points for the high viscosity liquids (olive oil and glycerin). This result is consistent with the basic physics of the splashing process, as to a first order approximation, the viscous force on a
moving body in an incompressible fluid is given by F = -by, where
b is some geometrically-determined constant which depends on the
viscosity, and v is the velocity of the body. Integrating the dynamical equation, one obtains an exponential decrease in velocity with increasing viscosity as follows:
F = d
- -b
(IV-3)
dv - b dt
v
m
v = v0
ebt/m
Thus since the rebound velocity of the jet decreases exponentially with the viscosity, the maximum jet height---which should depend
on the rebound velocity---should Increase as the viscosity decreases,
or as the Reynolds number (pV0R/tL) increases.
Figure IV-2 displays the dependence of the jet height on the
Reynolds number for various values of R/D. This figure also 0.
demonstrates that the jet height is approximately proportional to
V02 as the slopes of the curves for water are approximately two.
The dependence of the jet jeight on the Weber number can be detirmined from this figure by plotting H/D versus the Weber numbers for the six
.10
D
100
200
300
Ve ,
pv.fl/l
Figure IV-1 Jet Height Versus the Weber Number
44(4
t j . . 14- ,-- ---. -.-" e-.- ---.- -...-- .-4 -- --T " ---*-''- -. 2 - -- --- ,4 - g-I:--.. ----.- I-NC.,-- --- 71-- .- --- 1--4--.- ,-1-7 -- i- .- ., -... 4 -4 -- -.-J- --H- l- 1.T .. 4-_-- -s-a t- -. " 1 E . ---- .--- -- =-7 1 ---4. - -- - - - - - 1-z-- -4 -- - - n -e - .-.--- a -- -+-- ] - ---- - -5- - - - -- -- - - -"- - p-.-- - - . -e- 3.- .- -a - -"- - - - - -a - N -- , - 1 - - - ---- ' - - --- - - - - --- -It---- -- 4-T " --- -- --- -- .,a . _. 4. . " - - "- - - -" - - - -- - - --- - -+ - - - -- -- --- - - - a ,-.. . -.--- - -"-"" ---e '-" ---e- 4-- ----4 -" -y -"-e -+- --- J- -. - j- V - I - . .-- -I "---DO6Bi
(DO4- 44 -r --L---I_-. ,-; t I - I T -4-1 -j mm: in rn n rri-n-rmr --- -: : s
ihzf--tIz-1-
--- ----tI t -, A t-- ij Ii+:
, --- -- ....- _-4 44n
-4441:
I2 i tzj C-1 C+ C+ IM t-1:4L -qi1t 41: It 1'-4I21
T41 T-Z :4 -i-i--A
.-Ii
41 u 4 Q -4 4-7-q I~ :U 1 1L l 4-4 7-; 4 ~ 122.Itpb47tttjlt: 4W4-7DJ
-~j~-~Th
,~ 5~j.[Itt-fl-LJiLUttJt4t-t4t
4~j~Ljj
Li 4mm uiLIttl 4 I 14.142:1 1' itt HI i2I4IiThTh&2i211 LU 3 FL~II E 31tsV 7s
a
-I
P]P E3I 4f-420F-T -;.-, t: I I , .t I+ I -- .1 1 T .1 ,.I4 I I --' I ,-L1 F .,179;I17 ,t f 1 ; I-.-,-i--:Iw:4 j2t 4-4i;j~
-I-1~iijjf~
_ _ ]~ 4 t 4 t~ IF
ri
---itl-U'
0 0 0 4- 41 41t1111 it 12 '<JIlL 41 Will Ii U [U [liii Ij~1
IT Ii 7k-u-, 14411 4 4] i-f~ i-uIf Id
I1- T-jl4-; 4-4 4-17- -4 t i-;J j- -4-I-JA 47127fl
1 V Hi I -T -' -Tt+417, Li52 7 Vr -T --, IT144-.. - I--1: 41Ft
4
-i91
1:2
2
44-1.d
-
--4144
I-ti 14I H. I I ' --TI TIHIMIIIJ 1MIFl
Fli
EL
U 1 I-' ILL-1.1
fl
4t
4 --:t-----El
I
Ip
-qmu
JIPI ~.7o8
t:T --A-l--4-T- ,,-- -' r 1-f
-- -L I---,-y ---, 4 L .2H rn~ 3 .4 4 4 jrS~r~rj174 ' [4 --- -{ -. -7.-4-5-7 '--- --- ---L- -- T-A 2z -U-- t- ---1,-- .t- -- gr
--- -- -y-t- -4--7 t1L --- ----d -- . -- -,.- -4. A g- 4.. 4 -T,. _ . --7--t -j--H- J-4--4 4'4 -:t-:-L -t8-i
.+ --1 t4. --- . -E4 -1- - ----1---7- -_-
--w I 11 1--
I
H4L -1-M 4 -7 -t-t 1 ; 44 i j j. F4+ 77 .4 -4 11 i- A 1i41-
1 t
t1
77
1 -4 _!j7_ lill]' A IT I-11 I T7 16M' -t-i4A-L +.,' I F-f 1-1 n I --P -4 --4- -- I-- --s -Z- -4 4- 4 -, , 4 -m L .1 1 1 i 1. , , -L .911LL- I Ar I ,1771 71 4!.LL6W-t
--Iliquids other than water indicate that H/D is higher for the lower
surface tension liquids (toluene,. ethanol) than for the higher surface tension liquids (water, mercury), Figure IV-2 suggests
that the jet height increases as the Weber number increases. This
result is consistent with the physical feeling that the jet uhould
go higher when less energy is wasted as surface energy. It should
be noted that although these results appear to be inconsistent with
Hobbs and Osheroff's finding (1967) that the jet rises higher in dyed water---surface tension of 72.75 dyne/cm ---than in a
milk-water solution---surface tension of 65.07 dyne/cm, they may not
be as these authors failed to take in account the fact that the
milk-water solution has a higher viscosity than the dyed-water solution has.
Figure IV-3 shows the dependence of the water jet height on R/D at the four largest values of the Weber and Reynolds numbers. The dashed lines in this figure are merely intended as a visual aid and are not meant to imply anything about the shape of the curves. Nevertheless, it is evident that the parameter H/D increases from approximately zaro, to a maximum at R/Da .17, before decreasing
at higher values of R/D. This result is consistent with Macklin
and Hobbs' findings (1969) for dyed water, which they explained by
the way the jet crater hit the bottom of the tank. Further explanation
of this phenomena is given in the Introduction.
Thus, the jet-height-to-pool-depth-ratio increases as the Weber
(eV02
/v)
and Reynolds (pVR/uv) numbers increase and as theparameter R/D approaches .17 for water.
It should be noted that
15
to
DA
.1l
21- ii--i 1, 1 14- -ti T fl i I I !- - I i 'l- r i 1 II! : . ---.2
.3
A9
-i
B
.5
11
.
I
.i
Figure IV-3 Jet-Height Dependence on the Pool Depth for Water
m
. - 7. 7 1-, -- -- - n - --. T -r I-.- T m T .T - -T74 1 -- T T - n i i n - T--7 I r . , 1 i 4 -- - - i I ---- -j -r- -_-- -I--F " " -1- 1 7- -1 t -- 1 -i -, r I t - -6 m - 1 - Tr n -7 r 1 T' 1 11 1 - -T I - -~~~ T 1 - T - -r "-1m-,r1eir1 T -?-.I -T- -1 1THT - r-r-, , I---i'-I -r I-r- T - I i-T I - I- -- 1 7 1 - - - -~ ~~ ~~~T1
1 - - T - rO 1 - T - 1 - 1 T - T -II T p1,T T .I j f -I I -.T I .fp11. r 7r - -1 -r r I,-w - -n -n 7 T I -I- T - I -I - - -I - -I r - -- - I I ' i - 7 1 - - - T --7 -T T T' - T 1 7 1 T-r-r-- T - -I -r -- r I- --I----I .7 ! -1 - - -7n 1- n . tr -_ -7-1r 1I T- I rT T -7 J I I I- I . - I I - - tt I .-T Ii T 1 - - -- T -r , r -T - 1 - - 11 -4 . . - 1 -T .I .. ,4 -7 - - --.-- 1-- --1 --1 - - - r r I T1- - -- r r - r- r - 1 -1 - i --T - - - - -- - - -- , - I I - . 7T - -7 T 1 '-1 "- i - 1 -I T ,I-?-I1I I I -. 1 iI -1 1 1 1 -r- - H - t 1 1 -7 1T -f I 1 1, 7 1n r - -1.- - -, -- - -1; 1 1 - 7 - 1 T -- - + - -j--1 -.- fox, -_ I -- . I -- - -71-T T- r 7 r 7 -T- -- r I T -.-. 1-7 -- T -,r , i -1 .-'---1 r1' -- r -1 -1 -16 1 - - 1- 1 - -r I I I T t - T- 1'-I -f I I- IT - - - I- --I-, I , -! ! 1 1. - - I - - v T - 7 r 1r i r ' , -I- -r 7 -7r 1 1l -- t n 1 .r le--i -1 - -r-- T I r - - + - -t n r -1-Tr r - 1 T - r ' 7 T tg~ - r --- - - r - -1 -d r tr -'. n 1 -1- -T I - -t- r se -7717 rh - , 1 - - - r T rT I I -- i T --rr -5 1 d f , fr -I-- T-- r r - - 7 -1rT r - 1 T- f ---1 6~~~~~~~ -T -I-- -n-- m- -- rarr-- r--T'C
in
the
splash, as Hobbs and Kezweeny (1966) have shown that the
number of spray droplets is directly proportional to the maximum jet
height. It should also be mentioned that the small container used
for the mercury splashes may have restricted the formation of a mercury jet, due to the damping effect of this container on the
splash forces.
CHAPTER V
CONCLUSIONS
1. The present data for the splashing process suggest that the
jet-height-to-pool-depth ratio is correlated by the
droplet-size-to-pool-depth-ratio, the Weber number (PV 0 R/b), and the
Reynolds number (p VR/).
2. The
jet-height-to-pool-depth
ratio increases as the liquidviscosity and surface tension decrease. In other words, the
relative jet height increases as the drop-fall-energy loss
due to viscous and surface-energy dissipation decreases.
3. For water, the jet-height-to-pool-depth ratio approaches a
maximum at a droplet-size-to-pool-depth ratio of approximately .17. This maximum in the jet-height-to-pool-depth ratio is independent of the impact velocity of the drop.
4. The jet-height-to-pool-depth ratio is proportional to approxi-mately the square of the impact velocity of the drop.
5.
The crown disintegration increases with theCHAPTER VI
RECOMMENDATIONS
1. More data should be obtained for the splashing of liquids other
than water so that the relation between the jet height and the liquid properties can be better determined.
2. The splashing of a drop of one liquid onto a pool of another
liquid should be investigated. This information should better
define the physics of the splashing phenomena.
3. The effect of liquid properties on the
jet-height-to-pool-depth-ratio maximum with respect to the droplet-size-to-pool-depth
ratio should be investigated. A theoretical study of the crater
APPENDIX A
CALCULATION OF DATA
h = height of fall, cm
H = observed height of Rayleigh jet, cm
D = depth of pool, cm
R - radius of drop, cn
V0 - impact speed, cm
p
= density of fluid, gm/cc- surface tension, dynes/cm
7t1- viscosity, poise
Re - Reynolds number, pVR/
We = Weber number, p V 2R/%
I. Water - - 72.05 dyne/cm
fl
- 1.053 x 10⁻² poise - 1.000 gm/ccR - .15 cm h H D H/D R/D We Re
2.6
.23
.9
.25
L17.
10.61
1.02 x
10
2.6
.25
.9
.28
.17
10.61
1.02 x 10³
2.6
.27
.9
.30
.17
10.61
1.02 x 10³
2.6
.28
.5
.55
.30
10.61
1.02 x
103
2.6
.31
.5
.61
.30
10.61
1.02
x
103
5.3
.40
.9
.44
.17
21.63
1.45 x
103
5.3
.43
.9
.48
.17
21.63
1.45
x
103
5.3
.48
.5
.96
.30
21.63
1.45
x
103
5.3
.50
.5
1.00
.30
21.63
1.45 x
103
10.0
.80
.9
.89
.17
40.80
2.00 x
103
10.0
.81
.9
.90
.17
4080
2.00 x 10³
10.0
.60
.5
11200
.30
40.80
2.00 x 10³
10.0
.62
.5
1.24
.30
40.80
2.00 x 10³
15.0
1.47
2.5
.59
.06
61.21
2.44
x
103
15.0
1.50
2.5
.60
.06
61.21
2.44
x
103
15.0
1.55
1.5
1.03
.10
61.21
2.44 x 10³
h H D H/D R/D We Re
15.0
1.60
1.5
1.08
.10
61.21
2.44
x
103
15.0
1.60
..9
1.78
.17
61.21
2.44
x
10
315.0
1.65
.9
1.83
.17
61.21
2.44
x
103
15.0
.80
.5
1.60
.30
61.21
2.44
x103
15.0
.83
.5
1.65
.30
61.21
2.44
x
103
20.0
1.63
2.5
.65
.06
81.61
2.82
x
103
20.0
1.70
2.5
.68
.06
81.61
2.82
x
103
20.0
1.70
1.5
1.13
.10
81.61
2.82
x
103
20.0
1.80
1.5
1.20
.10
81.61
2.82
x
103
20.0 2.00 .9 2.22 .17 81.61 2.82 x 10320.0
2.01
.9
2.23
.17
81.61
2.82
x
103
20.0
1.00
.5
2.00
.30
81.61
2.82
x
103
20.0
1.03
.5
2.06
.30
81.61
2.82
x
103
30.0
3.52
2.5
1.41
.06
122.4
3.54
x
1o3
30.0
3.55
2.5
1.42
.06
122.4
3.54
x
103
30.0
3.50
1.5
2.33
.10
122.4
3.54
x
10
330.0
3.55
1.5
2.37
.10
122.4
3.54
x
10
330.0
5.10
.9
5.67
.17
122.4
3.54
x
103
30.0
5.15
.9
5.72
.17
122.4
3.54
x
103
30.0
1.42
.5
2.84
.30
122.4
3.54
x
103
30.0
1.45
.5
2.90
.30
122.4
3.54
x
103
50.0
4.67
2.5
1.87
.06
204.0
4.46
x
103
50.0
4.70
2.5
1.88
.06
204.0
4.46
x
103
50.0
4.65
1.5
3.10
.10
204.0
4.46
x
103
50.0
4.70
1.5
3.13
.10
204.0
4.46
x
103
50.0
6.90
.9
7.67
.17
204.0
4.46
x
103
50.0
7.00
.9
7.78
.17
204.0
4.46
x
103
50.0
2.00
.5
4.oo
.30
204.0
4.46
x103
50.0
2.05
.5
4.10
.30
204.0
4.46
x
103
75.0
6.27
2.5
2.51
.06
306.0
5.46
x
103
75.0
6.30
2.5
2.52
.06
306.0
5.46
x
103
75.0
6.27
1.5
4.18
.10
306.0
5.46
x
103
75.0
6.30
1.5
4.20
.10
306.0
5.46
x
103
75.0
9.35
99
10.39
.17
306.0
5.46
x
103
75.0
9.40
.9
10.44
.17
306.0
5.46
x
10'
h
H
D
H/D
R/D
75.0
75.0
100.0
100.0
100.0
10090
100.0
100.0100.0
100.0
3.00
3.05
7.45
7.50
7.47
7.50
11.96
12.00
3.95
4.00
.5
.5
2.5
2.5
1.5
1.5
,9
.9
.5
.5
6.00
6.io
2.98
3.00
4.98
5.00
13.29
13.33
7.90
8.00
.30
.30
.06
.06
.10
*10
.17
.17
.30
.30
II. Toluene - 'a-.
Pm-28,5 dynes/cm
.88 g/cc
as =.590 x 10poise
-.15
cm
h H D H/D R/D We 10.010.0
23.0
23.0
23.0
23.0
1.101.05
2.20
2.30
1.90
2.00
III. Glycerin-.9
e9
.9
.9
.5
.5
gO
w
1.22
1.17
2.44
2.56
3.80
4.00
.17
17
.17
.A7
.30
s30
-63.4 dynes/cm
-1.26 gm/cc
90.78
90.78
208.8
208.8
208.8
208.8
'7?
B
3.13
3.13
4.74
4.74
4.74
4.74
- 1490 x -.15 cm
x103
x 103 x10
3x 103
x103
x103
-2
10
poise
4 h H D H/D R/D.9
.5
We
.56
.17
584.3
.70
.30
584.3
Re
5.62
5.62
IV. Ethanol -
'a-
pa--22.7 dynes/cm
.90 gm/cc
n2
a-R -h H D H/D R/D We1.20 x 102poise
.05 cm
Re
.9
1.11
.056
38.85
525.0
We
Re
306.0
306.0
408.0
408.0
408.0
408.0
408.0
408.0
408.0
408.0
5.46
5.46
6.29
6.29
6.29
6.29
6.29
6.29
6.29
6.29
Re
100.0 100.0.50
.35
r
LO.O1.4
0
x103
x103
x103
x103
x103
x 103
x 103
x 103 x 103 x 103 P dMEIMPERMNEMh
10.0
10.0
20.0
20.0
20.0
H
1.1
.5
4.0
1.0
1.1
V.
Olive oil -h 100.0 100.0D
H/D
.9
1.22.5
1.00
.9
4.44
.5
2.0
.5 2.2e
H.40
.22 VI. Mercury --= =.9
.5
R/D
.056
.10
.s056
.10
.10
41.5 dyne/cm
.918
gm/cc
H/D
R/D
.444
.17
.440
.30
-476
dyne/cm
=13.546
ge/ce
dmw-m.Re
.525.
525.
742.
742.
742.
--Mmds9t
=1.534 x 10~
poise
h
=40 cm
It should be noted that whenever two values of the det height are listed for a given pool depth, the numbers correspond to the maximum and minimum heights observed. Generally, five to ten
experiments were performed at each pool depth. M-Mmor
We
38.85
38.85
77.71
77.71
77.71
91R-We
650.3
650.3
84.0 x 10²poise
.15
cm
Re
72.5
72.5
1. Chapman, David S. and Critchlow, P.R., "Formation of Vortex Rings
from Falling Drops," Journal of Fluid Mechanics, Vol. 2_2, PP
177-185(1967).
2. Edgerton, H.E. and Killian, J.R. Jr., Flash, Charles T. Branford,
Boston (1954).
3. Engel, 0.G., "Crater Depth in Fluid Impacts," Journal of Applied
Phydics, Vol. JZ
tPP 1798-1808 (1966).
4. Engel, 0.G., "Initial Pressure, Initial Flow Velocity, and the
Time Dependence of Crater Depth in Fluid Impacts," Journal of
AppliedPhysics, Bol..
89,
pp
3935-3940
(1967).
5.
Gregory, P.H., et al, "Experiments on Splash Dispersal of FungusSpores, "Journal of General Microbiology, Vol. 20, pp 328-354
(1959).
6. Harlww, Francis H. ard Shannon, John P., "The Splash of a Liquid
Drop," Journal of Applied
Phyiscs, Vol. A,
pp
3855-3866
(1967).
7. Harlow, Francis H. and Shannon, John P., "Distortion of a
Splash-ing Liquid Drop," Science, Vol. 152, pp 547-550 (1967).
8. Hobbs, P. V. and Kesweeny, A.J., "Splabhing of a Water Drop,"
Science, Vol.
U,
pp 1112-1114 (1966).
9.
Hobbs, P.V. and Osheroff, T., "Splashing of DropS on ShallowLiquids," Science, Vol.
]_g,
pp 1184-1186 (19670).
10. Hodgin, C. Reed, "Downward Jets in Liquid Drop Splashes,"
Project Report, Strobe Project Lab, MIT, Cambridge, Mass.,
(1975)9
11. Lamb, H., Hydrodynamics, Dover, New York, (1945).
12. Liddell, H.F. and Wootten, N.W., "the Detection and Measurement of Water Droplets," Quart JournalRoy. Soc. of Meteorology, Vol.
ft,
pp 263-266 (1957).
13. Macklin, W.C. and Hobbs, P. V., "Subsurface Phenomena and the
Splashing of Dross on Shallow Liquids," Science, Vol.
16,
pp 107-108 (19695.
14. Maxwell, W.i11 C., "Splashing of Drops on Shallow Liquids,"
Indian Journal of Physics, Vol. 18, pp 306-310 (1944).
17. Siscoe, G.L. and Levin, Z., "Water-Drop-Surface-Wave Interaction
actions," Journal of Geophysical Research, Vol.
76,
pp5112-5116 (1944).
18. Van de Sande, E. et al, "Energy Transfer and Cavity Formation
in Liquid-Drop Collisions," Journal of Applied Physics, Vol. 45,
pp 748-753 (1974).
19. Worthington, A.M. and Cole, .. , "Impact with a Liquid Surface,
Studied by the Aid of Instantaneous Photography," Phil. Trans.
Roy. Soc. London Ser. A, Vol. 189, pp 137 (1891); ibid, Vol.
pp 175 (1900).
20. Worthington, A.M., A Study of Splashes, Longmans, Green and Co.,