HAL Id: hal-00326737
https://hal.archives-ouvertes.fr/hal-00326737
Submitted on 5 Oct 2008
HAL is a multi-disciplinary open access archive for the deposit and dissemination of sci-entific research documents, whether they are pub-lished or not. The documents may come from teaching and research institutions in France or abroad, or from public or private research centers.
L’archive ouverte pluridisciplinaire HAL, est destinée au dépôt et à la diffusion de documents scientifiques de niveau recherche, publiés ou non, émanant des établissements d’enseignement et de recherche français ou étrangers, des laboratoires publics ou privés.
Lorentz microscopy mapping during magnetization
process of L10 FePd thin films
Aurélien Masseboeuf, Christophe Gatel, Alain Marty, Jean-Christophe
Toussaint, Pascale Bayle-Guillemaud
To cite this version:
Aurélien Masseboeuf, Christophe Gatel, Alain Marty, Jean-Christophe Toussaint, Pascale Bayle-Guillemaud. Lorentz microscopy mapping during magnetization process of L10 FePd thin films. Journal of Physics: Conference Series, IOP Publishing, 2008, 126, pp.012055. �10.1088/1742-6596/126/1/012055�. �hal-00326737�
Lorentz microscopy mapping during magnetization
process of L10
FePd thin films
Aur´elien Masseboeuf1
, Christophe Gatel1,?, Alain Marty2
, Jean-Christophe Toussaint3 and Pascale Bayle-Guillemaud1 1,2DRFMC/SP2M, Cea Grenoble, 17 rue des Martyrs, 38054 Grenoble Cedex 09, FR 1
Laboratoire d’´Etudes des Mat´eriaux et des Microscopies Avanc´ees
2
Nanostructures et Magn´etisme
3
Institut N´EEL, CNRS & Universit´e Joseph Fourier, Grenoble, FR
?New ad. : CEMES-CNRS, BP 94347, 29 rue Jeanne Marvig, 31055 Toulouse Cedex
E-mail: [email protected]
Abstract. Lorentz Transmission Electron Microscopy (LTEM) allows the observation of magnetization evolution in thin magnetic layers. Electron Microscopy which enables observation at a nanometric scale is sensitive to magnetic induction perpendicular to the beam. Here we show that this technique allows the magnetization process in thin layers having perpendicular magnetic anisotropy to be studied. LTEM has been carried out on a JEOL 3010 and a FEI Titan 300kV (equipped with a Lorentz Lens). We determine how the magnetization is distributed along the domain walls (where the magnetization is in plane). Hence we could observe the evolution of a domain configuration during the magnetization process versus the orientation of its boundaries. This study is based on phase reconstruction methods and is completed by Lorentz image simulations.
1. Introduction
Lorentz microscopy is a complementary technique to interferometric methods such as hologra-phy which needs samples designed to allow the passage of a reference beam and provide limited fields of view. Over the past ten years, with the appearance of non-interferometric phase re-trieval methods and of dedicated Lorentz lens, the ”classical” Lorentz microscopy has started to become a powerful tool for the study of magnetic materials and their behaviors during in-situ magnetization process. Moreover, in developing new systems for recording media or magnetic logic devices, two kinds of materials are proposed there with in-plane and out-of-plane magnetic anisotropy. Here, Foucault and Fresnel methods were used in order to investigate configurations with out-of-plane magnetization domains. In our study we describe how Lorentz Microscopy is suitable to investigate configurations with such geometry. This approach has been developed on thin layers of FePd obtained by epitaxial growth. These alloys, when chemically ordered, exhibit a strong perpendicular anisotropy leading to an out-of-plane domain configuration.
Two types of contrast may be obtained in Lorentz microscopy [1]: Fresnel contrast showing domain walls and Foucault contrasts showing the domains. Fresnel contrast arises from different Lorentz deflections in two in-plane magnetic domains separated by a magnetic domain wall. An out-of-focus (over-focus or under-focus) image shows bright lines where the two deflected
beams are overlaping (convergent wall) and dark lines where beams are deflected away from the magnetic domain wall (divergent wall). In Foucault contrast, using in-focus conditions, the different deflections of electrons can be selected in the back-focal plane of the objective lens by introducing an aperture. Hence some orientations of the magnetization can be selected giving rise to a bright contrast (bright field) in corresponding domains. All other magnetic domains appear as dark areas. As an extension of these two contrast modes, Lorentz microscopy offers the opportunity of mapping the magnetic induction distribution. On one hand, focal series allow phase retrieval by the resolution of the Transport of Intensity Equation (TIE) [2] . On the other hand, an analysis of the deflections due to the local magnetic configuration can be made on a modified STEM detector [3] or, by virtue of the reciprocity principle [4], by scanning of the back-focal plane with the aperture in Foucault imaging mode [5]. This latter technique is called Differential Phase Contrast (DPC) imaging.
2. Experiment
The samples were grown on MgO (001) substrates by Molecular Beam Epitaxy (MBE) according to the following sequence : a thin Fe layer (2 ML) was first deposited in order to initiate epitaxial growth on the substrate. Then a 16 nm chemically disordered FePd2 layer was codeposited as a
magnetic layer having a vanishing anisotropy. A FePd ordered (L10) alloy layer (37nm) with a
strong perpendicular anisotropy was then added. The film was covered by a 1.5 nm Pt capping to prevent oxydation. The structural study and magnetic properties of this alloy can be found elsewhere [6]. Previous LTEM observations have been made on these kind of layers [7] but tilting the sample was needed to reveal the domain structure. Here we will show that we could reveal the in-plane magnetization occuring in the domain walls. Samples for electron microscopy were prepared using a classical approach : mechanical polishing and ion milling. All the observations presented here have been made on plan-view samples. Two microscopes were used for this
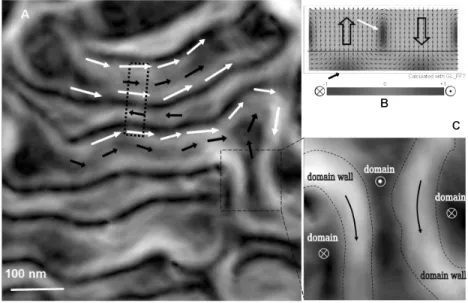
Figure 1: A. Modulus (calculated with the X and Y component as√X2+ Y2) from the focal series
mapping of FePd/FePd2 alloy in remanent state. Domain walls are indicated with white arrows,
magnetization under the domain’s position is emphazised with black arrows. B. Micromagnetic simulation of the alloy. The third component of induction is represent in greyscale drawn under the simulation. C. Zoomed image of the area shown in A. Domain walls and domains are highlighted on the picture
study: a JEOL 3010 (for magnetization study) and a FEI TITAN equiped with a Lorentz lens (for precise magnetization configuration determination) both working at 300 kV and equipped with a GATAN Imaging filter. Micromagnetic simulations have been made with GL FFT [8]. The in-situ magnetization has been carried out using the objective lens, which is not the imaging lens in LTEM mode. It has been calibrated using a dedicated Hall probe system inserted in the column.
3. Results
First of all we have mapped the magnetization distribution (Fig.1A, for a convenient view we show here only the modulus of magnetic induction and we draw the direction of induction with arrows on the picture) using a phase retrieval process via the TIE resolution. Two kinds of areas with in-plane magnetization are observed : ”Magnetic tubes” which are running all around the sample are the domain walls (marked with white arrows). They are well imaged in Fresnel contrast by a couple of dark-bright lines. Other areas were the magnetization is in-plane (around the domains walls) correspond to the domains. The deflection do not occur within the domain but in the soft layer where a flux closure is parallel to the domain walls (marked with small black arrows).
These in-plane components are visible on the cross-section of the micromagnetic simulation (Fig 1B). They are represented in grey scale (highligted by the same arrows as in Fig 1A), perpendicular to the paper plane. The dark bands (Fig1A) correspond to a vanishing in-plane magnetization. They take place between domain walls and antiparallel in-plane ”soft layer domain”. This mapping issued from phase retrieval gives simulated Fresnel contrast similar to
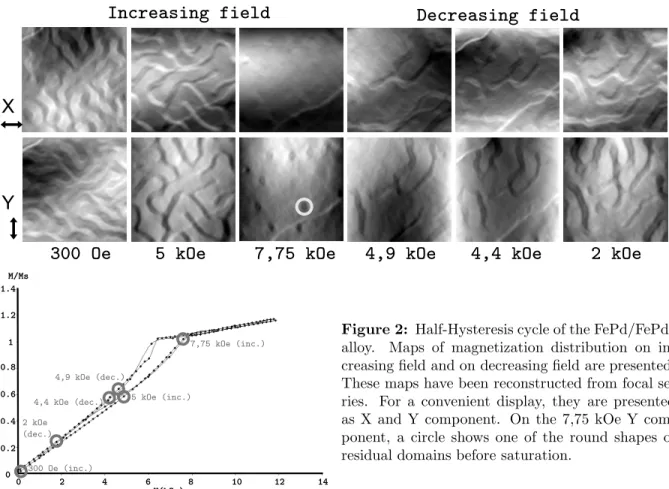
Figure 2: Half-Hysteresis cycle of the FePd/FePd2
alloy. Maps of magnetization distribution on in-creasing field and on dein-creasing field are presented. These maps have been reconstructed from focal se-ries. For a convenient display, they are presented as X and Y component. On the 7,75 kOe Y com-ponent, a circle shows one of the round shapes of residual domains before saturation.
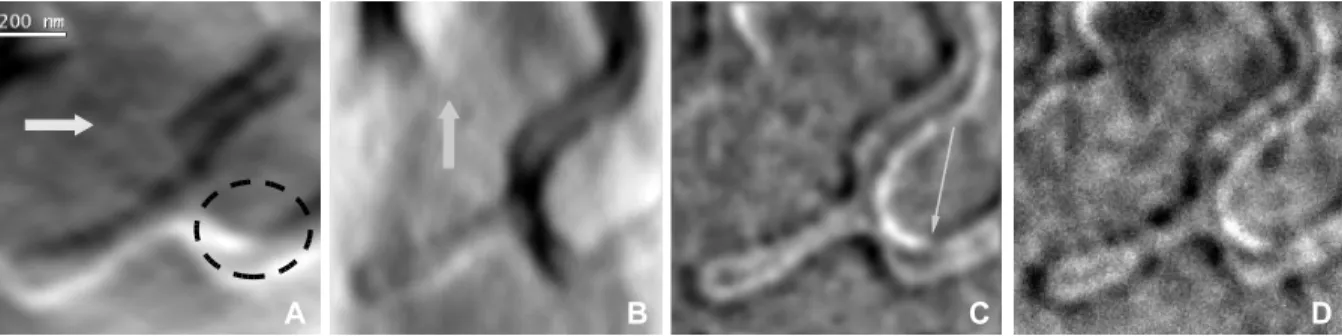
Figure 3: Detail from the results shown in Fig. 2 (decreasing field, 4,4kOe). The A and B images are the components of the induction, as indicated by the white arrows (black is minus and white is plus). The area inside the dashed circle in A shows a singularity in the domain wall. C is the simulated Fresnel over-focus contrat and D is the experimental Fresnel contrast.
experimental ones (not displayed here). For clarity, we show a zoom of the area (Fig 1C) were the in-plane component under the domains vanishes and were we can represent on the picture only the out-of-plane configuration.
We have performed an in-situ perpendicular magnetization until saturation (increasing field) and back to the remanent state (decreasing field). Figure 2 shows different magnetic configurations corresponding to the applied field marked with dots in the half hysteresis loop. During magnetization, up domains occupy larger areas at the expense of down domains. Just before the saturation (7,75 kOe), the down domains remain with a round shape. In decreasing field, the reversal is sudden (4,9 kOe). The down domains exhibit an elongated shape. Then these domains enlarge until occupy the same area for up and down magnetized areas. The accurate observation of the domain walls configuration allows precise information on the magnetization process. In figure 3 discontinuities appear along the domain walls (in the dashed area) which can be interpreted in terms of Neel lines. The domain wall is not running all around the domain uniformly but with a discontinuity. The direction of magnetization abruptly changes by 180◦
along the wall. This forms what could be called in a 2D system a tail-to-tail or head-to-head wall, but in this 1D case, the discontinuity has to be seen as a vortex. This variation of direction in the domain wall can also be seen on the Fresnel image, but is more easily seen in the simulation (shown by the arrow on C).
4. Conclusion
We have demonstrated that Lorentz Microscopy can be a powerful tool to investigate magnetization configuration and also a useful technique for in-situ imaging of magnetization processes. We have shown that it is possible to observe structure in the domain walls and to detect some defects in these 1D structures. The technique opens the opportunity to link the position of these magnetic structures to the mechanisms of magnetic reversal and domain wall propagation.
References
[1] Chapman J 1984 Journal of Physics D : Applied Physics 17 623–647 [2] Paganin D and Nugent K 1998 Physical review letters 80 2586–2589
[3] Chapman J N, Ploessl R and Donnet D M 1992 Ultramicroscopy 47 331–338 [4] Cowley J 1969 Applied Physics Letters 15 58–59
[5] Daykin A and Petford-Long A 1995 Ultramicroscopy 58 365–380
[6] Gehanno V, Marty A, Gilles B et al. 1997 Physical Review B 55 12552–12555
[7] Aitchison P, Chapman J, Gehanno V et al. 2001 Journal of Magnetism and Magnetic Materials 223 138–146 [8] Toussaint J C, Marty A, Vukadinovic N et al. 2002 Computational Materials Science 24 175–180
![[PDF] Formation pour Debuter sous photofiltre 6 | Formation informatique](data:image/gif;base64,R0lGODlhAQABAIAAAP///wAAACH5BAEAAAAALAAAAAABAAEAAAICRAEAOw==)