HAL Id: hal-00811511
https://hal.archives-ouvertes.fr/hal-00811511
Submitted on 10 Apr 2013
HAL is a multi-disciplinary open access
archive for the deposit and dissemination of
sci-entific research documents, whether they are
pub-lished or not. The documents may come from
teaching and research institutions in France or
abroad, or from public or private research centers.
L’archive ouverte pluridisciplinaire HAL, est
destinée au dépôt et à la diffusion de documents
scientifiques de niveau recherche, publiés ou non,
émanant des établissements d’enseignement et de
recherche français ou étrangers, des laboratoires
publics ou privés.
Global distribution of cloud top phase from
POLDER/ADEOS I
Jérôme Riédi, Marie Doutriaux-Boucher, Philippe Goloub, Pierre Couvert
To cite this version:
Jérôme Riédi, Marie Doutriaux-Boucher, Philippe Goloub, Pierre Couvert. Global distribution of
cloud top phase from POLDER/ADEOS I. Geophysical Research Letters, American Geophysical
Union, 2000, 27 (12), pp.1707-1710. �10.1029/1999GL010921�. �hal-00811511�
GEOPHYSICAL RESEARCH LETTERS, VOL. 27, NO. 12, PAGES 1707-1710, JUNE 15, 2000
Global distribution of cloud top phase from
POLDER/ADEOS
I.
J. Riedi, M. Doutriaux-Boucher, P. Goloub
Laboratoire d'Optique Atmosph6rique, Universit6 des Sciences et Technologies de Lille, France P. Couvert
Laboratoire des Sciences du Climat et de l'Environnement, Gif-sur-Yvette, France
Abstract. The eight months of data acquired by the POLDER instrument have now been processed. This dataset provides daily information on the global distribution of cloud top phase. We present here the results of a statistical anal- ysis of ice and liquid phase occurrence frequencies at the global scale. Temporal variation of these frequencies above land and ocean are analyzed. These results are compared with ISCCP data and the consistency of the POLDER phase product is demonstrated.
formed in the upper cloud layer. Around 80% of the single scattered radiation reflected from the cloud layer arises from the top 100 m of the layer. Calculations have shown that the polarized component, Lp, is saturated for cloud optical depth greater than 2.0. The important quantity for deter- mining cloud phase is the polarized radiance Lp, that is less
sensitive
than the total radiance
x L to multiple scattering
effects. Thus, the polarization features, which correspond to single scattering, are preserved in Lp.
Introduction
Clouds are well known to be crucial modulators of the
Earth radiation budget. Their properties (cloud cover, op-
tical thickness, altitude, phase, water vapor, microphysical properties) and their variations in space and time, need to be understood if we aim to predict climate change. The
POLDER (POLarization and Directionality of the Earth
Reflectances) instrument has proven capabilities in deriving key information needed to improve our knowledge of cloud, radiation and climate interactions. Particularly, the poten- tial of polarization measurements of the upward shortwave
radiation to derive cloud information has been demonstrated
by both airborne and spaceborne
data analysis [Br•on and
Goloub, 1998]. From November 1996 to the end of June
1997, the satellite version of POLDER provided polariza- tion measurements at the global scale. Thanks to its large field of view, a same location on the surface can be viewed from up to 14 directions. Cloud observations over a large range of scattering angles make possible the distinction be- tween spherical and non spherical particles, in other words, between liquid and ice phase. At first, we will briefly discuss the principle of the cloud phase detection algorithm, and de- scribe the POLDER phase product used in our studies. In a second part, we will expose the results of these analyses, which provide information on zonal and seasonal variation of cloud top phase. POLDER data are then compared with ISCCP data from the D1 dataset. In a last part, the results will be discussed and the quality of POLDER phase product investigated.
Method
According
to both theory and observations
[Chepfer et
al., 1998], [Goloub et al., 1999], the polarization features
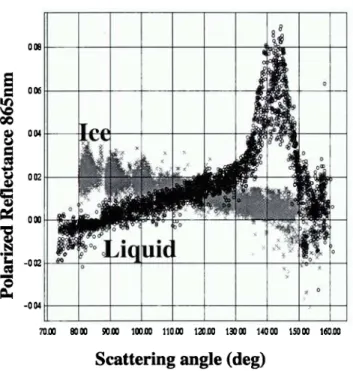
of clouds depend strongly on the particle shape. Within the range of scattering angles that can be observed by POLDER, clouds composed of liquid spherical particles, present a strong maximum about 140 ø from the incoming
direction (primary rainbow). Also, a zero of polarization
(neutral point) around 90 ø, and supernumary
bows for an-
gles greater than 145 ø , make possible the distinction with ice crystals clouds, which show an essentially positive po-
larization, decreasing
as the scattering
angle increases
(Fig-
ure 1). Discrimination between ice crystals and liquid water droplets is made using these differences. In this way, the cloud top phase detection may be considered as a cloud par- ticles shape detection, even if cirrus clouds are unlikely to be composed of spherical ice crystals. A complete description
of the algorithm principle has been given by [Parol et al.,
1999] and [Goloub
et al., (submitted
to J. Geophys.
Res., )
1999].
The data used in our present studies are the level 2 POLDER phase product, at the resolution of about 60km x 60km which corresponds to a zone of 9x9 full resolution POLDER pixels. All frequencies are calculated using cloudy pixels for which phase has been retrieved successfully. This criteria rejects 14% of the cloudy pixels. Pixels with mixed
phase (14%) have also been rejected from the analysis. At
this resolution level, they correspond to pixels containing separate ice and liquid clouds, and are not representative of multilayered clouds nor mixed phase single cloud. Hence, the sum of liquid and ice occurrence frequencies is always equal to 1. The next section presents the analysis of eight months of POLDER phase data.
Considering a cloudy system observed from satelIite, the polarized component of the upward radiance is mainly Copyright 2000 by the American Geophysical Union.
Paper number 1999GL010921.
0094-8276/00/1999GL010921505.00
•Also, the polarization degree, defined as the ratio of Lp over L, is subject to multiple scattering effects since it depends on L.
1708 RIEDI ET AL' CLOUD TOP PHASE FROM POLDER/ADEOS I o.o• 0.04 0.O2
0.00
-0.O2 -0.04 70.00 80.00 •.00 100.00 110.00 120.00 130.00 140.00 150.00 160.00Scattering angle (deg)
Figure 1. Polarized reflectances observed by POLDER over liquid (black) and ice (grey) clouds at 865 nm.
Occurrence frequencies of liquid and ice
phase
Only results for ice clouds are presented in this paper. They will be compared with ISCCP high clouds amounts in the next section. The comparisons are limited to the -1- 60ølatitude zone, due to difficulties in cloud detection over snow covered surfaces, using visible/near infrared ra- diometers. Figure 2 shows the occurrence frequencies of ice clouds obtained for the period of November 1996 to June 1997. As expected, the maximum occurrence of ice phase corresponds to the InterTropical Convergence Zone and its variation along the equator. Two minima occur in the trop-
ics at -1- 20ølatitudes. The maximum of occurrence in the
Northern hemisphere appears in February and the minimum during June, respectively associated with boreal winter and summer. Also, June is marked by a maximum of occurrence of ice phase in the Southern hemisphere.
60
J'V
•
-20
Table 1. Frequency
of occurrence
(in %) of liquid and ice
phase at global scale, over land, ocean, and both. Liquid Ice
Land Ocean Both Land Ocean Both Nov 60 75 71 40 25 29 Dec 59 75 71 41 25 29 Jan 60 76 72 40 24 28 Feb 61 73 70 39 27 30 Mar 55 74 69 45 26 31 Apr 57 72 68 43 28 32 May 64 73 70 36 27 30 Jun 68 72 71 32 28 29 Table 1 summarizes the results of statistics over land and
ocean separately. We can observe that the distribution be- tween ice and liquid clouds is rather constant at global scale, with about 30% of ice clouds versus 70% of liquid clouds. But if we look at repartition over land and ocean separately, we observe some differences between land and ocean, and also between the different months. At first, it should be noted that the ice phase is much more frequent over land than over ocean. It is also interesting to observe that liq- uid and ice phase frequencies of occurrence vary much more
over land than over ocean (13% over land, against only 4%
over ocean). This could be explained
by the fact that ocean
have a larger thermal capacity and that deep convection is easier to achieve over land. These variations are amplified in the Northern hemisphere over land, by the large variations of the atmosphere temperature, between local summer and
winter.
ISCCP data matching the POLDER operational period are not available at present time. Thus, we have considered
the ISCCP-D1 dataset ([Rossow
et al., 1996]) from April
1990 to March 1991 which have been analyzed and docu-
mented by [M. Doutriaux-Boucher
and G. S&ze,
1998].
ISCCP high clouds are classified as clouds with associated pressure lower than 440 hPa. In fact, cloud thermodynamic phase is much more governed by temperature than pressure level. Temperature differences as important as 30K may be found at a given pressure level for different latitudes ranging from 60øN to 60øS. As an example, a temperature of 240 K can be found in June at a pressure level of 410hPa at 50øN, but one have to go down to 310 hPa to observe the same
-60
•
Nov Dec
• Jan Feb Mar Apr May Jun •0
- • -,,•."_'---_:...• .... --:-.-,_..,. --', 20
<.'-"
";-•:-
-'- November
,•.?},.½-w_
_x,•-
-•
...
December '--i-2o
/•,.>: '"•. January 4.2"-•3., •' - o• February) 'i•
' .
"•'•
March
:-40
• ',
-
•Aril
½:2•;•_'-,Q .... , ay ' -60 •7-2'-"----.'>-_ "June 15 20 25 30 35 40 45 50 55 Frequency of occurenee (%)RIEDI ET AL.' CLOUD TOP PHASE FROM POLDER/ADEOS I
1709
temperature at the equator. Frequencies of occurrence for clouds above 310hPa and 440hPa, have been derived from ISCCP dataset. In order to select ISCCP high clouds which
were colder than 240K (threshold
recognized
by [Hutchison
et al, 1997]), we have used temperature profiles provided
with the POLDER dataset. For each latitude Lx, the pres- sure Px associated to 240K can be retrieved (see Figure 3). Then, the occurrence frequency Fx of "cold" clouds is de- rived from the occurrence frequencies of the two classes of
ISCCP high clouds(Fa10,F440),
and the previously
obtained
pressure, using a linear interpolation.
Figure 4 shows the comparisons of POLDER ice clouds with ISCCP "cold" clouds frequency of occurrence as a func- tion of latitude Clouds detection problems over snow cov- ered surfaces appear clearly in the POLDER results pole- ward of 60øN for April and May. Very high frequencies occur in this region during winter season, and the frequency falls down suddenly between April and May. In fact this period corresponds to a rapid decrease of snow covered surfaces.
Despite the different periods considered in our studies for POLDER and ISCCP data, the general features are
the same for the two datasets. Maxima and minima of oc-
currence appear at the same location except for December and February, for which the maxima along the equator are shifted. POLDER underestimates frequencies of occurrence in the Southern Hemisphere, particularly between 40øS and the Equator, whereas it tends to overestimate them in the Northern Hemisphere. Once again, the differences occur on the magnitude of the features, but not on the global latitudi- nal variations. May and June show a rather good agreement
however.
Four hypotheses may be advanced to account for these
differences between the two datasets. The first reason which
could explain these results is that we, unfortunately, have
not considered simultaneous ISCCP and POLDER data.
This analysis would have to be done again, as the ISCCP
data are made available.
The second one, is the different spatial resolution of in-
struments
used to acquire
data. According
to [Wylie, 1998],
both the sensitivity of the sensor and the size of its field of view, have an impact on the cloud amount retrieved using spaceborne radiometers. The bigger the FOV of the sen- sor is, the larger the total retrieved cloud amount. This is an advantage of the POLDER instrument upon ISCCP, but the spatial resolution of the sensor has also an impact on
the detection of small or thin clouds. The POLDER sen-
sor resolution is about 6 km against 2 km for the visible channels of radiometers used to produce the ISCCP cloud
Figure 3. Schematic principle of the method used to select
ISCCP "cold" clouds
November •'•.' 60 ISCCP-D 1 • 50 - POEDER i• 40 ; - --.. • 30 .-"• ' • -. = !0 March
•__.•.'
60 ISCCP-D
I
-o 50 ' ' •POLDER • 40 g 30 •" '"•- ßg.
20 ,,
-"
• 10• • 0 -60 -40 -20 0 20 40 60 Latitude December - ISCCP-DI .•_. • 50 - POI,DER'•20
- . ',•'.
= 10 -60 -40 -20 0 20 40 60 Latitude April•'•
60 I$CCP-DI
•50'- POLI)ER • 40 ' ' ' %. ".../"' '.:•
.•.
.
• , • 0 • 0 -60 -40 -•0 0 _90 40 •) -60 -40 -20 0 20 40 60 -•ntitud• L•titude January May• 60 •sccl,-Dl
• 60 IsccP-m
• 50 ' - 'POLDER • S0 - - -POLDER•40
'" - '
•40
',
g. 20 .... • 20 •.0 •-• 0-- -60 -40 -20 0 20 40 60 -60 -40 -•) 0 20 40 60 -Latitude Latitude February June•60
ISCCP-DI
• 60 . ISCCP-D1
• 50 '" POLDER • 50 ' ' POLDER • 40 •, 40 o 30 ' ' ' • 30?"<L
,: ' '•'
. •10• 2 ' •10 • 0 -,• 0 • -60 -40 -20 0 20 40 •) -60 -40 -20 0 20 40 60 ]mti/ude LatitudeFigure 4. Comparison between ISCCP "cold" clouds fraction (relative to total clouds fraction) and POLDER ice phase fre- quency of occurrence.
products. Preliminary comparisons performed against syn- optic weather reports have shown that the relatively low resolution of POLDER level 2 products, reduces by 10% the occurrence of ice clouds when compared with cloud phase analysis done at full resolution.
Concerning the detection of thin cirrus, ISCCP has the advantage of using thermal infrared channels which are more sensitive to that particular type of clouds than visible/near- infrared channels used by POLDER. This could account for the higher occurrence frequencies found by ISCCP in some region.
The last point to consider is the method used for produc- ing the two datasets. ISCCP cloud analysis uses both visible and infrared radiances in order to derive cloud pressure, op- tical thickness, temperature and cloud types. Our selection of "cold" clouds relies on pressure level and cloud tempera- ture criteria which do not ensure that we are looking at ice clouds only. POLDER cloud analysis is conducted, basically using only visible/near infrared radiances, but the phase
1710
RIEDI ET AL.: CLOUD TOP PHASE FROM POLDER/ADEOS I
retrieval algorithm is based on polarization measurements. This method does not require any assumption about cloud temperature or pressure, and lead to informations about mi- crophysical properties of the cloud which is thought to be more reliable for cloud thermodynamic phase analysis.
Conclusions
Cloud phase derived from near-infrared photopolarimet- ric measurements is a very innovating result. Compari- son with ISCCP-D1 dataset shows the global consistency of POLDER phase product, whenever the frequencies of oc- currence are not always of same magnitude, very probably
due to cloud detection weaknesses
of POLDER [Parol et
al., 1999]. The analysis
of the POLDER phase product is
also conducted using comparison against synoptic weather reports, radar and lidar measurements. At the same time, POLDER level i data are reanalyzed to produce a phase index at full resolution. Finally, this results will be used to improve and define new algorithms for cloud analysis, for the future instrument POLDER on ADEOS II, which will be launched on the end of year 2000.
Acknowledgments. The authors are very grateful to NASDA and CNES who provided the POLDER data. Spe- cial thanks are addressed to F. Hennequart who processed the
POLDER level2 data at LOA.
References
Br•on, F.M., and P. Goloub, Cloud droplet effective radius from spaceborne polarization measurements, Geophys. Res. Left., 25, 1879-1882, 1998.
Chepfer, H., G. Brogniez, and Y. Fouquart, Cirrus clouds micro- physical properties deduced from POLDER observations, J. of Quant. $pectr. and Rad. Transfer, 30, 375-390, 1998.
Doutriaux-Boucher, M., and G. S•ze, Significant changes between the ISCCP C and D cloud climatologies, Geophys. Res. Left.,
25, 4193-4196, 1998.
Goloub, P., J. Riedi, M. Doutriaux-Boucher, and P. Couvert, Cloud Thermodynamical Phase from POLDER/ADEOS. Pre- liminary results, In Proceedings of the ALPS99 International
Conference, WKœ-O-Od, 1999.
Hutchison, K. D., B. J. Etherton, P. C. Topping, and H. L. Huang, Cloud top phase determination from the fusion of signatures in daytime AVHRR imagery and HIRS data, /it Int. J. Remote Sensing, 18, 3245-3262, 1997.
Parol, F., J. C. Buriez, C. Vanbauce, P. Couvert, G. S•ze, P. Goloub, and S. Cheinet, First results of the POLDER
"Earth Radiation Budget and Clouds" operational algorithm. IEEE/Tran. Geosc. Rein. $ens., 1999.
Rossow, W. B., A. W. Walker, D. E. Beuschel, and M.D. Roiter, International Satellite Cloud Climatology Project (ISCCP), World Climate Research Programme (ISCU and WMO), Tech. Doc. WMO/TD 737, 115 pp., World Meteorol. Org., Geneva, Switzerland, [Available from ISCCP Global Proceessing Cen- ter, NASA GISS, 2880 Broadway, New York, NY 10025], 1996. Wylie, D. P., Cirrus and Weather: A satellite perspective, in
Cirrus, OSA Technical Diggest (Optical Society of America, Washington DC, 1998), 66-69, 1998.
M. Doutriaux-Boucher, P. Goloub, and J. Riedi, Laboratoire d'Optique Atmosph•rique, Universit• des Sciences et Technolo- gies de Lille, 59655 Villeneuve d'Ascq Cedex. France,
Phone: (33) 03 20 43 47 66, Fax: (33) 03 20 43 43 42, (e-mail: riedi@loaser.univ-lillel.fr; mdoutri@loaser.univ-lillel.fr; goloub@loaser. u niv-lille i .fr)
P. Couvert, Laboratoire des Sciences du Climat et de l'Environnement, C.E.A, 91191 Gif-sur-Yvette. France (e-mail: couvert@lsce.saclay. cea.fr)
(Received July 13, 1999; revised September 16, 1999; accepted November 8, 1999.)