Digital Help Service Opportunities For Communication Service
Providers in the Convergent Digital Home
by
Juan Spiniak
Ingeniero Civil Electricista,
Magister en Ciencias de la Ingenieria,
Pontificia Universidad Cat6lica de Chile, 2004
MASSACHUSMTS INSTITUTE OF TECHNOLOGY
JUL 20 2011
LIBRARIES
ARCI-rVES
Submitted to the Systems Design and Management Program in Partial
Fulfillment of the Requirements for the Degree of Master of Science in
Engineering and Management
at the
Massachusetts Institute of Technology
October 2010
© 2010 Juan Spiniak. All rights reserved.
The author hereby grants to MIT permission to reproduce and to distribute publicly paper and electronic copies of this thesis document in whole or in part in any
medium now known or hereafter created.
Signature of Author
nSpi System Design and Management Program
n
*'r>\
jOctober2010
In__-
/,
Michael A M Davies, Sr. Lecturer, Engineering Systems Division Thesis Supervisor
Accepted
by
Patrick Hale Director, System Design and Management Program Certified
Digital Help Service Opportunities For Communication Service
Providers in the Convergent Digital Home
by
Juan Spiniak
Submitted to the Systems Design and Management Program in Partial Fulfillment of the Requirements for the Degree of Master of Science in Engineering and
Management
Abstract:
Homes are becoming increasingly connected as new technologies allow users to access media and information from any-device at anytime. Notebooks, HDTVs, smartphones, media servers, photo cameras, and video cameras, all form part of
this new digital ecosystem where -the vision says - information and content will
flow easily across devices, enabled by simple and intuitive user interfaces.
These new home technologies are, however, often too complex for most users. Only "digital-natives" or technology savvy groups have the necessary skills, knowledge or confidence to adopt them and to use them effectively. For the rest, trying them becomes painful and frustrating. Moreover, the ecosystem itself adds confusion, given the large number of players involved and the many different kinds of
relationships. Unless a dominant player gains enough power to establish a dominant digital home architecture, or this happens in some other way, most companies will continue to innovate around device-specific features that don't address the overall complexity of the complete systems that users have to work with.
Digital help services can assist users by simplifying the selection, installation, learning and troubleshooting of new services and devices; facilitating the adoption of new convergent technologies. There is a broad range of potential services, including, for example, 'over the top' (OTT) television integration, smartphone mentoring services, WiFi network configuration and desktop support services. Communication service providers should pay close attention to digital help services as an opportunity to differentiate their offer, strengthen their relationship with end-customers, reduce customer support costs and simplify the adoption of bandwidth-intensive technologies. Moreover, digital help services can speed up the adoption of OTT television services, and companies can use them strategically. The technology help space is evolving and communication service providers need to figure out how they want to participate: offer help services themselves; partner or acquire a existing technology support company; and/or create an open marketplace for technology help services.
Thesis Supervisor: Michael A M Davies
Acknowledgements
My time at MIT has been an enriching experience and I would like to use this
opportunity to extend my gratitude to everyone that made it possible, particularly those who helped me with this Thesis.
To all of the interviewees, for their time and insights on this subject. Your comments were crucial and guided me through the different perspectives on technology help services.
To Senior Lecturer Michael A M Davies, my Thesis Advisor, for guiding me through insightful ideas and comments. I honestly appreciate all the time and energy you put into this project. It has been great working with you.
To Pat Hale and the SDM staff, for making SDM such a great program. The friendly
SDM staff has always made me feel at home.
To my classmates and friends at MIT and Boston, for making this an unforgettable experience. I've been fortunate to meet wonderful people from diverse
backgrounds. I am confident I will carry your friendship throughout my life.
To my parents, for their unconditional support and love. Your help has been crucial in every new challenge I've undertaken.
Finally, to my fiance Rosario, for her incredible courage and blind belief in our relationship, even though we were living more than eight thousand kilometers
apart. Her love and support - over the phone - fueled every project I was involved
Table of Contents
A CK N O W LED G EM EN T S ... ... -... 5 TA B LE O F CO N T EN T S... ... ... 7 1 IN T R O D U CT IO N ... 11 1.1 CONTEXT...11 1.2 H YPOTHESIS...111.3 M ETHODS AND TOOLS...12
1.4 SOURCES...13
2 COMMUNICATIONS SERVICE PROVIDERS INDUSTRY ... 15
2.1 INTRODUCTION... 15
2.2 TELECOM M UNICATIONS SERVICE INDUSTRY...15
2.3 COM M UNICATION SERVICE PROVIDERS THREATS... 17
2.3.1 Telephony ... 18
2.3.2 Internet...20
2.3.3 Television...21
2.4 RELATIONSHIP W ITH THE CUSTOMER ... 23
3 DIGITAL HOME TECHNOLOGIES... 25
3.1 INTRODUCTION...25
3.2 D IGITAL H OM E TECHNOLOGIES... 25
3.3 REQUIRED TECHNOLOGY CAPABILITIES... 29
3.3.1 H igh B andw idth...30
3.3.2 Reliable W iFi Coverage ... 30
3.3.3 Topology discovery, management and media sharing standards...31
3.3.4 Secure Digital Rights Management standards... 32
3.3.5 Integ rated user-interfaces...33
3.4 EXAM PLES OF CURRENT POSSIBILITIES... 3 4 3.5 TECHNOLOGY COM PLEXITY HYPOTHESIS ... 3 7 4 STAKEHOLDERS AND ECOSYSTEM EVOLUTION...39
4.1 INTRODUCTION...39
4.2 STAKEHOLDER A NALYSIS...39
4.2.1 Retail Stores...41
4.2.2 Telco/M SO /Satellite service providers... 41
4.2.3 Consum er electronics...42
4.2.4 Internet Content Sites...42
4.2.5 Techiefriend neighbor ... 42
4.2.6 H ousehold stakeholders...43
4.3 ECOSYSTEM EVOLUTION ... 43
4.3.1 Stakeholder relationships ... 43
4.3.2 H elp services stakeholders... 44
4.4 ECOSYSTEM DYNAMICS -AVOID ING SYSTEM COMPLEXITY ... 45
4.4.1 Innovation around the product... 46
4.4.2 Innovation around the system ... 47
4.4.4 Overall system ... 49
5 DIGITAL HELP SERVICES VALUE PROPOSITION... 51
5.1 INTRODUCTION...-... .... 51
5.2 D IGITAL H ELP SERVICES VALUE PROPOSITION ... 51
5.3 D IGITAL HELP SERVICE OPTIONS... 52
5.3.1 Select ... 53
5.3.2 Install ... 53
5.3.3 Learn ... 54
5.3.4 Use...54
5.4 STAKEHOLDERS AND SERVICE OPTIONS... 55
6 D EM A N D O PPO R T U N ITY ... 57
6.1 INTRODUCTION...57
6.2 DEMAND TO GO BEYOND CURRENT HELP SERVICES ... 57
6.2.1 Friend/relative support m odel ... 57
6.2.2 Communication service provides support services ... 57
6.2.3 H ardw are vendors w arranty services ... 58
6.3 D EM AND PAIN POINTS...58
6.3.1 To reduce frustration...59
6.3.2 To reduce the inability to do critical tasks... 59
6.3.3 To reduce the skills or tim e required ... 60
6.3.4 To reduce the gap between existing support services ... 60
6.4 M ARKET SEGM ENTATION...61
6.5 D EMAND SIZE ... 64
6.5.1 M arket sizing ... 64
6.5.2 W illingnesss-to pay ... 67
6.6 A NALOGY W ITH AUTOM OTIVE INDUSTRY... 70
7 OPPORTUNITY FOR COMMUNICATIONS SERVICE PROVIDERS...73
7.1 INTRODUCTION...---...----.73
7.2 BENEFITS... ... -73
7.3 RISKS... 75
7.4 ECONOM ICS...76
7.4.1 Full custom er A RPU ... 77
7.4.2 InternetA RPU increase...78
7.4.3 Custom er support savings ... 79
7.4.4 Churn/loyalty ... ... ... ... 80
7.4.5 D isrupting TV services...81
7.4.6 Overall econom ic value ... 81
8 V A LU E-CA PT U R ED ... 83
8.1 INTRODUCTION...83
8.2 VALUE CAPTURE ... 83
8.3 D IGITAL H ELP SERVICES EFFECTS... 85
9 CONCLUSIONS AND RECOMMENDATIONS... 89
9.1 INTRODUCTION...---...--89
9.2 D IGITAL H ELP SERVICES CONCLUSIONS ... 89
9.2.1 The dig ital hom e w ill rem ain com plex... 89
9.2.2 Frustration and confusion are clear pain-points... 90
9.2.4 Digital Help services could increase technology use and adoption ... 90
9.2.5 Service providers can benefit from some digital help services ... 91
9.3 DIGITAL HELP SERVICES UNCERTAINTIES ... 91
9.3.1 Dominant architecture...92
9.3.2 W illingness to payfor help ... 92
9.3.3 Ability to offer good and reliable help services... 92
9.3.4 Direct Payoff to Communication Service Providers... 93
9.4 CASES FOR DIGITAL HELP SERVICES...93
9.5 RECOMMENDATIONS ... 94
9.5.1 Short-tem recommendations...95
9.5.2 Strategic recommendations...95
10 REFERENCES ... 97
List of Figures
FIGURE 1: DIGITAL HELP SERVICES HYPOTHESIS DECOMPOSITION... 12FIGURE 2: US HOUSEHOLD TECHNOLOGY ADOPTION, 2009 - 20013 [2]... 16
FIGURE 3: 2009 US HOUSEHOLD COMMUNICATIONS SERVICES PROVIDER'S NETWORKS PER CUSTOMER TYPE [2]....17
FIGURE 4: AVERAGE HOUSEHOLD EXPENSES IN COMMUNICATION SERVICES [2]... 17
FIGURE 5: US TELEPHONY CONSUMER EXPENDITURES FROM 1980 TO 2007. DATA FROM TRENDS IN TELEPHONY SERVICE REPORT, FCC, 2008 [3] ... 18
FIGURE 6: RELATIVE WIRELINE TELEPHONY MARKET SIZE FOR US, UK AND SPAIN...19
FIGURE 7: COMPARISON OF INTERNET PRICES FOR SELECTED OECD COUNTRIES USING PURCHASING POWER PARITY PR ICES. ... 2 0 FIGURE 8: SURVEY ASKING US HOUSEHOLDS ABOUT THEIR ONLINE INTERNET PATTERNS [2]. ... 22
FIGURE 9: GROWTH OF US CABLE AND BROADBAND CONNECTIONS VERSUS PURE BROADBAND CONNECTIONS[15]...23
FIGURE 10: WEEKLY TIME SPENT BY THE DIFFERENT DEMOGRAPHICS ON THE DIFFERENT DEVICES AND CONTENT SOU RCES. [1 7] ... 2 6 FIGURE 11: EXTENDED VISION FOR CONVERGENT HOME TECHNOLOGIES...26
FIGURE 12: HOME NETWORKING STANDARDS [23][25][26]... 31
FIGURE 13: DLNA DEVICES TYPES AND MEDIA SHARING POSSIBILITIES... 32
FIGURE 14: TIVo SOLUTION...34
FIGURE 15: MICROSOFT MEDIA CENTER SOLUTION...35
FIGURE 16: APPLE SOLUTION...36
FIGURE 17: CONTENT -DEVICE-SOURCE DIAGRAM...40
FIGURE 18: DIGITAL HOME STAKEHOLDERS DIAGRAM...41
FIGURE 19: OPTIONS FOR "HELP-SERVICES" STAKEHOLDERS... 44
FIGURE 20: INNOVATION AROUND THE PRODUCT AND INNOVATION AROUND THE SYSTEM CAUSAL LOOPS...46
FIGURE 21: Too COMPLEX FOR ME CAUSAL LOOP. ... 48
FIGURE 22: COMPLETE CAUSAL LOOP DIAGRAM ... 49
FIGURE 23: OPM DIAGRAM EXPLAINING THE "DIGITAL HELP SERVICES" CONCEPT. ... 52
FIGURE 24: GENERAL PRODUCT LIFECYCLE AND SERVICE NEEDS... 52
FIGURE 25: DIGITAL HELP OPTIONS FOR STAKEHOLDERS BASED ON THEIR CAPABILITIES. ... 56
FIGURE 26: OPM DECOMPOSITION OF DIGITAL HELP SERVICES NEEDS AND INTENTS... 59
FIGURE 27: MARKET SEGMENTATION BASED ON POTENTIAL CUSTOMER CHARACTERISTICS ... 61
FIGURE 28: TECHNOLOGY ATTITUDE GROUPS IN THE UK BASED ON PRIVATE MARKET RESEARCH. ... 65
FIGURE 29: HOW TO SOLVE COMPUTER PROBLEMS - CMO SURVEY RESULTS ... 67
FIGURE 30: ECONOMIC VALUE ESTIMATION DIAGRAM [47]. ... 68
FIGURE 31: W ILLINGNESS-TO-PAY FOR COMPUTER SUPPORT - CM O SURVEY RESULTS... 69
FIGURE 33: DIGITAL HELP SERVICES RISKS FOR COMMUNICATION SERVICE PROVIDERS...75
FIGURE 34: DIGITAL HELP SERVICE ARPU IMPLICATIONS... 76
FIGURE 35: COMCAST'S REVENUE AND COST-STRUCTURE REVENUE. ... 77
FIGURE 36: COMCAST'S "FULL CUSTOMER" ARPIU AND COST STRUCTURE... 78
FIGURE 37: PRICE VS SPEED FOR COMCAST AND VERIZON...79
FIGURE 38: US VALUE CAPTURED DIAGRAM (REVENUES FLOW)... 84
List of Tables
TABLE 1: EXTENDED THREE-SCREEN VISION BOTTLENECKS ... 30TABLE 2: MARKET SEGMENTATION FOR DIGITAL HELP SERVICES. ... 62
TABLE 3: PROS AND CONS OF THREE CUSTOMER SEGMENTS... 63
TABLE 4: ATTITUDE GROUPS MAPPED TO ATTRIBUTE GROUPS ... 65
TABLE 5: CUSTOMER SERVICE ECONOMICS...80
T ABLE 6 : CH URN ECONOM ICS ... 8 1 TABLE 7: STAKEHOLDERS AND LONG-TERM EFFECTS OF WIDESPREAD ADOPTION OF DIGITAL HELP SERVICES...86
1 Introduction
1.1 Context
This Thesis sits at the intersections of three arenas undergoing rapid innovation: communication services; home technologies; and users' ability to interact with technology. Each one of them is going through major transformations.
Communications services are evolving very rapidly, enabling new opportunities and threats. The exponential growth of bandwidth is creating new convergent services that are erasing the old boundaries amongst telephony, Internet and video services. Meanwhile, communications service providers face significant threats as their role in the value chain changes. Telephony revenues are declining; Internet prices remain constant despite the huge investments needed to upgrade networks; and video services face new competition by third-party Internet streaming services. The new digital home is becoming increasingly connected through devices and services such as IP-connected HDTVs, media servers, smartphones, tablets, Wifi
routers, smart-meters, etc. In the future -the vision says - any media and
information will be available simultaneously on any-device at anytime. Early adopters, especially technology-savvy users, appreciate these new opportunities. However, opportunities enabled by higher bandwidth and new connected-devices are limited to a small number of users that have the necessary skills, knowledge and confidence to use new technologies. All too often, trying to adopt new technologies becomes a painful experience, in particular for those who are not "digital-natives". Overall, there is a need for simple and easy-to-use technologies in the home. There are only two ways in which this vision can become reality: either the technology itself becomes simpler, or the technology retains some complexity and "is simplified" to users through help services. This Thesis explores the second case. 1.2 Hypothesis
This thesis explores the hypothesis that there is a significant opportunity for communications service providers through providing these simplification services. Digital help services can simplify convergent home technologies for mainstream users in developed markets. Communication service providers can offer digital help services to their users and benefit from the market opportunity.
- Who? Communication services providers, mainly Telco's and Cable operators.
- What? Digital Help Services, assist users with new technologies and devices.
- Why? Simplify technology adoption and use to mainstream users, which can
lead to several strategic benefits for communication service providers.
This thesis explores the key factors that determine the validity of the main
hypothesis, together with the conditions needed to support it. Figure 1 decomposes the main hypothesis into several questions that are addressed by specific chapters. Each one of them is analyzed in terms of the current state and the evolution path.
Thesis Chaptr:
Why Communication Service Providers care?
Are home technologies really too complex?
Does the ecosystem influence complexity and confusion?
How could digital help services change this?
Is there a demand? Who, why and how big?
What are the benefits for communication service
providers?
Who benefits and looses in the industry? Communications Service Provider Industry Digital Home Technologies Stakeholders and ecosystem evolution
Digital Help Services Value Proposition Demand opportunity Opportunity for communication service porviders Value captured
Figure 1: Digital help services hypothesis decomposition
1.3 Methods and tools
This Thesis relies heavily on "system thinking" tools and methods, which are based on a holistic view of systems, their stakeholders and interactions.
C 0 -C - U -) Digital Help ... -. Services Hypothesis - 0 - o
System dynamics, specifically causal loop diagrams, are used to model the ecosystem evolution and the conditions needed to reduce the overall complexity users face given the incentives to innovate.
OPM (Object Process Methodology) diagrams are used to present digital help services as a system addressing a specific need through a particular form. Additionally, OPM diagrams are used to decompose the need for digital help services.
Stakeholder analyses are used to understand how different players affect, directly or indirectly, the adoption and use of home technologies. Additionally, industry
ecosystem diagrams, technology standards diagrams and industry revenue-flow diagrams are used to discuss the key dynamics and incentives.
Finally, a simple economic model estimates the impact of digital help services in communication service provider's revenues and profits.
Primary research was based on interviews to leading experts. Secondary research was based on industry reports, articles and academic papers.
1.4 Sources
As primary research, the author interviewed several industry experts and company executives to obtain a comprehensive understanding of digital help services, the ecosystem and the opportunities. The interviewees include executives form service providers, leading technology retail companies and technology support companies. Most of them from the US and European markets.
Additionally, the author did some anecdotal market research to understand users experiences and frustrations regarding their interactions with technology.
As secondary research, this thesis is based on industry reports, industry articles and some academic paper. Finally, the author's personal experience working for a communication service provider was used as a source of anecdotal evidence.
2 Communications Service Providers Industry
2.1 Introduction
This chapter describes the current state of the communications industry from the service provider perspective to explain the need to rethink their strategies and revamp the nature of their relationship with customers.
First, an overall description of telecommunications industry describes its main products and trends. Then, the major threats for Voice, Internet and TV services are presented. Finally, the threats implications on the relationship with customers are
described.
2.2 Telecommunications service industry
Even though definitions have become less clear, the term communication service providers (CSPs) refers to companies that offer information transportation
"services" to residential customers, small companies or corporations; typically using their own network infrastructure. The term encompasses companies in the
Telecom, Cable, Internet, Wireless and Satellite industry.
Traditionally, service providers have been classified based on network assets and regulatory frameworks. Telco's refers to traditional telephony companies. MSO (multisystem operator) refers to cable or satellite TV service providers. However, these distinctions have become increasingly meaningless as most players offer
convergent services: telephony, video/TV, Internet and value-added services. During the last 30 years the telecommunications industry has undergone several significant transformations. During the 80s most markets de-regulated their state-own Telco's and, in the US, AT&T was divided into several smaller regional
companies. Then, during the 90s many Telco's and cable operators added Internet capabilities to their networks to offer dial-up connections and broadband services. As a result, cable operators began competing with Telco's through bundled services.
During the 2000's companies continue to upgrade their networks and the triple-play concept emerged: an integrated offer of TV, Internet and wireline telephony
services. While some Telco's added IPTV capabilities to their existing networks, other chose to partner with satellite TV or deploy FTTH technologies (such as Verizon's FiOS network) to compete in the triple-play market.
Meanwhile, during the last 20 years the industry has witnessed how mobile telephony has exploded. Traditional telephony revenues have moved to wireless services as users prefer mobile services to landlines residential telephony. Currently, the communications service provider industry is a multi-billion dollar industry with its leading companies among the largest companies in almost every country. For example, in the US there are five companies with revenues above $20 billion a year (AT&T, Verizon, Sprint-Nextel, Comcast and Direct TV), with aggregate
revenues of approximately $320 billion and an aggregate market capitalization of approximately $324B [1].
Together with Northern Europe and some Asian countries, the US market is one of the most developed communications markets in the industrialized world. A Forrester report [2] indicates there are 92.7 million US internet-connected households by 2010 (77%), 90% of them with broadband connections. By 2009,
81% of households had subscription-TV services (cable - 48%, satellite TV - 25%,
Telco TV - 4%) and 32% had HD service, despite approximately 57% already owned
an HDTV. Triple-play services account only for 30% of the US households, probably reflecting specific US industry dynamics (AT&T and Verizon serve about 45% of wireline phones).
1 -1 Forecast: US Household Technology Adoption, 2009 To 2013' 140
- Tota *iUS households
120 4 100 itre 80 HT 40 20 205 20 o~z200 08 00 01 202 21 113.1 114.3 115.5 116.7 117.7 118.7 119.8 120.9 121.9 123.0 AlUShu od2 80.7 83.2 86.4 87.6 90.1 92.3 94.3 96.2 98.0 99.7 74.9 77.4 81.5 84.2 880 90.5 92.7 94.6 9&4 98.1 31.9 40.9 55.7 65.5 74.1 79.8 84.1 87.6 90.1 92.5 6.1 13.1 26.3 36.9 46.8 57.8 67.8 76.1 82.6 85.4 9.8 18.0 21.2 25.8 32.4 393 462 52.5 58.2 62.9 Home network 7.3 11.7 17.4 25.0 28.2 30.9 33.6 36.2 38.6 40.8 VR Base: UShueod
9-2 Young Singles And Couples Eschew Phone Company Services
Figure 3: 2009 US Household communications services provider's networks per customer type [2].
Figure 4: Average Household Expenses in communication services [2].
2.3 Communication Service Providers Threats
Currently, even though many communication service providers remain large and profitable, their products and value propositions face threats that will require new strategies to maintain a strong competitive position and drive growth. A significant part of the value has moved from traditional fixed operators (Telco and Cable) to mobile operators, which still enjoy relatively high growth rates and reasonable
margins. Putting the mobile market aside, the challenges for fixed service providers vary depending on the specifics of their customer base, product portfolio and
network assets. While traditional Telco's have seen declining telephony revenues
---ri
for several years, cable operators could face new challenges as over-the-top (OTT)' TV disrupts their business models. Moreover, markets with strong broadband competition have seen their margins decline while companies have had to continue to invest heavily to upgrade their network capacity.
2.3.1 Telephony
In most developed markets telephony revenues experienced strong growth over the last decades. For instance, the US consumer expenditures in fixed telephony more than tripled from 1980 to 2000.
Telephony Consumer Expenditures (US)
-+-Wireline Telephony -U-Wireless Telephony
$100,000 -$90,000 $80,000 $70,000 $60,000 " $50,000 A $40,000 $30,000 $20,000 -$10,000 -$1 , 0so- - - - - --- --- - -1980 1985 1990 1995 2000 2005
Figure 5: US Telephony Consumer Expenditures from 1980 to 2007. Data from Trends in telephony
service report, FCC, 2008 [3]
However, as Figure 5 shows, aggregate consumer expenditures in telephony peaked in 2000 and have declined ever since. Simultaneously, wireless telephony grew from almost zero to surpass wireline telephony by 2007 (in the US).
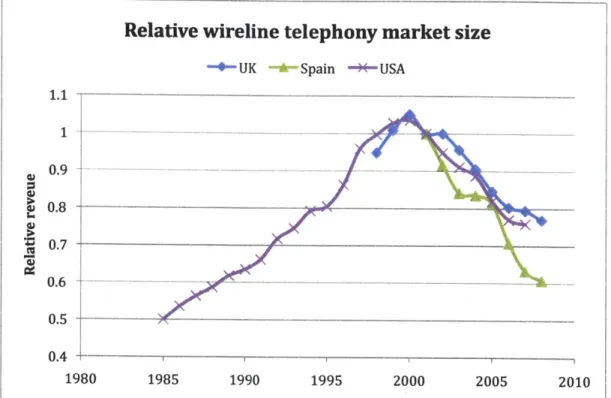
Since approximately year 2000, wireline telephony revenues have been declining in most of the developed world. Figure 6 shows the relative wireline telephony
market size for the US (based on consumer expenditures), the UK and Spain (based on fixed call revenues). To compare their evolution trends, annual revenues where divided by 2001 aggregate revenues for each country. Clearly, all three markets reduced their size since 2000, confirming the global trend. Data obtained from market reports [3] [4] [5].
1 Over-the-top TV refers to TV content streamed over the Internet, typically not
Relative wireline telephony market size
-- UK Spain --)*USA 1.1~ - -__- _-_ _---0.9 0.8 0.7 0.6 0.5 0.4 1980 1985 1990 1995 2000 2005 2010Figure 6: Relative wireline telephony market size for US, UK and Spain.
Several reasons explain wireline telephony decline depending on the local market condition, regulation and the competitive environment. Some of them are presented below.
* Market saturation. In many developed markets, such as the US, landline penetration has reached very high levels reducing the ability to sustain high growth rates (Landline penetration in the US was above 90% since 1970 and has been declining since 2000 [6]).
* Mobile phone market A significant portion of the wireline calls and revenues have been substituted by mobile telephony services. Mobility and features-rich phones, together with similar prices-per-minute are motivating users to prefer mobile phones to landline phones. By 2006 there were about 20 million households in the US that had wireless-only phone services [6].
* New competition. Traditional telephony operators have faced increasing
competition from new players, such as VoIP low cost providers and cable companies, disrupting their once near-monopolistic markets. Even though the US telephony market is still dominated by the traditional players (AT&T and Verizon serve 45% of homes. Cable operators 13% and VOIP less 2%
[2]), competition and low cost providers have pushed prices down causing market commoditization.
- Additional substitute products. Currently, users have several alternative ways to communicate, including emails, SMS and chat; reducing the relative
importance of the traditional telephony.
Even though traditional telephony companies have tried to slow down the market decline, both through regulatory fights and new product offerings, wireline
telephony will continue to decline in size and it will no longer be the main source of revenues for most traditional telecommunication service providers.
2.3.2 Internet
While wireline telephony decline is evident, Internet services evolution is less clear. Broadband penetration has faced strong revenue growth during the last decade, but in most countries competitive pressure has meant that unit prices in terms of
$/Mbps have declined very fast while households ARPU (Average Revenue per Unit) has remain relatively stable. However, Internet Service Providers (ISPs) have
invested heavily to upgrade the networks to provide higher bandwidths, even though many continue to struggle to differentiate (especially in very competitive markets).
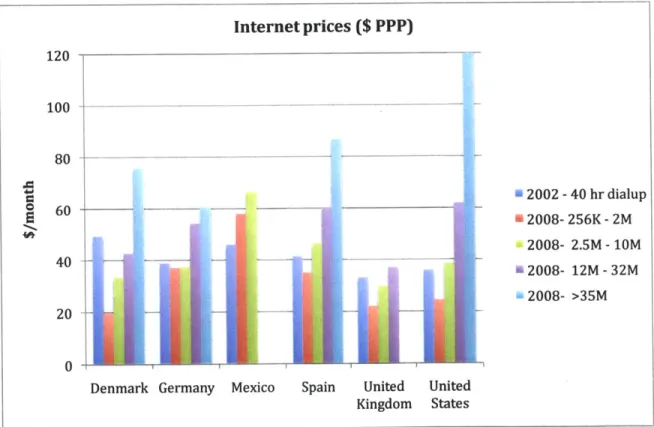
Figure 7: Comparison of Internet prices for selected OECD countries using purchasing power parity prices.
Figure 7 compares Internet prices for US, UK, Spain, Germany, Denmark and Mexico
using $ PPP (purchasing power parity). For each country, the cost of using a 2002
broadband speeds (Low: 256 Kbps - 2 Mbps, Medium: 2.5 Mbps - 10 Mbps, High:
12Mbps - 32 Mbps, Very High: More than 35 Mbps). Data obtained from OECD,
Communications Outlook reports 2002 [8] and 2009 [7].
As shown by Figure 7, prices for a 2002 Internet dialup connection are relatively comparable to 2008 medium/high broadband speeds. For instance, in the US 2002 dialup costs ($34/month) are similar to 2008 medium speeds ($38/month),
considering that the Internet ARPU is $32/month (based on [2]). This suggests that while Internet prices per Mbps have declined, household ARPU has remained relatively stable (same order of magnitude). Certainly, some markets have higher broadband penetration and average speeds, but generally ISPs have increased broadband speeds without necessarily increasing household ARPU.
Regardless of the massive investments to upgrade their networks (either to FTTx or
DOCSIS 3.0), they are facing challenges increasing their ARPUs:
* Dumb Pipe. As MIT professor David Clark and others suggested during 2010
MIT Communications Future Program Conference [9], many envision Internet services to become a "dumb pipe"; the only differentiation element will be the ability to move bits from A to B in a fast and reliable way. This scenario, together with market competition, would probably lead to price and margin decline. Certainly, it isn't necessarily a bad scenario if margins are maintained high either through limited competition or regulation, but the "dumb pipe" vision has motivated Internet service providers to look for new way to differentiate and sustain their relationship with the customer.
* Mobile Broadband. As mobile operators improve their 3G/4G coverage,
mobile broadband could disrupt traditional fixed broadband as users replace their household ISP for 3G USB connections. However, as Forrester said in
2008 report [10], mobile broadband will substitute Internet connection only
for ADSL late adopters given its technical limitations. Regardless of its ability to disrupt fixed Internet, mobile Internet has once again forced fixed Internet services providers to rethink their strategy and look for new differentiation elements.
2.3.3 Television
TV is the world's most relevant medium, generating more advertisement and subscription revenues than radio, music, newspaper or magazines. A typical US adult spends on average 28 hours a week watching TV. Even though the industry varies significantly depending on market conditions, everywhere TV remains as a
massive medium. While the US has a very high subscription-TV penetration, other markets are based on free broadcasting services (e.g., UK, Spain, Italy).
However, as new platforms - including IPTV, wireless networks and Internet
streaming-have emerged during the last years, the traditional TV service model is being disrupted in several key ways. On one hand, IPTV has enabled new players, such as traditional Telco's, to enter the TV market (for instance, Verizon launched
FIOS TV in 2005 [11] and AT&T launched U-Verse in 2006 [12]), integrating the TV
experience with other services (voice, interactivity, etc.). On the other hand, Internet's open architecture has separated content aggregation from content delivery. A new generation online video services that aggregates videos from third parties (Hulu, Vimeo, Amazon VOD, etc) are challenging the traditionally closed and vertically integrated value chain that has dominated subscription TV services. New Over-The-Top (OTT) video services delivered over any IP connection are gaining popularity especially among younger generations [16].
While there is an intense debate about the future of online TV services, the ability of OTT services to disrupt traditional TV, and which business models will succeed (subscriber paid or ad-based schemes); customers are already switching to OTT services to watch their favorite shows. More than 20% of young families/couples watch at least one full-length TV show on Internet sites [2]; and according to another report [14], this figure goes up to 82% for kids between 15 and 17 years. However, the same report indicates that, overall, only a very small fraction of the time is currently spent on online TV services.
Which of the following activities do you do online at least
monthly?
Pay to rent TV shows/movies online
Pay to download TV shows/ Older singles/couples
movies
moves
lde families Young families Watch full-length TV shows on
Internet sites Young singles/couples
STotal US Watch any kind of video on
the Internet
0% 10% 20% 30% 40% 50%
Figure 8: Survey asking US households about their online Internet patterns [2].
Subscription-TV companies need to define how to compete or integrate with OTT services. The TV-Anywhere approach consists in giving customers access to premium content online. However, its still unclear how the market is going to evolve. The worst-case scenario for subscription-TV providers would be that a
significant portions of their customers switch to OTT services, reducing their revenues and being cornered to the "dumb pipe" value proposition.
?%bof U.S. cord-cutting homes remains stable as cable & broadband homnes grow
Growth of Media Platforms
76 6. 3
61.6 c60
54-Fit Csbu e and
160 Broadband
40 Broadbanc-Yes
0
20
Jan-08 Jan-09 Jan -10
Figure 9: Growth of US cable and broadband connections versus pure broadband connections [15].
2.4 Relationship with the customer
Often, poor customer service has suggested that CSPs don't consider the
relationship with customers a key component of their strategy. Whether this is the result of an deliberate strategy or an unintended consequence of massive customer service complexities, the public often perceives that service providers rely on network assets, limited local competition or contracts to retain customers. Meanwhile, mainstream users often perceive service providers as the default "solutions provider" for any technology problem (probably that is why
approximately 30-40%2 of calls to their call centers are caused by issues not related their products). Put in another way, when users have a problem with web browsing on their computer, most of them call their Internet service provider instead of their hardware of software vendor.
The nature of the relationship between CSPs and their customers has two very distinctive elements.
- They have always provided "services" as part of a monthly billing
relationship. Even when they install devices (STB, router, etc.), they are
offered "as a service" per month; on the other hand, hardware and software retailers/vendors include some installation and support services, but the focus remains on the "product sale".
- They are the only player in the technology space that "goes to your home";
hardware companies don't, and retail players only go to install new systems (although a notable exception is Best Buy's Geek Squad, which it acquired as a complement to its retailing activities).
This in-home service relationship with customers can be strategic in the long run. A future in which CSPs are constrained to dumb-pipe Internet services will be
characterized by a minimal relationship with the customer and very few differentiation elements. In fact, even if regulation protects their margins, they would relate to customers similarly to the way electric and water utilities do.
3 Digital Home Technologies
3.1 Introduction
New home technologies allow users to interconnect home consumer electronics appliances to store and share content, and to access any type of media from any device at anytime. However, these technologies require specialized knowledge and skills for selection, installation and use.
This chapter explains why new home technologies are limited to these technology skilled users. First, a vision for the future digital home is described. Second, the bottlenecks that are preventing this vision from materializing are presented. Third,
some specific examples of 'walled garden' approaches as solutions to these challenges are described.
3.2 Digital Home technologies
During the last couple of years, partly motivated by Nielsen's Three Screen reports
[17], a common vision for the future of connected-home is being established. The
future will be dominated - the vision says - by three screens with content and
information moving seamlessly across them: a large HDTV screen, a lightweight notebook or (now) tablet and a small but high-resolution smartphone.
Every media type will be available in real-time or time-shifted on any screen. For instance, users will be able to access Internet content, including over-the-top television and social networking content, from the large HDTV. Moreover, it will be possible to integrate smartphone Apps with large screens to share the social-TV
experience. Other possibilities include receiving phone calls on the large HDTV and easily displaying movies and pictures from notebooks or smartphones on larger screens. In this vision, the definitions of TV, telephony and broadband get blurred, as they are all simultaneously integrated and available on any device.
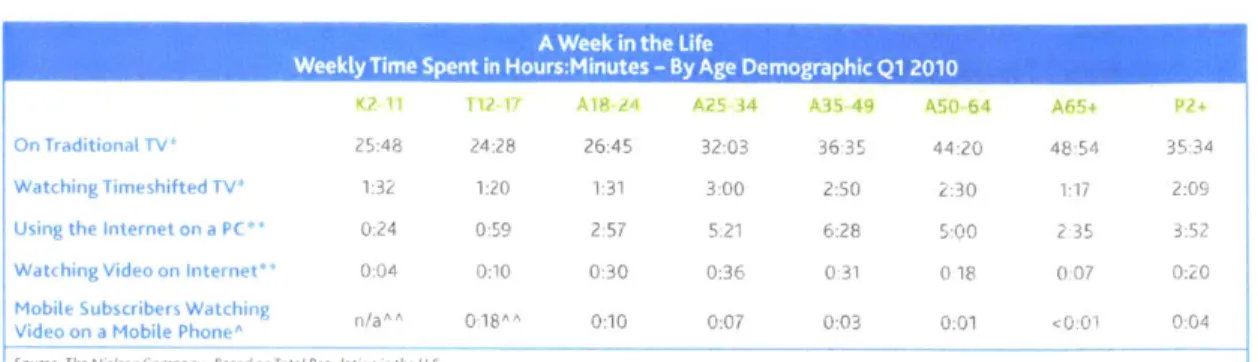
The three-screen vision is fueled by some clear trends in developed markets. According to Nielsen report for Q1 2010 in the US [17], 36% of households have
DVRs, 25% have smartphones and 52% have HDTVs with HDTV signals. Most important for the three-screen vision, despite only 3.4% of the time spent watching traditional TV is simultaneously spent using the Internet, 33.9% of the Internet time
is simultaneously spent watching traditional TV. These trends suggest a
convergence of media on multiple devices, together with media time-shift and place-shift.
A Week in the Life
Week Tim S,.pent in Hours:Minutes -By Age Demographic Q1 2010
On Traditional TV
A tching Tirneshifted TV' Usg the interne t oi a PC Watt hing Video on intetnet
25:48 24:28 26:45 32:03 36:35 44:20 48:54 35:34
1:32 1:20 1:31 3:00 2:50 2:3 0 117
0:24 0:59 2:57 5:21 6:28 5:00 2:35
0:04 0:10
Mobie cib e r sr WtAc , h' ideo on a Mobile Phoe
Source The Nielsen Company, Basedon, Total Populatio in theU S.
2:09
3:52
0:30 0:36 031 018 007 0:20
0:18^ 0:10 0:07 0:03 0:01 <00 1 0:04
Figure 10: Weekly time spent by the different demographics on the different devices and content sources. [17]
However, the three-screen vision only provides a general idea about technology evolution. In order to describe these trends is further detail an "extended" vision is presented including specific devices and how they are probably going to interact between each other.
lntam-comicso
HDTV
wjwrGOO
Very high-speed nte access IP Services (telephon, FMC, cloud, etc)
r-thf1opgeo Lnear TV ProgrammW
Very Wide Pip
recesver
IP - conmeded audo syseNM
Remote heat services smart energy meteredontrollera
* 4G wiree
Laptop NdrorTablet
4GIWF Smarlphone
Survellence + Alarm sysiems
- Very Wide Pipe. A key component will be a very large bandwidth pipe, probably
fiber-to-the-home or some new high-speed version of HFC DOCSIS3 networks
with bi-directional speeds above 100Mbps. Wireless technologies such as WiMax or LTE will not provide enough bandwidth given intense-bandwidth HD content. Probably, it will be a pure IP connection, but some bandwidth could be reserved for digital video broadcasting. The main services provided through this wide pipe will be:
a) Linear programming. Traditional live TV such as live sports, news and talk shows will be streamed as private HD IPTV services (i.e. Verizon FIOS TV), including value added services such as VoD, interactivity, social TV, etc. In some regions, depending on the availability of high bandwidth
infrastructures, part of the linear programming content could come from satellite connections or Digital-TV broadcasting.
b) Over-the-Top (OTT) content. A large portion of the video or TV content will
be provided directly through the Internet through sites such as Hulu, Netflix, iTunes, AmazonVoD, etc. It is still unclear how traditional TV providers (i.e. Comcast, Verizon) will integrate and/or compete with the over-the-top content.
c) IP Services. Old and new IP services will be provided, including IP telephony, fixed-mobile convergence services or other cloud-services. Independent Internet companies will offer most IP services.
- Router and WiFi. The Internet will connect to a home router to distribute it
using WiFi networks and -maybe - some cabling. Next generation WiFi
networks will provide high bandwidth and reliable coverage across the house in order to connect every IP-enabled device. Probably new standards will emerge to simplify the way coverage can be extended through multiple
repeater/extender devices.
- HDTV system. It will maintain - or increase - its importance in the home's
technology architecture. Some key elements will be:
a) IP connected television. The TV will directly access Over-the-Top content either through software clients embedded in the TV (i.e. new Samsung TV Apps [18]) or through external appliances such as Boxee or Roku devices.
However, the user will be able to manage linear programming and over-the-top contents through a simple and integrated user interface.
b) Remote control. After many remote-control generations, their user interface
remains limited and often counterintuitive. It will probably be partially replaced by smartphone Apps directly managing IP-connected devices.
3 HFC DOCSIS: Hybrid Fiber/Cable networks with their traditional data
c) Set-top-box. Subscription-TV companies will continue to provide set-top-boxes (STBs) in order to provide value added services through their own network. Even though from a technological standpoint STB could be replaced or embedded inside TVs, DVRs or game console, service providers will probably keep them to control the user-interface.
d) Game console. The game-console in gaining importance in the home
technological architecture as a media hub. Devices such as Windows' XBOX, Sony's Playstation and Nintendo's Wii have significant computational power and network capabilities. Most of them already include networking
capabilities that can be used for online gaming, video streaming (Netflix, Hulu, Amazon VoD clients) and video. For instance, Microsoft XBOX easily integrates with Microsoft's architecture and can used to connect multiple TVs with a Windows Media Center.
e) Interactivity and applications. Rather than isolated user-experiences per device, the future will be dominated by services integrated through common and simple interfaces. For instance, users will be able to easily access media server content, over the top content and VoD services without the need to completely transition from one system to another. There is currently a huge debate about who is going to control the user-experience (hardware
companies, service providers, over-the-top companies or independent user-interface companies).[19]
- Laptop or Tablet. Personal computing devices will continue to play a key role in
the home technological architecture. Whether laptops or tablets, people will continue to rely on a mid-size screen for entertainment and work-related tasks. As opposed to the large HDTV system, the laptop/tablet is typically a personal device that users customize according to their specific needs. They will connect through WiFi networks, leaving 4G connections to mobile environments.
- Smartphone. The smartphone will be a key element in home networks.
Following some current trends, it might be used as a remote-control device for many of the home appliances, such as TVs, DVRs and alarm systems.
Transparent handoff between 4G and WiFi networks (Fixed-mobile convergence) will offload data and voice traffic from the mobile carriers. Whether the smartphone completely replaces the traditional landline phone or not; it largely depends on the coverage, safety and battery issues. As long as smartphone batteries remain limited there will be a big incentive to have a simple and reliable landline device.
- Media Server. More than 30% of US households use a DVR device; however,
most of them are closed systems and cannot be easily integrated with other
home devices. In the future -the vision says - there will be one centralized media
storage device (or cloud service) that stores all kinds of media and accessible to HDTVs, laptops, mobile devices, cameras, audio systems, etc. Currently, there are some solutions that approximate this vision (for instance, Windows Media
Center described below), but huge bottlenecks such as a common Digital Rights Management remain.
- Audio systems. Home audio systems will become IP-appliances to allow users
access their entire music library from any location. Currently there is a gap between high-end audio devices, which are typical not network-devices, and low-end music devices such as iTunes-iPods which have networking capabilities. These gaps will disappear to offer an integrated experience.
Additionally, new market trends will add some additional components to the home technological architecture:
- Surveillance and alarm systems. New-generation surveillance and alarm systems are Internet connected, allowing households to access the content remotely and/or receive alarms on their mobile devices. As IP-video cameras prices decline home-monitoring services will probably become increasingly popular.
- Energy smart-meters. Global warming awareness, energy-reduction policies and variable energy pricing are pushing for energy management solutions at a residential level. Smart-meters allow users to monitor the exact energy demand profile and take actions to reduce it. Whether these devices are controlled though the energy network (with technologies such as power line
communication) or through the Internet, they are going to demand new networking capability to the home architecture.
- Tele-heath. Given large heath costs, problems associated with moving patients to hospitals and the convenience of health alarms for lonely elderly, some are suggesting a movement towards tele-health. Patients would have sensors and exams could be taken from home, with results instantly available online. These services and technologies would add new networking requirements to the home architecture with a clear need for simplicity and reliability.
3.3 Required technology capabilities
The extended three-screen vision is far from being a reality; some technological capabilities need to first be developed, regardless of market adoption dynamics.
Current Confidence
Technical requirements State Bottlenecks to overcome
bottleneck
High Bandwidth OK Capex and competition High
OK, but Lack of simple and
Reliable Wireless Network complex reliable coverage High
extension technologies
Topology discovery, Not fully Muti-vendor
management and media operable teor Medium
Table 1: Extended three-screen vision bottlenecks.
3.3.1 High Bandwidth.
New network technologies such as Fiber-to-the-Home (FTTH), Fiber-to-the-Curb (FTTC) and DOCSIS 3.0 enable very high bandwidth, especially as fiber optic networks are deployed close to the consumer demand. As long as companies can monetize capex intensive infrastructures, residential speeds will continue to increase. The bottlenecks for widespread availability of speeds above 20 Mbps are demand concentration (specially in rural areas), unbundling regulatory threats and the lack of sufficient market competition. Bandwidth shouldn't be a technical limitation for the evolution of the connected home, at least in developed urban areas.
3.3.2 Reliable WiFi Coverage.
The new digital home requires a reliable IP connections throughout the home rather than to a single point; in practice that means WiFi, and its coverage needs to provide enough bandwidth to devices such as TVs, mobile phones and surveillance cameras. Even though WiFi coverage might seem simple, it can be challenging for large or old houses, especially in concrete thick-walled homes. Currently there are several technologies or workarounds to extend the networks through multiple devices but the lack of simple universal standards add significant complexity. Some alternatives are:
* Multiple WiFi routers. It usually requires installing Category 5 UTP cables to connect them. Some devices do not support handoffs between routers.
e WiFi extenders. It can be a good solution depending on proprietary device
features. Network throughput is degraded unless expensive dual-band devices are used, limiting the use of HD video.
- To avoid wiring issues MoCa, HomePNA or Homeplug [22] devices can
extend Ethernet over existing coaxial cables, landline Category 3 cables or the electric network, respectively. Choosing the right technology is challenging and costly.
However, despite the additional complexities, standards to simplify the installation and use of large WiFi networks will probably emerge and wireless coverage is unlikely to present a major technical bottleneck.
3.3.3 Topology discovery, management and media sharing standards.
Connectivity is necessary but not sufficient. In order to allow users to access and share content through multiple devices, reliable technical standards embedded in the devices must enable remote management, automatic network topology
discovery and device role definition for media sharing and rendering. Even though there is some concrete progress, in particular with the DLNA (Digital Living
Network Alliance) standard at the lower level of the stack, there is still limited interoperability.
Media rendering/ Media Sharing
Device Management DSL
Topology discovery
Figure 12: Home networking standards [23] [25] [26]
a. UPnP (Universal Plug&Play Forum) protocol allows devices to automatically join the network, share their name and learn about other devices capabilities. It includes some management features, but they haven't been widely adopted. More than 900 companies have joined the forum.
b. HNAP (Home Network Administration Protocol) is a simple HTTP
Cisco protocol for remote management of home devices. Additionally it includes topology discovery. Apparently, not many devices include the protocol yet.
c. Other management protocols such as WPS (Wireless Protected Setup), DSL forum TR-64/69 and Windows Rally protocols enable remote management and topology discovery. Most of them haven't been widely adopted.
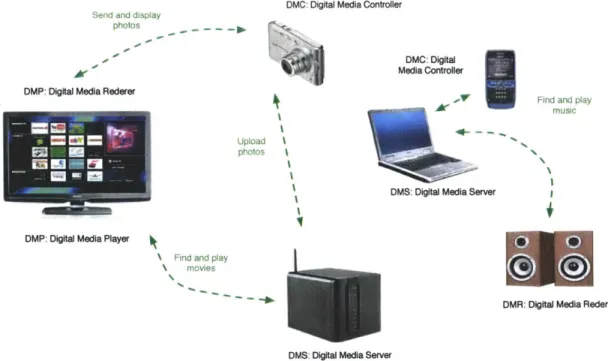
d. DLNA (Digital Living Network Alliance). It's a collaboration of around 250 brands to create interoperable standards for the home
entertainment environment. Its goal is to enable interoperable home networks where images, music and video can be easily shared across PCs, mobile devices and consumer electronics. More than 5000 products have been certified and it has gained significant market traction during the last years. However, since not every device is certified for every feature, end-users still experience frustration as they try to integrate multiple certified devices [2 7].
DMC: Digital Media Controller
Send and display
photos - - - -1
- - -DM0: Digital
Meda Cntroler
DMP: Digital Media Rederer Find and play
music
Upload photos
DMS: Digital Media Server
DMP: Digital Media Player
\ Find and play movies
DMR: Digital Media Rederer
DMS: Digital Media Server
Figure 13: DLNA devices types and media sharing possibilities.
3.3.4 Secure Digital Rights Management standards
In theory, Digital Rights Management (DRM) exists to protect the copyright of content-makers as they sell or rent their creative products online. In practice, the role of DRM in media industries has been a matter of huge debate and unclear success. Even though many have tried to establish DRM standards and marketplaces for music and video, including Google, Microsoft and Apple [28]; so far most of them have been unsuccessful. Having a common and open DRM-standard (as DLNA
attempts to include) still seems to be a distant goal.
On one hand, there are basically three alternative arguments against the adoption of DRM schemes. First, consumers don't care about DRM and the "right" to access some
content, they care about the content itself and that is what they want to own; DRM
-the argument says - will never pick up since end-users don't want it. Second, Apple
has shown that consumers are willing to pay for media even if they can get it for free somewhere else (neglecting costs associated with legal risks); if users are willing to pay for content even without DRM then the focus should be on creating good
marketplaces (such as the Apple Store) and not on DRM schemes. Finally, efforts to create DRM-controlled marketplaces have failed and the trend would be for DRM to go away. If even narrowly defined DRM schemes such as iTunes FaiPlay are going away, the promise of a universal open DRM standard becomes even more distant.
On the other hand, some analysts are now suggesting that DRM may have a new chance [28]. On May 2010 DRM had a regulatory win when the FCC approved the Motion Picture of America Association to use selectable output control flags on Video on Demand movies, allowing studios to remotely disable analog outputs on
Eil M
cable boxes for a specific time window (90 days after release) [30]. This new
regulatory framework might strengthen the adoption of DRM schemes. The growing business of IP-delivery and over-the-top content is developing with DRM schemes; Google TV, Boxee and Vudu support DRM. Additionally, consumer electronic companies, as opposed to IT and high-tech startups, have had long relationships with studios and accept DRM as part of their culture. Overall, media delivery is moving more towards streaming media and less to towards owing the media files, simplifying DRM schemes [31].
The future for DRM is still unclear, probably adding confusion and complexities to end-users for quite some time.
3.3.5 Integrated user-interfaces
The digital home vision requires simple user interfaces to allow users easily manage all their content, regardless of their source or type. This won't happen easily given the large diversity of players and their attempts to control the user's experience, especially around the HDTV subsystem.
Subscription-TV providers (e.g., Comcast, DirectTV) want to control the TV experience in order to retain the relationship with the customer and capture additional revenues opportunities. However, they will probably try to protect potential revenues sources, which will inevitable lead to a closed ecosystem and slow progress. Unless they feel threatened by potential disruptors, they won't open their interfaces to third party home networking elements (for instance, imagine controlling a third-party DVR system from your service provider interface).
Meanwhile, consumer electric companies also want to dominate the user interface. New HDTVs, BlueRay players and Game Consoles often come with software clients to directly access OTT TV services, such as Netflix, Hulu and Youtube. In particular,
Microsft Xbox easily integrates with the rest of Microsoft's Media Center
architecture and Tivo4 appliances include tuners and cablecard slots5 to add cable
TV content through their interface.
HDTVs and video appliances are now embedding App stores into their user
interfaces, trying to replicate Apple's success with smartphones. The market for TV Apps is growing rapidly (a GigaOm Pro report projected that it will reach $1.9B by
2015 [33]). If HDTVs were to follow the same disruption path the iPhone had, it doesn't seem unreasonable to imagine a leading HDTV manufacturer establishing an exclusive agreement with a cable operator and building an App Store with a direct billing relationship with the end-customer.
Finally, there are a few technology startups that are trying to create dominant interfaces for over-the-top content, such as Boxee and Vudu. As innovative startups,
4 Leading DVR Company.
s Tuners decode radiofrequency signals and CableCards provide the user-specific encryption keys to decrypt to content based of the subscription plan.
they are agile and have the potential to disrupt the most the conservative players through new user experiences, in particular Social TV experiences.
Controlling the user interface can have significant implication in terms of ad-based revenues, value added services and relationship with the customer; it is unlikely that any player will give up the possibility to control it. In particular, communication service providers will protect it as a way to fight against the dumb-pipe scenario, attempting to extend their interface to new devices for online content (TV anywhere approach). Therefore, the user interface is probably going to become increasingly fragmented with multiple confusing options and complex trouble-shooting across the different platforms.
3.4 Examples of current possibilities
Even though the full convergent digital home is still a distant vision, there are some specific solutions to share content across multiple devices. Below, three examples show what is currently possible.
TiVo TiVo from
Phone App laptop
Cable provider CableCard
116. *---Access recorded video f rom any TiVo device --- o
Cale pro CableCard Internet Connection TIVo as STB, DVR, VoD and OTT access
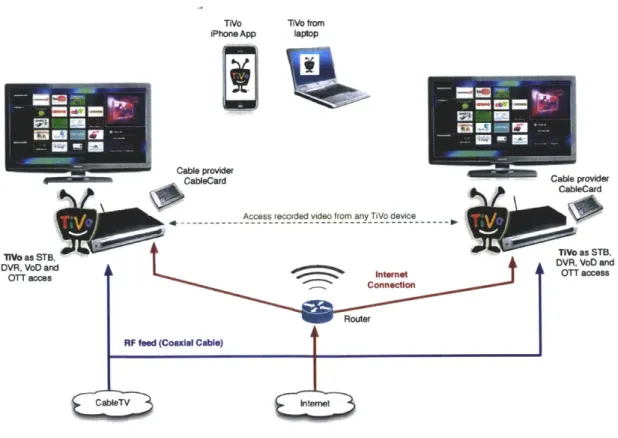
Figure 14: TiVo solution.
The TiVo solution (Figure 14) is based on their latest appliance, the TiVo Premiere, which includes a DVR, cable TV inputs, CableCard support, VoD services through Amazon VoD and access to over-the-top content. Video stored in one TiVo appliance can be accessed from other TiVo's. Additionally appliances can be managed through an iPhone App or laptops (www.tivo.com).
I
flVo as STB, DVR, VoD and OTT acces id ED M W - Ed M3 - U L -Q:E"-Windows Media Center remote
access
Access to windows media center, DVR and OTT CableTV.A
STB Ethemet Windows
Media Center with 2 tuners +
XBOX CableCards for
Uve TV and Internet DVR Connection RlF bM Router (Coaxial Cable) CableTV Internet
Figure 15: Microsoft Media Center solution.
A Microsoft solution (Figure 15) can be installed using a desktop computer with
Windows Media Center, two PCI digital tuners and two CableCards. Media content can be stored and managed using Windows Media Center, including local media, live TV, DVR videos and access to OTT sites through a simple unified interface.
Additionally, other HDTVs can connect to Windows Media Center through an XBOX console. However, the second HDTV needs a separate set-top-box to access live TV or premium content (Source: Windows media center homepage and several Internet forums).
891 LMM
iTunes remote control App Mac with ITunes + Audio files STB Ap ple ort Internet Connection Internet Apple A A i r p r t & A u d i o f r o m iTunes
Figure 16: Apple solution.
Apple's solution (Figure 16) would be based on a desktop computer with iTunes, an
Airport-based WiFi Network and an AppleTV appliance. Content stored at the
desktop computer or at the Apple TV can be accessed and managed from any device. Additionally, using specific Airports features, audio can be extended to remote audio-systems through the WiFi network. This solution includes the DRM scheme being used by iTunes to protect video content. Unfortunately, AppleTV does not include a digital cable TV tuner and an independent set-top-box is needed for live TV
and DVR content. Ap Airp RF feed (Coaxial Cable) AppleT
3.5 Technology complexity hypothesis
As explained in previous sections, future users will be able to access information and media from any-device at anytime, through simple and integrated user
interfaces. However, even though there are some solutions that allow early adopters to benefit from these new opportunities, the general solutions remain complex and confusing.
Some technologists assume that innovation and standardization efforts will
naturally and inevitably create better and simpler products, ultimately resulting in products and services simple enough for mainstream users. For them, it is just a matter of time and product development effort to simplify technologies.
This thesis considers a different hypothesis, supported by the technology trends and bottlenecks described in this chapter. Even though the innovation focus is clearly moving towards user interfaces and end-user-experience, with great progress in some cases, the widespread adoption of new home technologies will requires a different kind of effort. Convergent home technologies will remain complex and confusing for mainstream users. The next chapter explains why based on an analysis
4 Stakeholders and Ecosystem Evolution
4.1 Introduction
The previous chapter described digital home technologies and their expected evolution path for appliances, screens and services. Home technologies will probably remain complex and confusing for mainstream users.
Confusion is not only caused by technology bottlenecks. The ecosystem structure influences the type of technologies, devices and user interfaces that can be commercialized, as well as the direction of the overall system architecture.
Additionally, the ecosystem structure by itself adds complexity given the many and diverse relationships they need to establish.
This chapter presents the digital home ecosystem in terms of its main stakeholders and its evolution. First, current stakeholders and their relationships are described. Second, the ecosystem evolution is described.
4.2 Stakeholder Analysis
Users interact with technology devices to access some type of content or
information: peer-to-peer communications such as telephony, videoconferencing and chat; Internet content; Video/TV content and private media such as pictures
and music. Originally, each type of content was tied to one specific device (P2P
-telephony, Video - TV, Internet - computer, Music - CDs, Photo - printed albums).
Consumers Information/ content need o Relations between content and devices
Home Hom Phone PBXne Moblde phone Noeok DetktG/ cm0sTVs Gaming DW~ -Meia Thater ome oamemAlarm,
devices + m phet 9 "T er.
Home network Comm. I services J Content Providers contentProviders
Figure 17: Content -Device-Source diagram.
Figure 17 shows how content flows from users to content providers. Users need to
go through devices, home networks and communications service providers to access the content and information. The figure suggests the type of relationships each stakeholders has with the user. Even though their goal is to access the end-content, they need to establish direct relationships with retail players (devices) and communications service providers.
Not only device manufacturers and communications service providers influence technology products and services. Figure 18 present a stakeholder diagram that represent the most common scenario.
![Figure 2: US household technology adoption, 2009 - 20013 [2].](https://thumb-eu.123doks.com/thumbv2/123doknet/14746586.578403/16.918.237.704.424.870/figure-us-household-technology-adoption.webp)
![Figure 3: 2009 US Household communications services provider's networks per customer type [2].](https://thumb-eu.123doks.com/thumbv2/123doknet/14746586.578403/17.918.145.783.133.470/figure-household-communications-services-provider-networks-customer-type.webp)
![Figure 5: US Telephony Consumer Expenditures from 1980 to 2007. Data from Trends in telephony service report, FCC, 2008 [3]](https://thumb-eu.123doks.com/thumbv2/123doknet/14746586.578403/18.918.156.712.329.697/figure-telephony-consumer-expenditures-trends-telephony-service-report.webp)
![Figure 8: Survey asking US households about their online Internet patterns [2].](https://thumb-eu.123doks.com/thumbv2/123doknet/14746586.578403/22.918.137.751.495.910/figure-survey-asking-households-about-online-internet-patterns.webp)
![Figure 9: Growth of US cable and broadband connections versus pure broadband connections [15].](https://thumb-eu.123doks.com/thumbv2/123doknet/14746586.578403/23.918.275.638.192.563/figure-growth-cable-broadband-connections-versus-broadband-connections.webp)