HAL Id: cea-03002425
https://hal-cea.archives-ouvertes.fr/cea-03002425
Submitted on 12 Nov 2020HAL is a multi-disciplinary open access archive for the deposit and dissemination of sci-entific research documents, whether they are pub-lished or not. The documents may come from teaching and research institutions in France or abroad, or from public or private research centers.
L’archive ouverte pluridisciplinaire HAL, est destinée au dépôt et à la diffusion de documents scientifiques de niveau recherche, publiés ou non, émanant des établissements d’enseignement et de recherche français ou étrangers, des laboratoires publics ou privés.
One-step synthesis of highly pure and well-crystallized
vertically aligned carbon nanotubes
Emeline Charon, Mathieu Pinault, Martine Mayne-L’hermite, Cécile Reynaud
To cite this version:
Emeline Charon, Mathieu Pinault, Martine Mayne-L’hermite, Cécile Reynaud. One-step synthesis of highly pure and well-crystallized vertically aligned carbon nanotubes. Carbon, 2020, 173, pp.758-768. �10.1016/j.carbon.2020.10.056�. �cea-03002425�
One-step synthesis of highly pure and well-crystallized vertically aligned
1
carbon nanotubes
2
Emeline Charon*, Mathieu Pinault, Martine Mayne-L’Hermite, Cécile Reynaud 3
Université Paris-Saclay, CEA, CNRS, NIMBE, 91191 Gif sur Yvette Cedex, France 4
5
Abstract (197 words)
6
The one-step aerosol-assisted catalytic chemical vapor deposition (CCVD) process, when 7
operated in a H2-based carrier gas, is shown to be effective at an extremely low ferrocene
8
content (0.1wt.% in toluene), which enables to efficiently prepare forests of vertically aligned 9
multiwalled carbon nanotubes (VACNTs) with high purity and good crystalline level. The 10
resulting iron content in VACNT sample is only 0.5wt.% corresponding to a high catalytic yield 11
of 200 while the steady growth rate (20 µm/min) is maintained at a significant value. The iron 12
content in the sample is found proportional to the ferrocene concentration in the precursor, and 13
when it decreases, a noticeable reduction in the iron encapsulation frequency in the nanotube 14
channel is plainly observed. Lowering the ferrocene concentration generates a reduction in the 15
VACNT number density while the growth rate increases and CNT diameters and crystalline 16
structure remain similar. Such significant purity and crystalline levels involves a high oxidation 17
resistance of the VACNT forest. These results, together with the in-situ continuous growth 18
feature of the one-step aerosol assisted CCVD process, open up towards a new VACNT range 19
made of pure and well-crystallized multi-walled carbon nanotubes, which is of interest for 20
industrial production and commercial applications. 21
22
Keywords: vertically aligned carbon nanotubes; one-step catalytic chemical vapour deposition;
23
iron content; purity; crystallinity; oxidation resistance. 24
1 Introduction
26
Vertically Aligned Carbon NanoTubes (VACNT) arrays have demonstrated outstanding 27
potentialities as a novel material to prepare nanostructured composite or multifunctional 28
materials. The carbon nanotube (CNT) alignment allows to take advantage of their anisotropic 29
properties. This is useful for many applications of high societal interest such as heat transfer [1], 30
energy storage [2,3], or high performance structural composites [4,5]. Efforts are currently 31
underway to develop efficient synthesis processes for the manufacture of VACNTs in order to 32
achieve mass production while reducing costs [6,7]. In particular, the process must be as simple 33
as possible and must be operated at atmospheric pressure. The most effective method for 34
synthesizing VACNT is catalytic chemical vapor deposition (CCVD) [8] which can be operated 35
at atmospheric pressure. However, it often involved several preliminary steps at low pressure 36
to prepare the layer of catalytic nanoparticles from which the nanotubes will then grow. It is 37
why the aerosol-assisted version of the CCVD process has been developed [9–14], where 38
catalyst nanoparticles are produced in situ and continuously refreshed due to the simultaneous 39
injection of both metal and carbon precursors[15]. This process involves a base-growth 40
mechanism [16] enabling the continuous growth of VACNTs at steady growth rate over very 41
long synthesis duration, which allows VACNTs greater than 1mm to be achieved. Therefore, 42
aerosol-assisted CCVD is a versatile, cost-effective and scalable one-step process operated at 43
atmospheric pressure potentially applicable for a roll to roll production of multi-walled 44
VACNTs. The continuous supply of ferrocene, which is essential to sustain the growth through 45
the refreshment of the catalyst nanoparticles [16], induces the encapsulation of short nanowires 46
in the inner channel of the nanotubes [17,18]. As a consequence, the iron content of the pristine 47
VACNTs (Table 1) is typically around a few wt.% [15,19–21]. Such metallic by-products can 48
alter the intrinsic nanotube properties and be detrimental for several applications [22]. In 49
addition, it is also recognized that they can catalyze the oxidation of nanotubes and thus affect 50
their stability in air at moderate temperatures [23–25]. Therefore, these CNTs need to be 51
purified and several methods have been developed to remove metal by-products [22], either by 52
acid treatment [26], but their complete removal is difficult to achieve without altering the 53
nanotube structure [27,28], or by high temperature annealing which is the most effective 54
method for their removal while improving the nanotube crystallinity [22,29,30]. However, such 55
treatments complicate the CNT production process and are not always compatible with the 56
targeted application. 57
Therefore, efforts must be done directly on the aerosol-assisted CCVD production process in 58
order to reduce drastically the iron content in the pristine VACNTs. Recently and in the 59
meantime of our study, this issue was addressed by T. Kinoshita et al. [31] who reported a 60
modified floating catalyst CCVD method (similar to the aerosol-assisted one) enabling the 61
growth of CNT forests containing very low concentration of impurity (0.8 wt%). However, the 62
changes made to the process have turned it into a two-step process involving in the first step 63
the in-situ formation of the catalyst particles, then in the second step the CNT growth with 64
carbon precursors only. Such experimental conditions do not allow the refreshment of the 65
catalyst particles so that the lifetime of their process is limited. Moreover the second step was 66
performed at low pressure which limits the industrial interest of the method. 67
In this context, the aim of our work is to reduce the Fe content of pristine VACNTs while 68
preserving their crystallinity, alignment and growth rate by increasing the catalytic yield of the 69
one-step aerosol-assisted CCVD process operated at atmospheric pressure. In the literature 70
(Table 1), few studies [15,19–21] report the measurement of iron content of VACNTs formed 71
by the one-step aerosol-assisted CCVD, but it is generally found that iron content increases 72
with ferrocene concentration in the precursor solution [19,21]. Cho et al. [20] studied the [0.2-73
9] wt.% ferrocene range at 760°C and obtained 1.9wt.% as the lowest iron content in CNT 74
samples for 1.5wt.% of ferrocene in toluene. However, they did not observe any growth of 75
VACNT forests at 0.2wt.% of ferrocene, in agreement with the result of Singh et al. [13]. 76
Similarly, Castro et al. [15] observed no growth of VACNT at 0.1 and 0.5wt.% when studying 77
the [0.1-5] wt.% range of ferrocene at 850°C and the lowest iron content obtained is 3wt.% at 78
2.5wt% ferrocene with a higher growth rate due to a higher synthesis temperature. To our 79
knowledge, for one-step aerosol-assisted CCVD process, the lowest concentration of ferrocene 80
responsible for the growth of VACNTs is 0.1wt.% [32] but the growth rate at 750°C is 81
particularly low (0.4 µm/min) and the iron content in the resulting sample is not reported. The 82
highest growth rate obtained with a low ferrocene concentration (0.58wt.%) is 13.6 µm/min at 83
780°C [33] but the iron content is not indicated. The latter result was obtained with 15% H2
84
added to Ar as carrier gas. 85
86 87 88 89
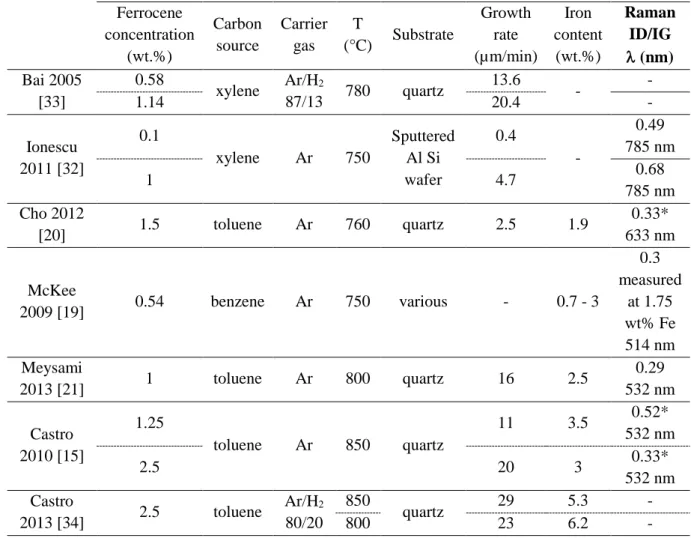
90 91
Table 1 : Lowest ferrocene concentrations giving rise to VACNT growth reported in the
92
literature for the one-step aerosol-assisted CCVD synthesis. The most relevant
93
experimental parameters are reported, as well as, the growth rate and iron content of the
94
final product when available. Ferrocene concentrations in the precursor solution were
95
converted to wt.%. Note that 1wt.% of ferrocene in toluene corresponds to a Fe/C ratio
96 of 0.07at.%. 97 Ferrocene concentration (wt.%) Carbon source Carrier gas T (°C) Substrate Growth rate (µm/min) Iron content (wt.%) Raman ID/IG (nm) Bai 2005 [33] 0.58 xylene Ar/H2 87/13 780 quartz 13.6 - - 1.14 20.4 - Ionescu 2011 [32] 0.1 xylene Ar 750 Sputtered Al Si wafer 0.4 - 0.49 785 nm 1 4.7 0.68 785 nm Cho 2012 [20] 1.5 toluene Ar 760 quartz 2.5 1.9 0.33* 633 nm McKee 2009 [19] 0.54 benzene Ar 750 various - 0.7 - 3 0.3 measured at 1.75 wt% Fe 514 nm Meysami 2013 [21] 1 toluene Ar 800 quartz 16 2.5 0.29 532 nm Castro 2010 [15] 1.25 toluene Ar 850 quartz 11 3.5 0.52* 532 nm 2.5 20 3 0.33* 532 nm Castro 2013 [34] 2.5 toluene Ar/H2 80/20 850 quartz 29 5.3 - 800 23 6.2 - * Area ratio 98
Despite the wide disparity in the experimental conditions, the results of the literature highlight 99
the important role played by the synthesis temperature and the hydrogen presence in the carrier 100
gas to maintain a realistic growth rate while decreasing the ferrocene concentration in the 101
aerosol. In a previous paper [34], we studied the effect of adding hydrogen to Ar carrier gas and 102
showed that it has a major impact on the aerosol-assisted CCVD process. Increasing the 103
hydrogen content strongly shifts the CNT growth to the reactor inlet and reduces the CNT 104
diameters, while the CNT number density increases. Indeed, hydrogen demonstrably affects the 105
gas phase phenomena by lowering the decomposition temperature of ferrocene, promoting the 106
formation of a larger number of smaller iron nanoparticles in the gas phase and increasing the 107
nucleation site density of the catalytic nanoparticles. In addition, the optimal synthesis 108
temperature in terms of yield and homogeneity of growth is reduced to 800°C under hydrogen 109
(Table 1) [34]. In these previous experiments, the concentration of ferrocene in toluene was set 110
at 2.5wt.%, the optimal concentration determined at 850°C without H2 [15]. It should be
111
reminded that without H2, no growth of VACNTs is obtained below 1.25wt.% of ferrocene,
112
neither at 850°C nor at 800°C. However, the situation may change in the presence of H2 due to
113
the significant improvement in the ferrocene decomposition it induces. Therefore, our objective 114
is to determine, in the presence of H2, the lowest concentration of ferrocene in toluene allowing
115
the growth of a VACNT forest with low impurity level while maintaining a high growth rate 116
and a good structural quality. 117
In this paper, we investigate the role of ferrocene concentration in the precursor solution 118
(toluene/ferrocene) on the VACNT growth and characteristics (iron content, length, diameter, 119
density, structure, oxidation resistance as well as on growth efficiency (yields and growth rate). 120
As hydrogen was reported to be a determining chemical player in the decomposition rate of 121
ferrocene [34], all the synthesis of this study are performed by the one-step aerosol assisted 122
CCVD process with hydrogen diluted in argon as carrier gas. The approach combines global 123
analysis by Scanning Electron Microscopy (SEM), Thermogravimetric Analysis (TGA) and 124
Raman Spectrometry, with local analysis by Transmission Electron Microscopy (TEM). Since 125
in this one-step aerosol assisted CCVD process a continuous supply of ferrocene is essential to 126
sustain growth [35], our first objective is to determine the ferrocene concentration threshold 127
above which VACNT growth is maintained once the catalytic particles are formed. To this end, 128
we first carry out double injection experiments, by designing a specific set-up allowing to use 129
a solution containing 2.5wt.% ferrocene in a first short injection sequence to form the catalyst 130
particles, and then to use a second solution with a lower ferrocene concentration in a second 131
long injection sequence. These experiments demonstrate that a very low ferrocene 132
concentration (0.01wt.%) used in the second sequence can sustain the growth of VACNT forest, 133
which is considerably lower than the ones reported in the literature for this one-step aerosol 134
assisted CCVD process. Subsequently, by operating this process in a single injection mode with 135
a ferrocene concentration decreasing from 2.5 to 0.01wt.%, we show that it is possible to 136
determine conditions to synthesize a pristine VACNT carpet with unprecedented reported low 137
iron content (0.5 wt%) and high oxidation resistance. 138
2 Experimental
139
2.1 Synthesis
140
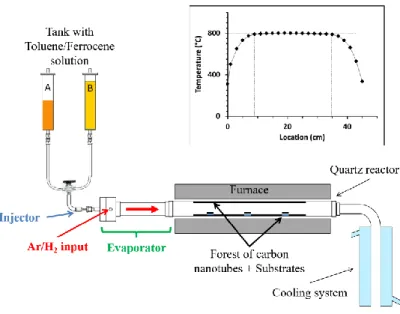
The set-up (Fig. 1) and standard procedure used to synthesize VACNTs by the one-step aerosol-141
assisted CCVD process at atmospheric pressure are similar to those described by Castro et 142
al. [34]. Note that syntheses in the presence of H2 cannot be done under the same conditions as
143
in its absence because the addition of H2 considerably shifts the VACNT growth towards the
144
reactor inlet. The synthesis temperature must then be lowered to restore growth in the reactor 145
center. This is why all syntheses here are made in the presence of H2 and at the optimal
146
temperature of 800°C [34]. The furnace exhibits an isothermal area larger than the previous 147
one. It is a 45 cm long tubular furnace equipped with a quartz reactor (16 mm inner diameter). 148
At 800°C, the isothermal area (±10°C), is extended from 10 to 35 cm from the furnace inlet 149
(Fig. 1). A flat quartz substrate of 1.5x0.75 cm2 is placed in the isothermal area at 14 cm from 150
the reactor inlet. The VACNTs grown on this substrate are analyzed together with the VACNTs 151
grown on the reactor walls. The VACNTs grown on the reactor walls are collected with a 152
stainless scraper, a procedure which keeps intact their morphology and structure. They are 153
weighed according to the location in the reactor, divided into 5 cm long sections with a surface 154
area of 25 cm2 each, in order to assess the distribution of the VACNT deposit. All the 155
characterizations will be carried out on the VACNTs coming from the substrate of zone 2 and 156
the VACNT powder coming from zone 3. These zones were chosen because the yield is better 157
there. To perform double injection experiments, the present set-up is equipped with two liquid 158
precursor tanks. Solutions of ferrocene dissolved in toluene at different concentrations are 159
poured into these tanks connected to an injection system and an evaporator where they are 160
nebulized and carried to the reactor by a gas flow of 1 L/min at a rate about 0.8 g/min. The gas 161
flow is a mixture of Ar and 30 vol.% of H2. A solution with 2.5wt.% of ferrocene is poured into
162
tank A (Fig. 1) while in tank B, the solution has variable concentrations. The solution in tank 163
A is injected for 1 min 40 s and then the solution in tank B for 13 min 20 s. The switch from 164
tank A to tank B is instantaneous, so that the process remains a one-step continuous process. In 165
single injection experiments, only the solution in tank B is injected for 15 min, with ferrocene 166
concentrations ranging from 0.01 to 2.5wt.%. 167
168
Fig. 1: Experimental set-up used for the one-step aerosol-assisted CCVD process operated
169
at atmospheric pressure. Insert: temperature profile at 800°C measured with a
170
thermocouple moved along the quartz reactor.
171
2.2 Characterizations
172
Morphology and thickness of VACNT carpets grown on the substrate and on the walls in the 173
center of the reactor are investigated by SEM (Carl Zeiss Ultra 55). CNT structure and statistical 174
analysis of external and internal diameters are obtained from TEM (Philips CM12, 120 kV) 175
after ultrasonic dispersion of CNTs in ethanol and deposition on standard TEM holder (copper 176
grids). For high resolution TEM, we use a JEOL 2011 operating at 200 kV, equipped with a 177
CCD camera (GATAN system ORIUS SC100, 4008×2672 pixels, pixel size: 0.014 nm). 178
TGA under air of products collected in the area in the center of the reactor is performed with a 179
92–16.18 SETARAM apparatus, at a temperature rate of 10°C/min in the 20-1000°C range, 180
which leads to the complete gasification of carbon. The rusty residue is used to determine the 181
iron content of the sample (weight percentage of iron in the collected products), as well as the 182
catalytic yield (ratio between the carbon and iron masses). This iron content is calculated 183
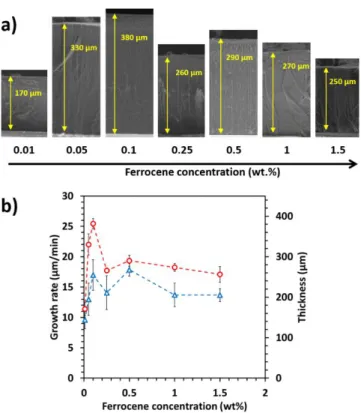
knowing that the residue consists of Fe2O3 as shown by X-ray diffraction [36]. In the unlikely
184
event that FeO contributes to the residue, the error would be small since the mass of iron in 185
Fe2O3 is 70%, while it is 78% in FeO. We will see in the following that this error would be
186
negligible given the magnitude of the variation in iron content in our experiments. 187
Raman spectra are acquired from the substrate samples in ambient conditions using a Renishaw 188
INVIA microspectrometer equipped with an Ar laser (514.5 nm wavelength), focused through 189
a Leica microscope. A very low incident power (2 mW) is used to avoid heating effects. Spectra 190
are recorded in the middle of the carpet cross-section in the 1000-3500 cm-1 range. Pertinent
191
quantitative Raman parameters are obtained by conventional fitting procedures [37] for the 192
classical G, D, D’ and 2D bands [38] and the corresponding position, full-width at half 193
maximum (FWHM) and intensity (band height) relative to the G band are reported in Table S1
194
(Supplementary data). 195
3 Results
196
3.1 Thickness and growth rate of the VACNT forests
197
Double injection experiments
198
Double injection syntheses are performed with a first injection sequence with 2.5wt.% ferrocene 199
in toluene during 1 min 40 s immediately followed by a long injection sequence of 13 min 20 s 200
with a ferrocene concentration varying between 0.01 and 1.5wt.%. In preliminary experiments, 201
we checked that the 1 min 40 s duration is long enough to initiate a VACNT carpet 202
representative of a VACNT growth with a ferrocene concentration of 2.5wt.% (See Fig. S1 in 203
supplementary data). SEM images of the products grown on quartz substrates placed in the 204
oven center (Fig. 2a) reveal VACNT forests of the same good quality as usually reported [34]. 205
The shortest carpet (170 µm) is obtained for 0.01wt.% of ferrocene in the second injection 206
sequence, but then, the thickness increases sharply to 330 µm for 0.05wt.% and up to 380 µm 207
for 0.1wt.%, after which it remains around 270 µm for higher concentrations. The 208
corresponding growth rate (Fig. 2b) exceeds 25 µm/min at 0.1wt.% of ferrocene and stabilizes 209
between 15 and 20 µm/min at higher concentrations. 210
211
Fig. 2: Double injection. (a): SEM images of the VACNT carpets grown on the central
212
substrate (side-view) for increasing ferrocene concentration in the second long injection
213
sequence. (b): mean carpet thickness and growth rate on the substrate (red dot) and on
214
the reactor walls (blue triangle) as a function of ferrocene concentration. Dashed lines are
215
added as eyes guide only. The thickness distribution was measured by SEM on the same
216
samples with 20 measurement points for the CNTs on the walls of the reactor and 3
217
measurement points for the CNTs on the substrate.
218
The values on the substrate are slightly higher than those obtained on samples collected on the 219
reactor walls. (Fig. 2b). It is because the substrate is placed upstream along the reactor of the 220
zone where the samples used for the SEM analysis are collected and that, in aerosol-assisted 221
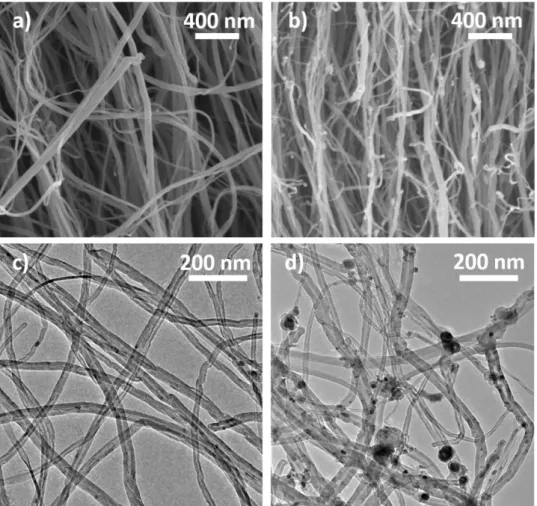
CCVD, the growth yield decreases along the reactor due to the dynamics of the catalytic 222
nanoparticles deposition as observed previously by us [15,34] and others [36]. This effect is 223
confirmed by the measurement of the mass distribution along the reactor displayed in Fig.S2. 224
As detailed in Supplementary Data, Fig.S2 shows that, whatever the ferrocene concentration, 225
the yield is optimal in zone 2 where the substrate is placed while the collected zone considered 226
in Fig.2 is zone 3 where the yield is slightly lower. 227
The most striking result of these double injection experiments is that, in the presence of H2, a
228
ferrocene concentration as low as 0.01wt.% in the second injection sequence is sufficient to 229
sustain the growth, and a rate higher than 15 µm/min is obtained for a concentration from 230
0.05wt.%. 231
Single injection experiments
232
Considering the very low ferrocene concentration (0.01 wt%) able to sustain the growth in 233
double injection synthesis, single injection synthesis with ferrocene concentration from 0.01 to 234
2.5wt.% are performed (Fig. 3a). For 0.01 and 0.05wt.% ferrocene, only a thin layer of 235
entangled nanotubes is observed. However, as soon as the ferrocene concentration reaches 236
0.1wt.%, the growth of a well-defined VACNT forest becomes effective with a growth rate as 237
high as 20 µm/min, close to its maximum of 22 µm/min obtained with 0.25wt.% (Fig. 3b). For 238
higher concentrations, the growth rate decreases to values in the 10-15 µm/min range. The 239
trends are the same on the substrate located at the center of the furnace and on the reactor walls, 240
with still mean values slightly lower for samples collected on the walls, due to variation along 241
the reactor (Fig. S2). The VACNT carpet thickness increases linearly with the synthesis 242
duration in the tested duration range up to 420 min, with a growth rate of 11.4 µm/min at 243
1.25wt.% and 2.5wt.% ferrocene (Fig. S3 in supplementary data). 244
245
Fig. 3: Single injection. (a): SEM images of the VACNT carpets grown on the central
246
substrate for increasing ferrocene concentration. (b): mean carpet thickness and growth
247
rate on the central substrate (red dot) and on the reactor walls (blue triangle) as a function
248
of ferrocene concentration. Dashed lines are added as eyes guide only. The thickness
249
distribution was measured by SEM on the same samples with 20 measurement points for
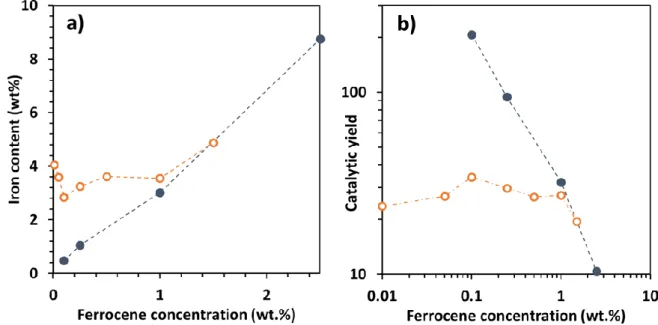
the CNTs on the walls of the reactor and 3 measurement points for the CNTs on the
251
substrate.
252
Therefore for this one-step aerosol assisted CCVD process operated at 800°C with hydrogen in 253
the gas phase, the ferrocene concentration threshold allowing an efficient growth of VACNTs 254
is as low as 0.1wt.%, while no growth at all was observed without hydrogen at 850°C for 255
ferrocene concentration equal to 0.1 or 0.5wt% [15]. More generally, the present results 256
represent a great improvement as compared to the state of the art related to the one-step CCVD 257
process (Table 1) in terms of growth rate at very low ferrocene concentration. 258
3.2 Purity, diameter and structure of carbon nanotubes
259
The main characteristics of the VACNTs are similar regardless of the injection mode and 260
depend only on the ferrocene concentration. Results obtained for the single injection mode will 261
be discussed here and the ones regarding the double injection reported in Supplementary data. 262
Let’s focus on single injection samples and compare SEM and TEM images of the formed 263
nanotubes with 0.1wt.% and 2.5wt.% of ferrocene respectively (Fig. 4). The striking difference 264
between both samples is in terms of cleanliness. At 0.1wt.%, the forest is very clean and no 265
parasitic particles can be observed outside the nanotubes at the resolutions used for the 266
observations. There are very few iron-based nanowires inside the nanotubes (Fig. 4a and 4c). 267
The number of embedded Fe nanoparticles has been drastically reduced as compared to our 268
previous results. Indeed, TEM micrographs on figure 4c) clearly indicate a high purity of CNT 269
at low ferrocene concentration. On the contrary, at 2.5wt.% numerous iron-based particles 270
exhibiting a nanowire shape are located inside the nanotubes (see also Fig. S4). In addition, a 271
considerable amount of nanoparticles are located on CNT surface (Fig. 4b and 4d), as observed 272
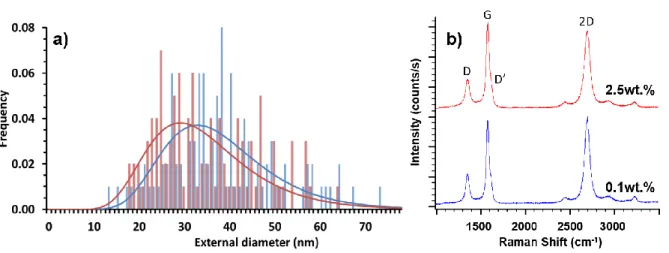
by others when the ferrocene concentration is high [19,21,33]. They are of varying sizes, some 273
of them being encapsulated into carbon shells and some others giving rise to the growth of 274
nanotubes of very small diameter which represent a low fraction of the sample mass and are not 275
considered in the diameter distributions reported below. Such iron nanoparticles located on the 276
CNT surface and the thin nanotubes observed on samples prepared with 2.5wt.% of ferrocene 277
(Fig. 4d) cannot be detected in the sample obtained with 0.1wt.% of ferrocene (Fig. 4c). 278
Therefore, lowering the ferrocene concentration induces a drastically reduction of the iron 279
impurities inside the VACNT samples. 280
A detailed HRTEM analysis of a few individual nanotubes over their length (see Fig. S4) is 281
used to characterize the iron-based nanowires found in the inner channel of the tubes. Their 282
average length and number density decrease significantly as the ferrocene concentration 283
decreases. This detailed TEM analysis at higher magnification (Fig S4) shows also a highly 284
reduced frequency of incorporation of nanowires into the tubes as well as a much lower mean 285
size of these nanoparticles when the ferrocene concentration is reduced. Therefore, the amount 286
of embedded nanoparticles is really low, and it is a great improvement for a one-step CCVD 287
process. For 0.1wt.% ferrocene, only 2% of the length of the nanotube inner channel is occupied 288
by iron nanowires, while it is 24% for 2.5wt.%. On average, it can be estimated that there is 1 289
nanowire every 2 µm at 0.1wt.% ferrocene while there is one nanowire every 0.4 µm at 2.5wt.% 290
(See Table S2). An analysis of structural defects (corking) in the inner channel also shows a 291
decrease in their occurrence for 0.1wt.% as compared to 2.5wt.%, but not in the same proportion 292
as nanowires (Table S2). 293
294
Fig. 4: Comparison in single injection between samples obtained with ferrocene
295
concentration of 0.1 and 2.5wt.%. a) SEM image of 0.1%; b) SEM image of 2.5%; c) TEM
296
image of 0.1%; and d) TEM image of 2.5%.
297
The iron content of VACNT forests is determined by TGA analysis under air (Fig. 5a) on 298
samples taken in the same central area of the reactor as the ones used for the SEM and TEM 299
analysis above. In single injection, the iron content varies greatly and linearly with the ferrocene 300
concentration, from 0.5wt.% at 0.1wt.% ferrocene up to 9wt.% at 2.5wt.% ferrocene. This value 301
of 0.5 wt% of iron in VACNT sample is a remarkably low value as compared to the literature 302
(see Table 1 and references herein) and is even lower than that of 0.56 recently published in a 303
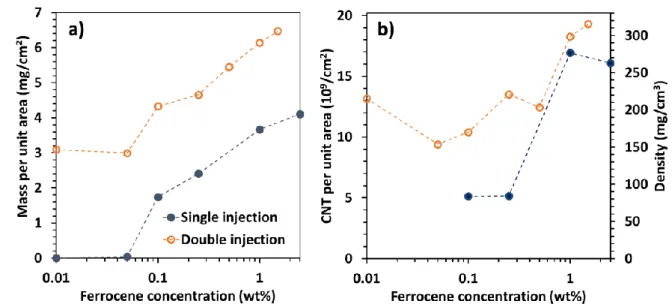
paper related to a two-step floating CCVD process[31]. It confirmed the great increase in the 304
VACNT purity at low ferrocene concentration as observed by TEM above. In double injection, 305
iron content variations are less pronounced as compared to single injection (Fig. 5a) due to the 306
first injection sequence at 2.5wt.%. To verify that the variation in iron content with the ferrocene 307
concentration is not due to a similar variation in iron chemical yield, we estimate the proportion 308
of injected iron found in the final product. In single injection, the incorporated iron represents 309
40% of the injected iron at 0.1wt.% ferrocene and 50% at 2.5wt.%. Therefore, the incorporation 310
rate of iron remains similar regardless of the ferrocene concentration and cannot be responsible 311
for the high difference in iron content. 312
The catalytic yield (Fig. 5b) scales as the inverse of the ferrocene concentration for single 313
injection. A very high and maximum catalytic yield about 200 (200g of carbon produced by 314
iron gram) is obtained for the lowest concentration of ferrocene (0.1wt.% ) and then decreases 315
rapidly down to 10 when the ferrocene concentration increases. For double injection, the 316
catalytic yield is varying in a slighter range, between 16 and 35, for the whole ferrocene 317
concentration range. 318
319
Fig. 5: Ferrocene concentration effect on a) iron content and b) catalytic yield, for single
320
(full dot) and double (open dot) injection (in this last case, it is the ferrocene concentration
321
of the second long injection sequence). Dashed lines are added as eyes guide only.
Regarding the CNT diameter, the distribution does not change with the ferrocene concentration 323
(Fig. 6a), with external and internal average diameters around 35 nm and 9 nm respectively. 324
Similar results are found in the case of double injection (Fig.S5). In terms of structural quality, 325
the Raman spectra of the samples obtained with 0.1 and 2.5 w.t% ferrocene are compared in 326
Fig. 6b (see Fig. S6 for double injection): G, D and D’ bands at 1580 cm-1, 1350 cm-1 and 327
1615 cm-1 respectively, as well as the 2D band at 2700 cm-1 are occurring. In multi-walled 328
carbon nanotubes, the D band is associated with defects and disorder and is influenced by the 329
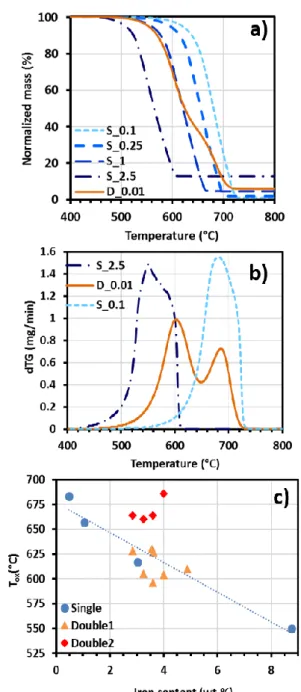
curvature of the walls, while the G band is inherent to in plane tangential stretching of carbon-330
carbon bonds. The ratio between the D and G band intensities (ID/IG) is commonly used as a
331
qualitative measure of the defect density in defective tubes: the higher this ratio, the lower the 332
crystalline level [38,39]. This ratio is dependent on the excitation wavelength. The analysis of 333
the Raman spectra recorded at 514 nm on the samples obtained in the current study gives rise 334
to a ID/IG ratio remaining similar whatever the injection mode and the ferrocene concentration.
335
This ratio is around 0.3 and the lowest value of 0.28 is obtained at 0.25wt.% ferrocene 336
concentration in single injection (Table S1). Such values are low for multi-walled carbon 337
nanotubes produced by CVD and are related to a low defect density as discussed by Meysami 338
et al. [21]. These values compare well with those reported in Table 1 obtained with similar 339
Raman wavelengths (514 or 532 nm) for samples formed in similar conditions in terms of 340
carbon precursors and synthesis temperatures (750-850°C) [15,19,21]. By contrast, they are 341
much lower than those reported in the range [0.56-0.79] by Kinoshita et al. [31] from synthesis 342
at 700°C with acetylene as carbon source. However, it has been shown that the G band in CNT 343
can be affected by defects [39], therefore as the 2D band does not represent a disorder-induced 344
mode, the relative intensity of the D and 2D bands (ID/I2D) is also used as a qualitative measure
345
of the defect density. Kinoshita el al. [31] found a ID/I2D ratio between 0.8 and 2. In the present
346
work, this ratio is around 0.3 for almost all the ferrocene concentrations, apart for 2.5wt.% of 347
ferrocene which gives rise to a ratio of 0.36. Such low ID/I2D ratio indicates a really good
348
structural quality of the CNT forest that is well preserved and even slightly improved at low 349
ferrocene concentration. This result corroborates the same trend observed by Cho et al. [20] 350
and McKee et al. [19] with a similar one-step aerosol-assisted process. 351
352
Fig. 6: Comparison in single injection between samples obtained with ferrocene
353
concentration of 2.5 (red) and 0.1wt.% (blue), respectively. a) Nanotube external diameter
354
distributions from the TEM analysis of more than 100 CNTs; b) Raman spectra acquired
355
at 514 nm at the center of forest cross-sections.
356
3.3 VACNT forest density
357
The mass per unit area of VACNTs collected on the reactor walls in the oven center (Fig. 7a)
358
increases with ferrocene concentration for both single and double injection experiments, 359
meaning that the chemical yield improves in both cases. In single injection, the areal mass is 360
close to 2mg/cm2 at 0.1wt.% and then increases gradually up to 4 mg/cm2. In double injection, 361
the areal mass is already equal to 3 mg/cm2 at 0.01wt.% ferrocene in the second injection and 362
then rises up to more than 6 mg/cm2, with values systematically higher than in single injection. 363
The gap between the two curves remains approximately constant around 2.5 mg/cm2 in excess 364
in double injection as compared to single injection. This difference can be attributed to the 365
effect of the first injection sequence with 2.5wt.% in the double injection mode. Reproducibility 366
has been tested for experiments performed with ferrocene concentration of 0.1, 0.25 and 2.5 367
wt.% in single injection and 0.1, 0.25 and 0.5 wt.% in double injection. The observed deviations 368
do not affect the general trends, particularly for single injection experiments (Fig. S6 in
369
supplementary information). 370
From measurements of areal masses (Fig. 7a) and forest thicknesses (Fig. 2b andFig. 3b), the 371
forest density can be determined and increases with the ferrocene concentration, especially in 372
single injection (Fig. 7b). Since nanotube diameters are similar whatever the ferrocene 373
concentration, this density increase must be related to an increase in N, the number density of 374
nanotubes (CNTs/cm2). N can be estimated knowing the mean external diameter of the 375
nanotubes and taking 1.8 g/cm3 for the intrinsic carbon nanotube density as estimated by helium
picnometry. N is found about ~5 109 CNT/cm2 at low ferrocene concentration, but reaches
377
~1.7 1010 CNT/cm2 at 1wt.%. This result suggests that the number density of catalytic
378
nanoparticles increases as well. 379
380
Fig. 7 – Ferrocene concentration effect on a) mass per unit area of carbon collected on the
381
reactor walls in the center zone, and b) measured mass density, for single (full dot) and
382
double (open dot) injection (in this last case, it is the ferrocene concentration of the second
383
long injection sequence). Dashed lines are added as eyes guide only.
384
3.4 Oxidation resistance
385
The TGA mass-loss profiles are very dependent on the ferrocene concentration (Fig. 8a; see
386
also Fig. S8). In single injection, the profile is strongly shifted towards the high temperatures 387
when the ferrocene concentration decreases. The oxidation temperature (Tox), taken as the
388
temperature of the peak in the TGA graph derivatives (Fig. 8b and Fig. S8), decreases quasi-389
linearly from 685°C down to 550°C when ferrocene increases from 0.1 to 2.5wt.%. Since in 390
single injection the iron content of the sample was previously found to be a linear function of 391
the ferrocene concentration (Fig 5a), Tox appears to be a linear function of the iron content as
392
well (Fig. 8c and Fig. S9). In the case of double injection, the TGA profile exhibits a remarkable 393
shoulder on the high temperature side when the ferrocene concentration in the second injection 394
sequence is lower than 0.5wt.%, so that two Tox (labelled Double1 and Double2) can be
395
identified at low ferrocene concentrations (Fig. 8c and S9). The difference between both values 396
is really significant (nearly 100°C) which points to the existence of two distinct components in 397
the samples as discussed below. 398
399
Fig. 8: a) TGA graphs obtained at a temperature rate of 10°C/min and b) their derivatives
400
for single injection samples (blue dashed lines labelled from S_0.1 to S_2.5 according to
401
the ferrocene concentration) compared to the double injection with 0.01wt.% ferrocene
402
in the second injection sequence (orange solid line labelled D_0.01). c) Oxidation
403
temperature as a function of iron content. In double injection the label “Double2”
404
corresponds to the second peak at high temperature when observed in the dTG graph.
405
See also Fig. S8.
406
4 Discussion
407
The present results show that the one-step aerosol-assisted CCVD process can be operated at 408
very low ferrocene concentration (0.1 wt.%) using an Ar/H2 gas mixture as carrier gas. Using 409
these conditions and a synthesis temperature of 800°C, we demonstrate that this one-step 410
process enables the formation with a high catalytic yield (200) of VACNT forests exhibiting 411
low impurity level (0.5 wt.% of Fe). Such low ferrocene concentration does not involve any 412
reduction of CNT growth rate since it remains higher than 20 µm/min. Compared to the 413
literature (Table 1), it is, to our knowledge, the lowest concentration of ferrocene reported so 414
far for aerosol-assisted CCVD process leading to such growth rates and impressive catalytic 415
efficiency, thus involving the formation of high purity VACNT forests. The growth of a 416
VACNT forest becomes impossible only when the ferrocene concentration falls below 0.1wt.%. 417
When it increases up to 1wt.%, the growth rate decreases by a factor of 2, while the number 418
density N is multiplied by more than 3 going from 5 109 to 1.7 1010 cm-2. 419
Regarding the mechanisms at play, hydrogen plays a significant role in the process of ferrocene
420
decomposition. Indeed, our previous results obtained at 850°C with 2.5wt.% ferrocene [34] 421
have shown that including 30% of H2 in the Ar gas flow induces an increase of N from 5 109 to
422
2 1010 CNT.cm-2 as well as a decrease of the mean CNT external diameter. These results were 423
attributed to the hydrogen induced enhancement of the dissociation rate of ferrocene. As a 424
consequence, there is a fast rise of the iron partial pressure in the reactor and a high level of 425
supersaturation which affects the homogeneous nucleation process of the iron nanoparticles. A 426
much higher number of smaller nuclei forms, which leads to a higher number density of 427
catalytic nanoparticles deposited on the substrate and therefore to a higher density of growing 428
CNTs. Such very efficient effect of hydrogen on the catalytic particles density is responsible 429
for the remarkable decrease in the ferrocene concentration allowing to reach the threshold in 430
density of CNTs needed to form a self-supporting forest structure [40]. Interestingly, in the 431
present work at 0.1wt.% ferrocene in single injection mode, N is equal to 5 109CNT.cm-2, a 432
value similar to the one obtained without hydrogen at 2.5wt.% ferrocene with the same one-433
step aerosol assisted CCVD process [18]. This number allowing the vertical self-organization 434
of the interacting CNTs is comparable to the value of about 2 109 CNTs/cm2 reported by 435
Bedewy et al. [40]. This threshold is obviously not reached below 0.1wt.%, explaining the 436
absence of VACNT growth at such low concentration. This threshold was also not reached 437
without hydrogen for ferrocene concentration below 1.25wt.%, explaining why no VACNTs 438
were observed at 0.1 and 0.5wt.% by Castro et al. [15]. 439
In double injection synthesis, the first injection sequence with 2.5wt.% ferrocene determines 440
the density of catalytic nanoparticles. So N is higher from the beginning of the precursor 441
injection and its evolution is less pronounced with the ferrocene concentration increase in the 442
second injection sequence, where a ferrocene concentration as low as 0.05wt.% is sufficient to 443
sustain the growth. 444
The existence of a clear threshold in the ferrocene concentration allowing the self-organization 445
of VACNTs is responsible for the sharp increase in the growth rate with ferrocene concentration 446
observed for single injection experiments (Fig. 3b). The slow decrease observed after the 447
maximum (Fig. 3b), as also observed by others [32,33], is generally attributed to an increase in 448
VACNT density. Call et al. [41] show that ferrocene concentration dictates forest density but 449
that forest thickness is limited by density presumably due to diffusion-limited precursor supply. 450
However, in our case, the forest thickness is found proportional to the synthesis duration at least 451
up to 90 min even at 1.25 wt.% ferrocene where the forest density is above 1010 CNT/cm2 (Fig.
452
S3). Indeed, the flow rate is too high and the average inter-tube distance too large (between 60 453
and 150 nm) to encounter feedstock resistance [42]. Same conclusion was reported by Cho et 454
al. [20] leading them to invoke, as Bai et al. [33], a weaker activity of the catalytic nanoparticles
455
due to their size increasing with ferrocene concentration [8]. However, in our study, the CNT 456
diameter remains similar whatever the ferrocene concentration, which implies that the catalytic 457
particle size remains also the same [8]. In the present range of ferrocene concentration, this size 458
is mainly governed by temperature, H2 content and nature of the substrate, all these parameters
459
being constant here. On the other hand, when the number density of nanotubes increases, the 460
amount of precursors available per nanotube decreases, in principle in inverse proportion to the 461
density. This is not exactly what we are observing here since the mass per unit area that is the 462
product of the two is not constant, but increases. Such result could be rationalized considering 463
that at very low forest density, not all the carbon precursors impinging the substrate area around 464
a given CNT (intertube distance is 150 nm) are able to interact with the catalyst particle, but 465
their proportion increases when the intertube distance decreases. Such effect could explain the 466
observed variation of growth rate. 467
Regarding the iron content of the VACNT forest, it increases linearly from 0.48 to 8.75 wt.% 468
with the ferrocene concentration in single injection, and the atomic ratio Fe/C in the forest 469
appears to be 10 times the Fe/C ratio in the precursors (Fig. S10). It means that the iron 470
conversion is 10 times higher than the carbon conversion. It should be noted that the 471
contribution of the catalyst nanoparticles themselves to the iron content is very low as is out of 472
principle the case for any VACNT forest (see its estimation in Supplementary Data). The iron 473
incorporated in the material is predominantly found as nanowires encapsulated in the inner 474
channel as a consequence of the continuous refreshment of the catalyst nanoparticles from the 475
iron-based nanoparticles continuously nucleated in the gas phase [18] in the one-step aerosol-476
assisted CCVD process. When the ferrocene concentration is decreased, the percentage of the 477
CNT inner channel length occupied by the nanowires (Fig. S4 and Table S2) drastically 478
decreases: it is estimated to be 10 times lower for the optimal concentration of 0.1wt.% 479
ferrocene as compared to 2.5wt.%, which corresponds to an encapsulation frequency which is 480
3 times lower.. Since the CNT growth rate is two-fold higher at 0.1wt.% than at 2.5 wt.%, it 481
means that the acceleration in the refreshment at high ferrocene concentration does not allow 482
to increase the growth rate but only leads to an increase of the iron content. 483
Iron can be incorporated in the forest also as nanoparticles found outside the nanotubes. This 484
contribution increases a lot when the ferrocene concentration increases, as observed by SEM 485
and TEM (Fig. 4) and by others [21,33]. Since TEM observations show that the amount of 486
external nanoparticles is negligible in the sample obtained at 0.1wt.% ferrocene, then we can 487
estimate from the TEM analysis of the inner channel (Table S2) that the iron inside the tubes 488
represents about 2/3 of the total iron content for the sample formed with 2.5wt% ferrocene. 489
Therefore, external nanoparticles contain at most a third of the iron content. Their presence in 490
large quantities is due to the large increase, with the ferrocene concentration, of the number 491
density of iron nanoparticles in the precursor gas flow going towards the substrate through the 492
carpet. To avoid the formation of such large proportion of by-products in the presence of H2,
493
the ferrocene concentration must be kept lower than 1wt.%. 494
Regarding now the size and crystalline structure of the nanotubes, both TEM and Raman 495
analysis show that their structure and diameter depend only slightly on the concentration of 496
ferrocene in the range studied here. The ID/IG ratio of 0.3 indicates a good structural quality 497
with a low defect density for MWCNTs as observed previously [15,21]. That is why it is not 498
possible to interpret the large variation in the oxidation temperature with the ferrocene 499
concentration in terms of variation of the structural properties. Even considering the position of 500
the G-band, which was found to correlate with Tox in the literature [43], it is not possible to
501
invoke such structure evolution, since here, the G-band position is very stable (Table S1). 502
Alternatively, the catalytic activity of the iron-based compounds inside the forests during the 503
TGA was also considered in the literature since it is able to change the kinetic parameters of 504
the oxidation [19,21,23–25]. In the present case, this second interpretation is strongly supported 505
by the strong correlation found between Tox and iron content in single injection synthesis
506
(Fig.8c). Also, the highest oxidation temperature (680°C) obtained for the sample with the 507
lowest iron content is found very similar to the one of VACNT sample freed from iron after a 508
heat-treatment at 2000°C [29]. Moreover, in double injection, the catalytic activity of the iron-509
based compounds allows to understand directly the presence of two components in the TGA 510
graphs. When the ferrocene concentration is very different between the two injection sequences, 511
two layers are formed with very different iron contents and different oxidation temperatures. 512
The highest oxidation temperature is close to those obtained with single injection with a similar 513
low ferrocene concentration. The large variation in oxidation temperature under dry air can be 514
correlated to the iron content and the double peak observed for sample synthesized by double 515
injection underlines the localized catalytic role of iron compounds in the oxidation reaction as 516
mentioned in [25]. It could be used to perform selective oxidation of the carpet top in order to 517
suppress the layer where the CNTs are entangled and to open the tubes. Also, double injection 518
experiments offer the possibility to control independently forest density and growth rate while 519
limiting the iron content. The forest density is determined by the ferrocene concentration in the 520
first injection sequence while the growth rate depends mostly on the ferrocene concentration in 521
the second injection sequence. 522
5 Conclusion
523
Our results show that, in the aerosol-assisted CCVD process, the addition of H2 in the carrier
524
gas results in a significant increase in the number density of catalytic nanoparticles, due to its 525
strong influence on the decomposition kinetics of the ferrocene. As a result, the formation of a 526
self-organized VACNT forest occurs at a much lower ferrocene concentration than without 527
hydrogen and a pristine forest of high purity is formed with high catalytic yield at a performing 528
growth rate. At 800°C, with 30% H2 in Ar, VACNT forest is formed with only 0.1wt.%
529
ferrocene (Fe/C=0.007at%), a value 25 times lower than the usual one of 2.5% optimized 530
without hydrogen. The iron content falls down to 0.5wt.%, so that the catalytic yield is strongly 531
enhanced by a factor of 20, while the growth rate is improved by a factor of 2 and the crystalline 532
structure remains of high quality. A forest density of 5 109 CNTs/cm2 appears to be the 533
threshold for the self-organization of the nanotubes to occur. This number density increases 534
with the ferrocene concentration, due to the increase in the number density of catalytic 535
nanoparticles. The iron content of the forest is directly proportional to the ferrocene 536
concentration. When it decreases, the frequency of encapsulation of iron nanowires in the inner 537
channel of the tubes decreases significantly and the oxidation resistance of the samples is 538
greatly improved, with an increase in oxidation temperature equal to 100°C. Finally, double 539
injection experiments appear to be an attractive approach in order to optimize independently 540
the density and the growth rate of the forest, since the density is fixed by the initial ferrocene 541
concentration in the first short injection sequence while the growth rate can be controlled by 542
the concentration in the second injection sequence. 543
Acknowledgement
544
The authors would like to thank M. Paternostre (CEA Saclay), P.-E. Coulon (LSI, Ecole 545
Polytechnique Palaiseau) and J. N. Rouzaud (ENS Paris) for access to TEM, HRTEM and 546
Raman analysis facilities, respectively. 547
548
Appendix A. Supplementary data
549
Supplementary data associated with this article can be found, in the online version, at 550
551
References
552
[1] A.M. Marconnet, N. Yamamoto, M.A. Panzer, B.L. Wardle, K.E. Goodson, Thermal 553
Conduction in Aligned Carbon Nanotube- Polymer Nanocomposites with High Packing 554
Density, ACS Nano. 5 (2011) 4818–4825. doi:10.1021/nn200847u. 555
[2] S. Lagoutte, P.-H. Aubert, M. Pinault, F.O. Tran-Van, M. Mayne-L ’hermite, C. Chevrot, 556
Poly(3-methylthiophene)/Vertically Aligned Multi-walled Carbon Nanotubes: 557
Electrochemical Synthesis, Characterizations and Electrochemical Storage Properties in 558
Ionic Liquids, Electrochim. Acta. 130 (2014) 754–765. 559
doi:10.1016/j.electacta.2014.03.097. 560
[3] K. Evanoff, J. Khan, A.A. Balandin, A. Magasinski, W.J. Ready, T.F. Fuller, G. Yushin, 561
Towards ultrathick battery electrodes: Aligned carbon nanotube-enabled architecture, 562
Adv. Mater. 24 (2012) 533–537. doi:10.1002/adma.201103044. 563
[4] H. Cebeci, I.Y. Stein, B.L. Wardle, Effect of nanofiber proximity on the mechanical 564
behavior of high volume fraction aligned carbon nanotube arrays, Appl. Phys. Lett. 104 565
(2014). doi:10.1063/1.4862273. 566
[5] J.R. Raney, F. Fraternali, C. Daraio, Rate-independent dissipation and loading direction 567
effects in compressed carbon nanotube arrays, Nanotechnology. 24 (2013) 255707. 568
doi:10.1088/0957-4484/24/25/255707. 569
[6] M. Kumar, Y. Ando, Chemical Vapor Deposition of Carbon Nanotubes: A Review on 570
Growth Mechanism and Mass Production, J. Nanosci. Nanotechnol. 10 (2010) 3739– 571
3758. doi:10.1166/jnn.2010.2939. 572
[7] R. Guzmán de Villoria, S.L. Figueredo, A.J. Hart, S.A.I. Steiner, A.H. Slocum, B.L. 573
Wardle, High-yield growth of vertically aligned carbon nanotubes on a continuously 574
moving substrate, Nanotechnology. 20 (2009) 405611. doi:10.1088/0957-575
4484/20/40/405611. 576
[8] V. Jourdain, C. Bichara, Current understanding of the growth of carbon nanotubes in 577
catalytic chemical vapour deposition, Carbon N. Y. 58 (2013) 2–39. 578
doi:10.1016/j.carbon.2013.02.046. 579
[9] R. Andrews, D. Jacques, a. M. Rao, F. Derbyshire, D. Qian, X. Fan, E.C. Dickey, J. 580
Chen, Continuous production of aligned carbon nanotubes: a step closer to commercial 581
realization, Chem. Phys. Lett. 303 (1999) 467–474. doi:10.1016/S0009-2614(99)00282-582
1. 583
[10] M. Mayne, N. Grobert, M. Terrones, R. Kamalakaran, M. Rühle, H.W. Kroto, D.R.M. 584
Walton, Pyrolytic production of aligned carbon nanotubes from homogeneously 585
dispersed benzene-based aerosols, Chem. Phys. Lett. 338 (2001) 101–107. 586
doi:10.1016/S0009-2614(01)00278-0. 587
[11] X. Zhang, a Cao, B. Wei, Y. Li, J. Wei, C. Xu, D. Wu, Rapid growth of well-aligned 588
carbon nanotube arrays, Chem. Phys. Lett. 362 (2002) 285–290. doi:10.1016/S0009-589
2614(02)01025-4. 590
[12] R.A. Afre, T. Soga, T. Jimbo, M. Kumar, Y. Ando, M. Sharon, Growth of vertically 591
aligned carbon nanotubes on silicon and quartz substrate by spray pyrolysis of a natural 592
precursor: Turpentine oil, Chem. Phys. Lett. 414 (2005) 6–10. 593
doi:10.1016/j.cplett.2005.08.040. 594
[13] C. Singh, M.S.P. Shaffer, A.H. Windle, Production of controlled architectures of aligned 595
carbon nanotubes by an injection chemical vapour deposition method, Carbon N. Y. 41 596
(2003) 359–368. 597
[14] P. Boulanger, L. Belkadi, J. Descarpentries, D. Porterat, E. Hibert, A. Brouzes, M. Mille, 598
S. Patel, M. Pinault, C. Reynaud, M. Mayne-L’Hermite, J.M.M. Decamps, Towards 599
large scale aligned carbon nanotube composites: an industrial safe-by-design and 600
sustainable approach, J. Phys. Conf. Ser. 429 (2013) 012050. doi:10.1088/1742-601
6596/429/1/012050. 602
[15] C. Castro, M. Pinault, S. Coste-Leconte, D. Porterat, N. Bendiab, C. Reynaud, M. 603
Mayne-L’Hermite, Dynamics of catalyst particle formation and multi-walled carbon 604
nanotube growth in aerosol-assisted catalytic chemical vapor deposition, Carbon N. Y. 605
48 (2010) 3807–3816. doi:10.1016/j.carbon.2010.06.045. 606
[16] M. Pinault, M. Mayne-L’Hermite, C. Reynaud, V. Pichot, P. Launois, D. Ballutaud, M. 607
Mayne-L’Hermite, C. Reynaud, V. Pichot, P. Launois, D. Ballutaud, Growth of 608
multiwalled carbon nanotubes during the initial stages of aerosol-assisted CCVD, 609
Carbon N. Y. 43 (2005) 2968–2976. doi:10.1016/j.carbon.2005.06.011. 610
[17] R. Xiang, G. Luo, W. Qian, Q. Zhang, Y. Wang, F. Wei, Q. Li, A. Cao, Encapsulation, 611
compensation, and substitution of catalyst particles during continuous growth of carbon 612
nanotubes, Adv. Mater. 19 (2007) 2360–2363. doi:10.1002/adma.200602468. 613
[18] P. Landois, M. Pinault, S. Rouzière, D. Porterat, C. Mocuta, E. Elkaim, M. Mayne-614
L’Hermite, P. Launois, In situ time resolved wide angle X-ray diffraction study of 615
nanotube carpet growth: Nature of catalyst particles and progressive nanotube alignment, 616
Carbon N. Y. 87 (2015) 246–256. doi:10.1016/j.carbon.2015.01.046. 617
[19] G.S.B. McKee, C.P. Deck, K.S. Vecchio, Dimensional control of multi-walled carbon 618
nanotubes in floating-catalyst CVD synthesis, Carbon N. Y. 47 (2009) 2085–2094. 619
doi:10.1016/j.carbon.2009.03.060. 620
[20] J. Cho, A.R. Boccaccini, M.S.P. Shaffer, The influence of reagent stoichiometry on the 621
yield and aspect ratio of acid-oxidised injection CVD-grown multi-walled carbon 622
nanotubes, Carbon N. Y. 50 (2012) 3967–3976. doi:10.1016/j.carbon.2012.03.049. 623
[21] S.S. Meysami, A. a. Koós, F. Dillon, N. Grobert, Aerosol-assisted chemical vapour 624
deposition synthesis of multi-wall carbon nanotubes: II. An analytical study, Carbon N. 625
Y. 58 (2013) 151–158. doi:10.1016/j.carbon.2013.02.041. 626
[22] P.X. Hou, C. Liu, H.M. Cheng, Purification of carbon nanotubes, Carbon N. Y. 46 (2008) 627
2003–2025. doi:10.1016/j.carbon.2008.09.009. 628
[23] I.W. Chiang, B.E. Brinson, R.E. Smalley, J.L. Margrave, R.H. Hauge, Purification and 629
Characterization of Single-Wall Carbon Nanotubes, J. Phys. Chem. B. 105 (2001) 1157– 630
1161. doi:10.1021/jp003453z. 631
[24] A.-R. Leino, M. Mohl, J. Kukkola, P. Mäki-Arvela, T. Kokkonen, A. Shchukarev, K. 632
Kordas, Low-temperature catalytic oxidation of multi-walled carbon nanotubes, Carbon 633
N. Y. 57 (2013) 99–107. doi:10.1016/j.carbon.2013.01.040. 634
[25] C. Wang, S. Guo, X. Pan, W. Chen, X. Bao, Tailored cutting of carbon nanotubes and 635
controlled dispersion of metal nanoparticles inside their channels, J. Mater. Chem. 18 636
(2008) 5782. doi:10.1039/b811560e. 637
[26] E.R. Edwards, E.F. Antunes, E.C. Botelho, M.R. Baldan, E.J. Corat, Evaluation of 638
residual iron in carbon nanotubes purified by acid treatments, Appl. Surf. Sci. 258 (2011) 639
641–648. doi:10.1016/j.apsusc.2011.07.032. 640
[27] B.H.R. Suryanto, T. Fang, S. Cheong, R.D. Tilley, C. Zhao, From the inside-out: 641
Leached metal impurities in multiwall carbon nanotubes for purification or 642
electrocatalysis, J. Mater. Chem. A. 6 (2018) 4686–4694. doi:10.1039/c7ta11257b. 643
[28] X. Yang, M. Yang, H. Zhang, J. Zhao, X. Zhang, Q. Li, Electro-purification of carbon 644
nanotube networks without damaging the assembly structure and crystallinity, Appl. 645
Surf. Sci. 442 (2018) 232–238. doi:10.1016/j.apsusc.2018.02.169. 646
[29] M. Pinault, M. Mayne-L’Hermite, C. Reynaud, O. Beyssac, J.N. Rouzaud, C. Clinard, 647
Carbon nanotubes produced by aerosol pyrolysis: growth mechanisms and post-648
annealing effects, Diam. Relat. Mater. 13 (2004) 1266–1269. 649
doi:10.1016/j.diamond.2003.12.015. 650
[30] W. Huang, Y. Wang, G. Luo, F. Wei, 99.9% Purity Multi-Walled Carbon Nanotubes By 651
Vacuum High-Temperature Annealing, Carbon N. Y. 41 (2003) 2585–2590. 652
doi:10.1016/S0008-6223(03)00330-0. 653
[31] T. Kinoshita, M. Karita, T. Nakano, Y. Inoue, Two step floating catalyst chemical vapor 654
deposition including in situ fabrication of catalyst nanoparticles and carbon nanotube 655
forest growth with low impurity level, Carbon N. Y. 144 (2019) 152–160. 656
doi:10.1016/j.carbon.2018.12.019. 657
[32] M.I. Ionescu, Y. Zhang, R. Li, X. Sun, H. Abou-Rachid, L.S. Lussier, Hydrogen-free 658
spray pyrolysis chemical vapor deposition method for the carbon nanotube growth: 659
Parametric studies, Appl. Surf. Sci. 257 (2011) 6843–6849. 660
doi:10.1016/j.apsusc.2011.03.011. 661
[33] X. Bai, D. Li, Y. Wang, J. Liang, Effects of temperature and catalyst concentration on 662
the growth of aligned carbon nanotubes, Tsinghua Sci. Technol. 10 (2005) 729–735. 663
doi:10.1016/S1007-0214(05)70142-5. 664
[34] C. Castro, M. Pinault, D. Porterat, C. Reynaud, M. Mayne-L’Hermite, The role of 665
hydrogen in the aerosol-assisted chemical vapor deposition process in producing thin 666
and densely packed vertically aligned carbon nanotubes, Carbon N. Y. 61 (2013) 585– 667
594. doi:10.1016/j.carbon.2013.05.040. 668
[35] M. Pinault, V. Pichot, H. Khodja, P. Launois, C. Reynaud, M. Mayne-L’Hermite, 669
Evidence of sequential lift in growth of aligned multiwalled carbon nanotube 670
multilayers, Nano Lett. 5 (2005) 2394–2398. doi:10.1021/nl051472k. 671
[36] S.S. Meysami, F. Dillon, A. a. Koós, Z. Aslam, N. Grobert, Aerosol-assisted chemical 672
vapour deposition synthesis of multi-wall carbon nanotubes: I. Mapping the reactor, 673
Carbon N. Y. 58 (2013) 159–169. doi:10.1016/j.carbon.2013.02.044. 674
[37] E. Charon, J.-N. Rouzaud, J. Aléon, Graphitization at low temperatures (600-1200°C) in 675
the presence of iron implications in planetology, Carbon N. Y. 66 (2014) 178–190. 676
doi:10.1016/j.carbon.2013.08.056. 677
[38] M.A. Pimenta, G. Dresselhaus, M.S. Dresselhaus, L.G. Cancado, A. Jorio, R. Saito, 678
Studying disorder in graphite-based systems by Raman spectroscopy, Phys. Chem. 679
Chem. Phys. 9 (2007) 1276–1291. 680
[39] J. Maultzsch, S. Reich, C. Thomsen, S. Webster, R. Czerw, D.L. Carroll, S.M.C. Vieira, 681
P.R. Birkett, C.A. Rego, Raman characterization of boron-doped multiwalled carbon 682
nanotubes, Appl. Phys. Lett. 81 (2002) 2647–2649. doi:10.1063/1.1512330. 683
[40] M. Bedewy, E.R. Meshot, H. Guo, E.A. Verploegen, W. Lu, A.J. Hart, Collective 684
mechanism for the evolution and self-termination of vertically aligned carbon nanotube 685
growth, J. Phys. Chem. C. 113 (2009) 20576–20582. doi:10.1021/jp904152v. 686
[41] R.W. Call, C.G. Read, C. Mart, T.C. Shen, The density factor in the synthesis of carbon 687
nanotube forest by injection chemical vapor deposition, J. Appl. Phys. 112 (2012). 688
doi:10.1063/1.4768928. 689
[42] R. Xiang, Z. Yang, Q. Zhang, G. Luo, W. Qian, F. Wei, M. Kadowaki, E. Einarsson, S. 690
Maruyama, Growth deceleration of vertically aligned carbon nanotube arrays: Catalyst 691
deactivation or feedstock diffusion controlled?, J. Phys. Chem. C. 112 (2008) 4892– 692
4896. doi:10.1021/jp710730x. 693
[43] S. Santangelo, G. Messina, G. Faggio, M. Lanza, C. Milone, Evaluation of crystalline 694
perfection degree of multi-walled carbon nanotubes: Correlations between thermal 695
kinetic analysis and micro-Raman spectroscopy, J. Raman Spectrosc. 42 (2011) 593– 696
602. doi:10.1002/jrs.2766. 697