HAL Id: hal-01242310
https://hal.archives-ouvertes.fr/hal-01242310
Preprint submitted on 11 Dec 2015HAL is a multi-disciplinary open access archive for the deposit and dissemination of sci-entific research documents, whether they are pub-lished or not. The documents may come from teaching and research institutions in France or abroad, or from public or private research centers.
L’archive ouverte pluridisciplinaire HAL, est destinée au dépôt et à la diffusion de documents scientifiques de niveau recherche, publiés ou non, émanant des établissements d’enseignement et de recherche français ou étrangers, des laboratoires publics ou privés.
Nuclear and non-dispatchable renewables: two
compatible supply options? The case of the French
power mix
Camille Cany, Christine Mansilla, Pascal da Costa, Gilles Mathonnière,
Thierry Duquesnoy, Anne Baschwitz
To cite this version:
Camille Cany, Christine Mansilla, Pascal da Costa, Gilles Mathonnière, Thierry Duquesnoy, et al.. Nuclear and non-dispatchable renewables: two compatible supply options? The case of the French power mix. 2015. �hal-01242310�
1
Nuclear and non-dispatchable renewables: two compatible supply options? The case of the French power mix
Camille Canya, b*, Christine Mansillaa, Pascal da Costab, Gilles Mathonnièrea, Thierry Duquesnoya, Anne Baschwitza
a I-tésé, CEA, DEN, Université Paris Saclay, F-91191 Gif-sur-Yvette, France, camille.cany@cea.fr b Laboratoire Genie Industriel, CentraleSupélec, Université Paris-Saclay, Grande Voie des Vignes, 92290
Chatenay-Malabry, France.
* Corresponding author: Email address camille.cany@cea.fr; Tel +33 1 69 08 39 57. Abstract:
The complementary features of low-carbon power sources are a central issue in designing energy transition policies. The French current electricity mix is characterised by a high share of nuclear power which equalled 73% of the total electric production in 2013. With the increase of non-dispatchable renewable resources, nuclear flexibility is examined as part of the solution to balance electricity supply and demand. Our proposed methodology involves designing scenarios of nuclear and non-dispatchable renewable penetration levels, and developing residual load duration curves in each case. The load modulation impact on the nuclear production cost is estimated.
This article shows to which extent the nuclear annual energy production will decrease with high shares of non-dispatchable renewables (down to load factors of 40% for proactive assumptions). However, the production cost increase could be compensated by implementing a progressive replacement of the plants. Besides, incentives proves required for nuclear to compete with combined cycle gas turbines as its alternative back-up option.
In order to make the social planner and plant operator goals coincide, the solution could be to find new outlets rather than reducing nuclear load factors. To conclude, nuclear flexibility could then be considered through the power use by producing heat or hydrogen.
Keywords:
Nuclear power flexibility; non-dispatchable renewable energy sources; Power system economics; back-up; low-carbon source synergy
2
1. Introduction
The current international context is characterised by emerging intentions to switch to low-carbon energy mixes, with country-specific energy transition pathways. The production of heat and electricity is the first contributor to greenhouse gases worldwide as it emitted a quarter of the total emissions in 2010 (French Ministry for the Environment, Sustainable Development and Energy, 2015). Thus electricity production appears to be a key parameter in working towards lower carbon contents. As stated in the SET Plan Integrated Roadmap of the European Commission: “The decarbonisation of electricity production is the centre-piece of the Energy Roadmap 2050. All scenarios studied in the Roadmap show that electricity will have to play a much greater role than now” (European Commission, 2014a). The electric power mix is a core issue of the energy transition: significant decarbonisation of the energy system will be driven by both decarbonising the power sector and enhancing the role of electricity, particularly through sector coupling, like power-to-heat and power-to-mobility, either directly with electricity, or synthetic gas as final energy.
To promote decarbonisation of the power system, the general 3X20 European directive proposes renewable penetration goals (European Union, 2009). The recent European agreement appears proactive; by announcing a binding target of at least 27% of renewable energy on a European level by 2030, it will promote such a development (European Commission, 2014b). In France, 27% of the electricity is to be produced by renewable resources by 2020 (European Union, 2009), and this share will grow up to 2050. In 2013, the share of renewable power already reached 18% of the domestic production, namely approximately 100 TWh (RTE, 2014). The major part of the growth will come from non– dispatchable renewables, which challenges the possibility of maintaining the reliability target
3 level of the power system (Gross et al., 2006; Hart et al., 2012). Wind and solar are expected to contribute to about 10% of the French electricity production in 2020 (ANCRE, 2013; RTE, 2014), and according to proactive scenarios, they could contribute to over 50% of the total electricity production by 2050 (ADEME, 2013).
To ensure the reliability target level of a power system, some power plants have to certify that they are available to supply power in case of power deviation from the expected value. This is what is commonly called ‘back-up power’. The addition of intermittent power plants in a power system triggers new needs for back-up power, both in the short term (the operational back-up meets balancing requirements) and in the long term (the capacity back-up meets adequacy requirements) (Luickx et al., 2008).
Intermittent power plants are characterised by power variability, some uncertainty and non-dispatchability with, what is more, a current priority dispatch. In the last few years, the findings first were concerned with defining and quantifying the specificities of intermittent system-dependent production profiles (Hart et al., 2012; Keppler and Cometto, 2012; Luickx et al., 2008; Perez-Arriaga and Batlle, 2012; Ruiz Gomez, 2012; Wagner, 2012; Wan, 2011). They identified average load factors, attempted to quantify additional power gradients and amplitudes induced for the residual load pattern, and examined the issue of power surplus. A majority of studies on the power system focuses on the impact of non-dispatchable renewable power plants on the power system, and the related needs for more operational and capacity back-up. In particular, the capacity credit of the non-dispatchable sources added to the system must be assessed in order to quantify the need for capacity back-up. Both back-up needs depend on key parameters pointed out by findings shared by (Davis et al., 2013; Doherty et al., 2006; Gross et al., 2006; Hand et al., 2012; Hoogwijk et al., 2007; Keane et al., 2011; Perez-Arriaga and Batlle, 2012). These parameters are inherent to a power system (i.e.
4 relative to the reliability target level, to the features of the power system before introducing intermittent sources and to the features of the intermittent fleet added to the system) on the one hand, and highly linked to approximations used to evaluate these needs on the other hand. According to Keane et al. (2011), calculations must rely on time series of data for the electric demand that must coincide with the production of non-dispatchable renewable sources, covering at least several years with an hourly time frame, along with a complete inventory of dispatchable sources, associated default rates and maintenance schedules.
Costs related to intermittency are highly sensitive to these parameters, so their quantification should be interpreted with caution, all the more as different terminologies are used from one country to another. These costs are the results of low capacity credits of intermittent sources. Authors (Connolly et al., 2010a; Gross et al., 2006; Keppler and Cometto, 2012; Perez-Arriaga and Batlle, 2012; Skea et al., 2008; Ueckerdt et al., 2013) agree on the three components which define them:
- Balancing costs that include the change of load factors for the installed capacities. They result from new operational needs linked to variability and uncertainty of these sources;
- Adequacy costs that are closely related to the assumed capacity factor of the power plants. They result from new needs for capacity back-up;
- Grid costs that result from new needs for network reinforcement.
Ueckerdt et al. (2013) propose to include all these cost components in the concept of ‘system LCOE’1 to make it possible to perform a thorough comparison of technologies.
1
5 The French case is very specific. The French power system is currently characterised by a high nuclear penetration: it supplied 82% of the French domestic consumption and 73% of the total demand (including exportations) in 2013 (RTE, 2014). Nuclear power will remain a significant contributor to the French power system in the medium term, as a low-carbon power source. The nuclear share is to be reduced to 50% of the power production from 2025 onwards, and the renewable share should reach 40% by 2030 (French Government, 2015). Besides, the choice of the nuclear fleet replacement policy is at the core of the French power debate as half of the fleet will be older than 40 years by 2025.
The energy transition in the French context needs to be pursued by taking into account available technologies and by implementing potential synergies to drive low-carbon power sources with complementary features. With high non-dispatchable renewable penetration, all back-up options should be considered, given their characteristics. Besides peaking unit production – such as gas turbines – which is usually the preferred option, storage, demand (or supply) curtailment, interconnections and even baseload power modulation should be examined as part of the solution (Hand et al., 2012). In this study, we chose to investigate this question with respect to nuclear flexibility as a way of managing intermittency, which is hardly ever considered in the literature. Our proposed methodology is explained in the first part of this article. It involves designing scenarios in terms of nuclear and non-dispatchable renewable penetration levels, and developing residual load duration curves for each of them. Herein, we examine and discuss the impact of non-dispatchable renewable energy penetration on the nuclear load factors and the LCOE. Besides, nuclear fleet replacement scenarios were developed and analysed as regards the nuclear LCOE for nuclear participating in load following compared to nuclear operating at baseload. Finally, we discuss nuclear modulation
6 when used as a back-up for wind and solar power sources, we compare it to the gas back-up and we elaborate several policy recommendations.
2. Methodology and data
As earlier stated, the methodology comprises two major components: the scenario design and the construction of residual load duration curves.
2.1 Scenario design
2.1.1 Nuclear and non-dispatchable renewable penetration scenarios
With the aim of achieving a low-carbon power mix in the medium to long term, the so-called energy transition needs to take into account national specificities (power mix history and inertia, regional resources and constraints). In this respect, the French Government launched a broad national consultation on the energy transition in 2013 (Conseil National du Débat, 2013). In this framework, several institutions developed energy prospective scenarios for France. They proposed scenarios in terms of renewable and nuclear energy penetration.
The French National Alliance for Energy Research Coordination (ANCRE2) proposed three contrasting scenarios that all meet the factor 4, i.e. a four-fold reduction in greenhouse gas emissions by 2050, compared with the 1990 level (ANCRE, 2013). The specificity of these scenarios is a proactive approach to scientific and technological innovation. All these scenarios propose a similar wind and solar penetration for a given time horizon, leading to a
2
7 maximum energy penetration of 30% by 2050. In order to consider a more proactive assumption in terms of non-dispatchable renewable penetration, we also considered the scenario proposed by the French Environment and Energy Management Agency (ADEME3), which examines the case of 50% non-dispatchable renewable penetration by 2050 (ADEME, 2013) .
Table 1 and Table 2 and list the assumptions selected for non-dispatchable renewable resources and nuclear share in the total French power production according to the ANCRE and ADEME scenarios.
Time horizon Wind penetration (%) Solar penetration (%) Total (%) Reference 2015 5 % 1 % 6 % ANCRE, 2013 2020 8 % 2 % 10 % ANCRE, 2013 2025 10 % 3 % 13 % ANCRE, 2013 2030 12 % 4.5 % 16.5 % ANCRE, 2013 2040 16 % 7 % 23 % ANCRE, 2013 2050 20 % 10 % 30 % ANCRE, 2013 2050 30 % 15 % 45 % ADEME, 2013 2050 35 % 15 % 50 % ADEME, 2013
Table 1: Non-dispatchable renewable energy penetration scenarios
(% of annual produced electricity)
Nuclear penetration
Equivalent installed capacity (Load factor of 75%)
Equivalent annual
energy production Reference scenario
75 % 60 GWe 410 TWh Business-as-usual
65% 53 GWe 350 TWh High nuclear in ANCRE
(2013)
50% 40 GWe 270 TWh
Low nuclear in ANCRE (2013) or High nuclear in
ADEME (2013)
Table 2: Nuclear energy penetration scenarios
(% of annual produced electricity)
3
8 Based on these tables, we established generic scenarios by cross-referencing the renewable and nuclear penetration assumptions. They provide conceivable target capacities in line with the current energy policy as regards the development of non-dispatchable renewable energy in the specific French context characterised by the significant role of nuclear power in the power mix:
1. ‘Median scenario’ (med): 16.5% wind and solar in 2030, 30% in 2050, 50% nuclear in both cases (in line with present status of the Energy Transition Act);
2. ‘High nuclear scenario’ (high nuc): 65% nuclear, wind and solar shares as in the median case;
3. ‘High non-dispatchable renewable scenario’ (high ren): 30% wind and solar in 2030, 50% in 2050, 50% nuclear in both cases.
We deliberately focused on nuclear and non-dispatchable renewable resources in each case without clarifying the remaining part of the energy production, which is beyond the scope of this study. However, an explanation should be given in what follows. Today, approximately 13% of the French power production is supplied by hydro power; this figure is to remain stable in the years to come. By assuming 16.5% renewables in 2030, the ‘med’ scenario would imply that at least 15% of the mix should be produced by fossil resources compared to a 5% value today, hence a higher carbon-content of the power. This led us to consider a higher nuclear share in the ‘high nuc’ scenario, in which the fossil resources would be reduced compared to today. To enrich the comparisons, we also took into account a ‘business-as-usual’ nuclear value of 75%, which reflects the current nuclear contribution to the French annual electricity production (RTE, 2014).
9 In what follows, results will be presented either through the penetration level of non-dispatchable renewable and nuclear sources (see section 3.1.), or through the scenario name (see section 3.2.). Sometimes, nuclear penetration rates will be translated into installed capacities for readability issues (see section 3.1).
2.1.2 Nuclear fleet replacement scenarios
In France, 58 nuclear units are currently in operation. They were built between 1977 and 1999 and were initially designed to last, at least, 40 years (CEA, 2015). In 2025, half of the fleet will be older than 40 years. In such a context, the nuclear fleet replacement policy choice is at the core of the power mix transition debate. The ten-year inspection programs aim at reassessing the nuclear plants safety and delivering the authorisation to maintain the plant in operation (Lokhov et al., 2012). The additional costs associated with life extension programs have been assessed and explained in the 2014 French Court of Auditors’ report on the nuclear costs in the French context (Cour des comptes, 2014). We address this question by designing and analysing contrasting nuclear fleet replacement scenarios with an academic viewpoint.
For each non-dispatchable and nuclear penetration scenario, the influence of the nuclear fleet composition on the nuclear LCOE is assessed on a given date (see section 3.2). To this end, two plausible scenarios have been developed as regards the French nuclear fleet replacement. The first is driven by the power plants’ age, while the second is designed to be progressive in order to smooth the investment requirements:
- Current reactors are operated 40 years and then shut down (‘40 yrs’ scenario);
- The current fleet is progressively replaced to avoid massive investment during a short period of time: 2 GWe are shut down each year starting from 2017 (‘prog.’ scenario).
10 In each case, the current fleet made of Pressurised Water Reactors (PWR) is supplemented by Evolutionary Power Reactors (EPR™) in order to achieve the target nuclear penetration level of the selected scenario. An example is provided in Figure 1 for a 50% nuclear penetration in terms of produced energy. In this example, the total energy production is assumed to be 540TWh, which is equivalent to the current level (Eco2mix, RTE database, 2015). As a matter of fact, in this study we neither assume a significant increase in the power demand nor a significant reduction. The PWR load factor is assumed to be 0.75. The EPR™ load factor is assumed to evolve from 0.80 between now and 2040, to 0.85 in 2050, thus taking into account improvements in the technology and organisation of the fleet. From these assumptions, we assess the EPRs™ installed capacity according to the selected replacement scenario, as displayed in Figure 1.
Figure 1: PWR & EPR™ capacity evolution scenarios (for 50% nuclear penetration)
In the example illustrated in Figure 1 (50% nuclear penetration case), the nuclear contribution to the total energy production of the power mix declines from 75% in 2015 to 50% in 2030, where it stabilises at this level. Other assumptions will be examined in section 3.
11 In the ‘prog.’ scenario, the PWR shut-down is slower than in the ‘40 yrs’ scenario: for a given year, more PWRs are in operation for the same level of nuclear production capacity. This scenario corresponds to the most realistic one in the French context.
2.2 Assessing the nuclear power modulation capacity through the construction of residual load duration curves
To assess the impact of non-dispatchable renewable sources on other power plant capacity requirements and annual productions in a power system, two major types of approaches can be distinguished. First, the construction of load net of wind and solar (called ‘residual’ in what follows) duration curves for different wind and solar penetration levels can be carried out. This is used to determine the optimal mix of other generation resources in the long term (Davis et al., 2013; Keppler and Cometto, 2012). Secondly, a minimum cost economic dispatch model can be used to refine the general trends obtained from the first approach (Barnacle et al., 2013; Barton et al., 2013; Connolly et al., 2010b; Davis et al., 2013; Dautremont and Colle, 2013; Keppler and Cometto, 2012). The use of such a deterministic input/output model makes it possible to balance short term supply and demand, in response to technical, economic and political constraints. Herein, we focus on the first approach to highlight the general trends in the long term.
The developed methodology involves several steps. First, the construction of annual residual load duration curves considered complementarily with screening curves (see sections 2.2.1 and 2.2.2) makes it possible to assess the annual energy productions and optimal installed capacities from a social welfare viewpoint. One output is the need for baseload installed power that will be fulfilled by nuclear power in the French case.
12 Thereafter, the nuclear modulation capacity is evaluated based on the realistic French nuclear fleet scenarios presented in the previous section. Thanks to the annual residual load duration curves, we are able to evaluate and compare the nuclear Effective Full Power Hours (EFPH) of both options: nuclear power fleet operated as a baseload capacity, or as a combined option: baseload and cycling capacity. We then perform an economic comparison.
2.2.1 Construction of load duration curves
A load duration curve represents the sorted hourly load of one year, starting with the highest load hour. The residual load duration curve (see Figure 2) is obtained by withdrawing wind and solar production to the French total production on an hourly time step, thus considering that they have a dispatch priority, and then ordering the residual demand from the highest to the lowest value.
Figure 2: Residual load duration curves in the French case
The residual load duration curves constructed for this study (see Figure 2) are based on historical wind and solar production hourly profiles (between 2010 and 2013) established from RTE data (Eco2mix, RTE database, 2015). Assuming similar hourly variation shapes, wind and solar production profiles were extrapolated for renewable penetration rates, as
13 represented in Figure 2. These rates correspond to scenarios developed by ANCRE for 2030 (16.5%) and 2050 (30%), and by ADEME for 2050 (50%) (see Table 1). Even if wind and solar penetrations are aggregated in the displayed rates, separate assumptions were considered and the corresponding production profiles were treated separately in the calculations.
It should also be noted that the considered demand, to which wind and solar production are withdrawn, actually includes the exportations. Thus, exportations are assumed to be exogenous. Additional exportations may be relevant in case of excess capacities for certain hours and if the interconnection capacities allow it.
2.2.2 Assessing the nuclear power modulation capacity
The first step involved in assessing the nuclear power modulation capacity is to define the ‘baseload’ nuclear power capacity. We can use the screening curve methodology to do this.
The screening curve methodology is used to design prospective optimal mixes from a social welfare viewpoint (Keppler and Cometto, 2012). It consists in plotting the annual cost of the installed capacity according to its utilisation time (see Figure 3). By plotting the curves for each of the available technology, the optimal minimum annual operating time is obtained for each power plant type so as to minimise the total system costs.
The second step involves copying the obtained minimum operating time for each power plant type on the residual load duration curves, so as to assess the corresponding optimal firm power to operate at full power for at least the minimum operating time resulting from the screening curves. Thus, the screening curve methodology seems to provide a very straightforward way for designing an optimal power mix from the viewpoint of the electric system, or social planner.
14 However, this method is questionable due to its high sensitivity to the retained assumptions. We chose to illustrate this sensitivity through the nuclear share - our focus in this paper - and two parameters:
- Discount rate: this assumption proves critical for very capex-intensive technologies, such as nuclear;
- Carbon price: it is a key parameter with respect to increasing the economic competitiveness of low-carbon technologies.
According to our calculations, when varying the discount rate of 3 points, the minimum optimal operating time of nuclear power could vary between 3,000 and 8,000 hours according to discount rate and carbon price assumptions. Figure 3 illustrates the sensitivity of the methodology with two cases for a discount rate of 8%: with no carbon price and with a carbon price of $30/tonCO2. In the first case, nuclear could never become competitive; in the second one, a minimum operating time of 5000 hours would be needed for the nuclear to become the lowest-cost technology compared with coal and gas.
Figure 3: Screening curve example (cost data from Salvadores and Keppler (2010)), 8%
15 As a result, the nuclear power that would be installed from an electric system viewpoint would differ depending on the retained assumptions leading to a resulting firm capacity between 40 GW and 55 GW, for instance, for 16.5% renewable penetration.
Given this uncertainty range, we chose an empirical approach based on the mean historical availability factor of nuclear in France (Power Reactor Information System (PRIS) database, 2015). A value of 7,000 hours was selected. Such an approach rather minimises the resulting installed nuclear capacity. This value was used to assess the ‘baseload’ firm nuclear power (called Pbaseload hereafter) according to the residual load to supply. The ‘baseload’ nuclear production (representing an firm capacity of Pbaseload) will then be compared with the nuclear production corresponding to the firm nuclear power capacity provided by the selected scenario (i.e. ‘med’, ‘high nuc’, ‘high ren’, see section 2.1). This will be done to assess the available energy for modulation, i.e. the nuclear modulation capacity. This is illustrated in Figure 4.
16
3. Results and discussion
By implementing the methodology that was presented we examine: i/ the impact of renewable penetration on the nuclear power load factors, ii/ the impact of the nuclear fleet replacement policy on the economic competitiveness, and iii/ the potential of nuclear flexibility as a back-up power option.
3.1. Impact of renewable penetration on the nuclear power load factors
At first, we adapted the assessment illustrated in Figure 4 to each scenario and calculated the share of the total annual electricity production (i.e. 540TWh) that would be provided by nuclear, according to the wind and solar penetration, when nuclear is operated at least 7,000 hours per year at full power. The results are displayed in table 3.
Non-dispatchable renewable penetration (%) Baseload nuclear penetration (%) 16.5 57 30 41 50 17
Table 3: Baseload nuclear contribution to meet the total power production according to the non-dispatchable renewable penetration (% of produced energy)
From this table, for a 16.5% wind and solar share, it can be seen that 57% of the electricity should be supplied by nuclear as ‘baseload’, according to the retained assumptions. Hence, 50% nuclear penetration (corresponding to the ‘med’ scenario in 2030), would be underestimated compared with the ‘baseload’ reference, and thus no nuclear modulation capacity is available in this scenario.
17 Attributing dispatch priority to non-dispatchable renewable energy actually lowers the operating time of already existing nuclear reactors, in the short term. This is an issue for capex-intensive technologies such as nuclear. We assessed this impact according to the nuclear power installed capacity and the non-dispatchable renewable penetration level through the use of the residual load curves. The renewable and nuclear penetration assumptions were derived from the scenarios presented in section 2.1. To assess the nuclear installed capacities for the three cases, we assumed a baseload nuclear load factor of 0.75 in accordance with historical data (Power Reactor Information System (PRIS) database, 2015). Table 4 presents both the total annual nuclear energy production and the nuclear EFPH in each case (a 100% load factor would correspond to 8760 EFPH).
Installed nuclear capacity (GWe) 41 (50% penetration) 53 (65% penetration) 60 (75% penetration)
TWh EFPH TWh EFPH TWh EFPH
% wind and solar 16.5 270 6590 330 6300 360 6000 30 250 6150 290 5490 310 5120 50 190 4590 210 3890 210 3530
Table 4: Resulting nuclear annual energy production and EFPH according to the wind, solar and nuclear penetration levels in the French electricity mix
For the cases with 50% wind and solar, the nuclear annual load factor decreases as low as 50% and up to 40% with a 60GWe installed nuclear capacity (75% share of nuclear).
To provide some orders of magnitude, the nuclear annual revenues were calculated as the produced energy multiplied by the mean value of electricity hourly prices in the day-ahead market in 2014, which equalled 32€/MWh (EPEX SPOT SE: Day-Ahead Auction database, 2014). The figures are presented in Table 5. In Table 6, the ‘revenue losses’ are presented
18 according to the share of renewable penetration. They are estimated as the difference between the maximum foreseeable revenue (corresponding to the baseload nuclear production, assuming the plants were operated at a load factor of 75%), and the actual revenue that is influenced by the renewable penetration (figures in Table 5). Results in Table 6 are expressed as a share of the maximum foreseeable revenue.
Installed nuclear capacity (GWe) 41 (50% penetration) 53 (65% penetration) 60 (75% penetration) %
wind and solar
16.5 8640 10690 11520
30 8060 9310 9820
50 6020 6590 6780
Maximum foreseeable revenue 8690 11290 13030
Table 5: Annual revenue according to the wind, solar and nuclear penetration levels in the French electricity mix and maximum foreseeable revenue (M€)
Installed nuclear capacity (GWe) 41 (50% penetration) 53 (65% penetration) 60 (75% penetration) % wind and solar 16.5 1 5 12 30 7 18 25 50 31 42 48
Table 6: Annual revenue losses according to the wind, solar and nuclear installed capacities in the French electricity mix: share of the maximum foreseeable revenue (%)
These figures highlight that reduced load factors would represent substantial profit losses in the long run. However, effective losses are expected to be higher because the introduction of renewables with near zero marginal costs will tend to reduce the electricity wholesale market price. Such an effect needs to be taken into account for future works. Nonetheless, significant renewable power penetration does not necessarily mean reducing the nuclear share. Low-carbon power sources should be promoted in a complementary manner to achieve a low-carbon power mix. Thus, with a view to make the social planner and plant operator viewpoints coincide, the solution could be to find new outlets rather than reducing the nuclear load factor. This is discussed in section 3.3.
19 3.2. Impact of the nuclear fleet replacement policy on the economic competitiveness
The scenarios presented in section 2.1.2 as regards the power fleet replacement were established based on realistic expectations. They result in different annual LCOE according to the composition of the nuclear mix. The selected assumptions are as follows:
- The annualised investment cost of the nuclear mix was computed from the share between PWRs and recently installed ones (EPR™) for each year of the simulation. - The annual operation cost is considered constant over the years and has the same value
for PWRs and EPRsTM.
- Life extension costs have been added for the ‘prog’ scenario between 2011 and 2033. The major part of the additional investment needs falls within 2011 and 2025. As mentioned earlier, nuclear plants safety is reassessed thanks to the ten-year inspection programs. By 2025, the third inspections will be completed for the PWRs of 1300 MWe and more than three-quarters of the fourth inspections will be realised for the PWRs of 900 MWe. What is more, the fourth inspections will end in 2033 for the 900MW and 1300MW power plants (Cour des comptes, 2014).
- The latest estimation of the investment cost of the EPRTM under construction in France (Flamanville) was taken from (Bezat, 2015) with a value of 10 billion€2013. Its life time is assumed to be 60 years.
- A learning rate was assumed for the EPR™; the investment cost was decreased from the first-of-a-kind to the tenth power plant (minus 10% for the second one compared to the first one; minus 9% for the third one compared to the second one, repeating it until minus 1% for the eleventh one compared to the tenth one), and then considered constant.
20 These cost assumptions are displayed in Table 7 and Table 8 and were taken from the French Court of Auditors’ in-depth study of the nuclear costs in the French context (Cour des comptes, 2014; Bezat, 2015).
Annual costs per GWe: M€2013/year/GWe
Investment 135
Decommissioning 8
Operation 158
Spent fuel and waste management 21
Total annual costs: M€2013/year
Investment for maintenance
From 2011 to 2025 2300
From 2026 to 2033 1800
Life extension
From 2011 to 2025 2000
From 2026 to 2033 1800
Table 7: Assumptions for the cost breakdown of a PWR from (Cour des comptes, 2014)
Annual costs per GWe: M€2013/year/GWe
Investment and decommissioning
First of a kind 789 Second 710 Third 646 Fourth 594 Fifth 553 Sixth 520 Seventh 494 Eight 474 Ninth 460 Tenth 450 Eleventh 446 Operation 158
Spent fuel and waste management 21
Table 8: Assumptions for the cost breakdown of a EPR™ from (Cour des comptes, 2014;
Bezat, 2015). The learning rate assumptions are issued from in-house expertise.
The nuclear annual LCOE was then computed according to the retained assumptions and the nuclear fleet replacement scenario. To this end, the ‘Economic Current Cost’ methodology was retained for a discount rate of 8% (actual annualised return between 1971 and 2000), i.e. the annual LCOE was assessed by annualising the investment including interests over the
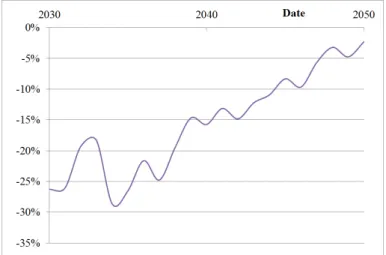
21 selected amortisation period (equal to 40 years for the PWRs). After this date, the investment burden is zero: this is the characteristic of this method. Figure 5 displays the relative difference between the nuclear annual LCOE for the ‘prog.’ scenario and the ‘40 yrs’ scenario, for baseload operation. The results are presented for a 50% nuclear penetration in terms of produced energy. The considered period is 2030 - 2050: two deadlines considered in the defined scenarios.
Figure 5: Relative difference of nuclear annual LCOE (€2013/MWh) between the
‘prog.’ scenario and the ‘40 yrs’ scenario (50% nuclear penetration)
In 2030, there are hardly any more PWRs in the fleet for the ‘40 yrs’ scenario (approx. 10 GWe), whereas the PWR power is still significant in the ‘prog.’ scenario (approx. 40 GWe). As a result, from 2030 to 2050, the ‘prog.’ nuclear generation cost always appears less expensive (the LCOE difference reaches 20€2013/MWh by 2030). Firstly, this is because EPRs™ are introduced at a slower pace than in the ‘40 yrs’ scenario, and secondly because the ‘prog.’ scenario takes advantage of amortised PWRs. The scenarios converge by 2050, since the nuclear fleet is only composed by EPRs™ by this time for both scenarios.
22 Considering the nuclear and renewable penetration scenarios defined in section 2.1 (‘med’, ‘high nuc’, ‘high ren’) together with the nuclear fleet replacement scenarios, we must now compare the nuclear fleet costs by considering both effects:
i/ the renewable and nuclear energy penetration (impact of load factor reduction as identified in section 3.1), and
ii/ the selected fleet replacement (impact of the nuclear fleet composition as identified previously for the ‘fleet’ cost for baseload).
By 2050, both nuclear replacement scenarios lead to a fleet comprising EPRs™ exclusively, hence costs converge. In what follows, we focus on 2030 to point out differences between the ‘40 yrs’ and ‘prog.’ scenarios.
On the one hand, in section 3.1, it was highlighted that nuclear load following (particularly resulting from renewable dispatch priority) induced reduced average load factors, hence higher production costs. On the other hand, it was shown in Figure 5 that in 2030, the ‘prog.’ scenario leads to lower nuclear production costs than the ‘40 yrs’ scenario for baseload operation. Similar trends would obviously be observed when comparing the replacement policies for reduced load factors, since the load factor reduction is only induced by the renewable penetration. Therefore, the question arises: to what extent is the nuclear ‘prog.’ replacement scenario still cheaper than the ‘40 yrs’ scenario, even when operating the nuclear fleet in a load following mode? Answering this question will put a light on the economic advantage of the progressive replacement policy to participate in load following. To do so, we have used the ‘40 yrs’ replacement scenario with nuclear as the ‘baseload’ to make our comparison.
23 - Case 1: for 16.5% renewable penetration in 2030, ‘high nuc’ scenario (65% nuclear), with a nuclear fleet composition derived from the ‘prog.’ scenario, costs were compared with the ‘baseload’ nuclear penetration according to a nuclear fleet composition derived from the ‘40 yrs’ scenario.
- Case 2: for 30% renewable penetration in 2030, ‘high ren’ scenario (50% nuclear), with a nuclear fleet composition derived from the ‘prog.’ scenario, costs were compared with the ‘baseload’ nuclear penetration according to a nuclear fleet composition derived from the ‘40 yrs’ scenario.
Relative differences of nuclear annual LCOE for case 1 and 2 are displayed in Table 9.
Case 1 (“high nuc” / “baseload”) - 15 %
Case 2 (“high ren” / “baseload”) - 23 %
Table 9: Relative difference between the annual nuclear levelised production cost for case 1 and case 2 in 2030
For 16.5% and 30% non-dispatchable renewable penetration in 2030, the ‘prog’ scenario nuclear replacement policy allows us to consider the possibility of nuclear operating at reduced load factors in order to contribute to load following. In such case, the annual nuclear LCOE remains lower of around 20% than the case with nuclear operating as the ‘baseload’ with a ‘40 yrs’ replacement policy. The economic advantage of the progressive replacement policy is not compensated by reduced load factors. As a result, under an uncertain context, it is better to promote such a policy, even not presuming of future actual renewable penetration. This makes it possible to take advantage of the amortised power plants, the history of the French power mix.
Besides enabling a lower production cost for the nuclear fleet, smoothing the replacement of the nuclear capacities would be beneficial to the whole power mix. In the case where nuclear
24 power would be partly replaced by renewables, by somewhat delaying the capacity replacement, it would be possible to ‘wait’ for cheaper technologies and possibly reduce the overall production cost. In such a case, effective capacity credits should be taken into account according to the nature of the renewable source and the level of penetration into the power mix. Thus, to replace a given capacity of dispatchable power, higher amounts of non-dispatchable resources are needed due to intermittency issues. If non-non-dispatchable renewable production profiles are correlated, their capacity credits tend to decrease with higher penetration levels (Keane et al., 2011; Keppler and Cometto, 2012).
3.3. Nuclear modulation options: leverage to promote decarbonised power mixes
A gap can result from the difference between the installed nuclear capacity and what is considered optimal: either from the electric system viewpoint (with all the attached uncertainties of the screening curve methodology pointed out in section 2.2.2), or from the operator viewpoint that target the maximum load factor. In what follow, nuclear flexibility is examined as a back-up option both in terms of quantity and cost: amount of energy that may be available, and potential economic advantage compared to alternative options.
In this section, the installed nuclear power is compared against the ‘baseload’ value for each scenario, in order to assess the modulation capacity and energy. For the different cases, Table 10 shows the annual energy dedicated to modulation, its share of the total annual energy produced as well as the corresponding EFPH to be fulfilled by nuclear as back-up power. For a given nuclear penetration level, the share of nuclear energy devoted to modulation increases more than linearly with the renewable penetration level. It is worth pointing out that 50% of nuclear energy would be dedicated to modulation for the ‘high ren’ scenario in 2050.
25
Installed nuclear capacity (GWe) 41 (50% penetration) 53 (65% penetration) 60 (75% penetration)
TWh % EFPH TWh % EFPH TWh % EFPH
% wind and solar
16.5 0 0 0 30 8 6000 50 15 4900
30 30 11 6200 70 23 4800 80 27 4200
50 90 50 4800 110 55 3900 120 56 3400
Table 10: Resulting nuclear annual energy production dedicated to modulation, its share of the total annual energy production and EFPH according to the wind, solar and
nuclear penetration levels in the French electricity mix
As stated earlier, the increase in the non-dispatchable renewable share in the power system modifies the residual demand pattern, resulting in higher needs for power ramping and higher amplitude variations, which remain to be quantified (Keppler and Cometto, 2012; Wagner, 2012; Wan, 2011).
The French nuclear fleet already contributes to load following because of its high share in the mix. Nuclear power has characteristics compatible with power modulation (Bruynooghe et al., 2010; Choho, 2013; Lokhov, 2011) and the French nuclear fleet has potential for more power ramping and higher amplitude variations according to the power operation track record (Bruynooghe et al., 2010; RTE database - Portail clients - Production réalisée par groupe, 2015). Thanks to the size of the fleet, production could be varied greatly by performing small increments in each power plant. This would remain true as long as the installed nuclear power is sufficient in terms of contributing to the total electricity mix. The quantification of the impacts of intermittent resources on the nuclear hourly production profile (i.e. ramping and amplitudes) will be the topic of future works.
Assuming perfect adaptation to the change in power profile, we compared the nuclear load following option to the gas option, which is considered as the reference back-up option in this
26 study. Since the ‘prog’ scenario corresponds to the most realistic one in the French context, we will focus on this one. We thus compare:
- The cost of operating the nuclear capacity at a reduced load factor (according to the nuclear and renewable penetrations defined by the scenario: ‘med’, ‘high nuc’, ‘hig ren’),
- And the cost of operating the nuclear power as a baseload (the nuclear capacity is then only the ‘baseload’, as defined in section 2.2.2), plus an additional gas capacity to cover what would have been provided by the additional nuclear capacity (defined as the difference between the nuclear penetration hypothesis in the considered scenario and what is required for ‘baseload’).
LCOE were compared. Cost assumptions as regards nuclear plants were provided by the French Court of Auditors (Cour des comptes, 2014), while the OECD assumptions were taken for the gas-fired power plants (Wittenstein and Rothwell, 2015). The French assumptions were taken for Combined Cycle Gas Turbines (CCGT) while, due to the lack of data, the German assumptions were taken for the Open Cycle Gas Turbines (OCGT). They are presented in Table 11. The CCGT was selected as the reference, because what would have been provided by the additional nuclear capacity represents annual operation time of more than 1,000 hours per year in our scenarios. For such durations, CCGT are more competitive than OCGT, due to higher OCGT operation costs. Indeed, according to Wittenstein and Rothwell (2015), the electrical conversion efficiency of a CCGT equals 61% for the French case and is around 40% for OCGT.
27
CCGT OCGT
Electrical efficiency 61% 40%
Technical lifetime 30 years 30 years
Construction time 3 years 3 years
CO2 emission 0.35 tCO2/MWh 0.50 tCO2/MWh
Discount rate and interest rate 8 % 8%
Overnight costs 735 M€2013/GWe 411 M€2013/GWe
Investment (including interests) 795 M€2013/GWe 445 M€2013/GWe
Decommissioning 4% of overnight costs 5% of overnight costs
Operation and maintenance 4.7 €2013/MWh 22.3 €2013/MWh
Table 11: Assumptions for the cost decomposition and technical characteristics of CCGT and OCGT from (Wittenstein and Rothwell, 2015)
In each scenario, the CCGT load factor calculation serves determining its LCOE. The load factor is estimated by quantifying the annual energy that has to be provided for modulation and associated installed capacity (calculated with a capacity factor value of 0.85 (Wittenstein and Rothwell, 2015)). Results show that gas would operate with a load factor of 58% to participate in load following by 2030 for the ‘high nuc’ scenario (respectively, 47% by 2050). With the retained assumptions, the CCGT cycling option is cheaper than nuclear back-up in each scenario. The gas LCOE which leads to equalising the cost of both options is estimated to be approximately 100€2013/MWh. Thus, to reach this gas LCOE, the associated gas price was determined for a given CO2 price. Conversely, the same approach was followed for a given gas price.
The results fall within the same orders of magnitude for all scenarios:
- i/ for a CO2 price of €5/tonneCO2 (which corresponds to the current market value (Thomson Reuters, 2015)), nuclear back-up is competitive when the gas price exceeds €50/MWh;
- ii/ for a gas price of €31/MWh (which corresponds to the ANCRE and OECD assumptionfor 2030 (for 2020 respectively) (ANCRE, 2013; Wittenstein and Rothwell, 2015), the gas option dominates as long as the CO2 price is below €100/tonneCO2;
28 - iii/ if the OCGT was considered as the gas option, the previous results would be modified to around €30/MWh and €5/tonneCO2 respectively. During the first semester of 2015, the mean gas price for industrials in France equalled 35€/MWh without taxes (Eurostat database, 2015). This means that today nuclear would be cheaper than OCGT to provide this back-up.
Even if the CCGT option appears cheaper according to our assumptions, it would generate CO2 emissions in the range of 10-30 Mt per year, depending on the scenario and the time horizon.
To enlarge the scope, it would be worth considering taking advantage of the available energy to produce valuable services and products (Ruth et al., 2014), instead of charging power modulation, which would mean charging energy losses. The nuclear economic equation remains unsolved in the case of a new build when the load factor becomes too low. The capital share is too high for efficient use with such low load factors. The question appears more complex if we examine the case of already existing reactors. In systems with high shares of renewables that have a dispatch priority, load factors fall within the range where the competitiveness of nuclear begins to decline when up against gas combined cycles. In particular, these systems would benefit more from opting for the appropriate nuclear fleet replacement policy to compensate from the losses. In the end, the decision of maintaining nuclear power plants with low load factors would be highly linked with payments for balancing services. Future research should address this question in detail.
Thus, we recommend considering nuclear power modulation through the power use. In this case, nuclear power plants would be operated as a baseload and electricity would be supplied to the electric system when requested. For the remaining time, instead of reducing the plant
29 load, the output could be used to produce other valuable energy carriers, such as heat or hydrogen. Hydrogen is also a chemical product that has numerous outlets: ammonia production, refining activities and synthetic fuel production, as well as being a means to enhance connections between energy networks (e.g. power and gas, through power-to-gas). Finally, hydrogen also makes it possible to integrate high shares of low-carbon energy into a given mix by avoiding both the reducing of the baseload power such as nuclear and the restriction of non-dispatchable renewable energy (Caumon et al., 2015). Detailed business models nonetheless remain to be developed in this field. Systems comprising nuclear power plants together with a hydrogen process may propose new energy services such as hydrogen and power supply. What is more, implementing High-Temperature Steam Electrolysis (HTSE) processes in the longer term can make it possible to supply power as a baseload (thanks to the nuclear plant) and for peak demand (thanks to reversible HTSE operation) (Haratyk and Forsberg, 2012; Mougin et al., 2014). During high demand peaks, such a new concept would make it possible to use the power from the nuclear power plant, but also from the reversible electrolyser, thus acting as an energy storage solution and increasing the instantaneous power of the nuclear plant. Such systems could therefore meet both baseload and peak demands. This will be the topic of future research.
4. Conclusion and policy recommendations
The current French electricity mix is characterised by a high share of nuclear power on the one hand, and the seeking of new energy transition policies on the other hand. Developing low-carbon sources with complementary features is then a central issue which has to be addressed. Nuclear power flexibility is discussed as a way to move in this direction.
30 At first, the impact of renewable energy penetration on the nuclear load factors and its economic consequences were examined. From the operator’s viewpoint, the capital expenses must be amortised, hence the maximum load factor should be targeted. According to installed renewable and nuclear power in the mix, it became clear that significant revenue losses for the nuclear plant operator may result from high penetration rates of renewables.
However, the increasing share of non-dispatchable renewable energy means increasing needs for operational back-up. In economic terms, CCGT gas back-up is more competitive than nuclear in each of the studied scenario. Nonetheless, a carbon tax could smooth the gap. When compared with CCGT, a value as low as €100/tonneCO2 could change the trends, which is a point in favour of such incentives to avoid greenhouse gas emissions. The French Energy Transition Act (French Government, 2015) has set targets for the carbon price with a value of 56€/tonneCO2 in 2020 and 100€/tonneCO2 in 2030 in the form of a carbon tax on the consumption of energy products. In 2016, the carbon tax will equal 22€/tonneCO2. If the European Union (EU) Emission Trading System does not prove to give enough incentives, other ones could be considered such as a European standardized carbon tax. Today, industrials participating in the EU Emission Trading System are exempt from the carbon tax but could be subject to taxation in the future.
Additionally, nuclear back-up is all the more competitive as amortised power plants are used.
In this transition period, the differences in nuclear production costs between two nuclear fleet replacement policies were assessed with an academic approach. It was shown that a progressive shutdown (i.e. with a longer lifetime of PWRs compared with a shutdown after 40 years of operation) appears to be a relevant choice since it provides a lower nuclear power production cost from 2030 to 2050, even at reduced load factors, while contributing to load following and giving deciders more time before choosing the most sustainable technologies.
31 In other words, if nuclear power capacities are maintained contrary to political guidelines, it is worth opting for a progressive replacement of installed capacities (PWRs) by EPRs™ in order to cope with the intermittence of non-dispatchable and variable renewable sources. The French power mix specificities are an asset to be maintained if we wish to promote a very-low carbon power mix.
Then, complementarities and even synergies should be encouraged. Despite the fact that nuclear could participate in load following, especially in France since large variations in production could only be achieved by small increments in each power plant, making use of the available energy while operating at baseload would be more profitable. Conversely, even if excess non-dispatchable renewable energy could be curtailed, taking advantage of the excess power seems more fruitful.
For the social planner and plant operator viewpoints to coincide, we therefore recommend modulating the use of nuclear power rather than modulating the production of nuclear power. This would mean that nuclear power flexibility could accomplish two things with one action: available power would be converted into valuable services to the electric system and, at the same time, into valuable industrial products. In this respect, hydrogen seems especially worthwhile, given its multiple outlets and future specific position within the energy system.
In such a synergistic power system, both nuclear power plant flexibility and nuclear plant operation time extension should be examined, also by considering novel uses and other operational back-up options, such as storage or demand-side management tools, as contributors to the capacity back-up whose optimum solution remains to be established.
32
Acknowledgements
The authors would like to thank J. C. Bocquet, professor emeritus at CentraleSupelec - Université Paris Saclay, and J. G. Devezeaux de Lavergne, Head of the Institute for techno-economics of energy systems (I-tésé) for their fruitful discussions and supports.
References
ADEME, 2013. L’exercice de prospective de l’ADEME « Vision 2030-2050 ». Available at: <http://www.ademe.fr/sites/default/files/assets/documents/85536_vision_2030-2050_document_technique.pdf>.
AIEA, 2015. Power Reactor Information System (PRIS) database [Online]. Available at <https://www.iaea.org/pris/>. Accessed 11.30.15.
ANCRE, 2013. Scénarios de l’ANCRE pour la transition énergétique. Available at <http://www.allianceenergie.fr/page000100dc.asp?card=985>.
Barnacle, M., Robertson, E., Galloway, S., Barton, J., Ault, G., 2013. Modelling generation and infrastructure requirements for transition pathways. Energy Policy 52, 60–75. doi:10.1016/j.enpol.2012.04.031.
Barton, J., Huang, S., Infield, D., Leach, M., Ogunkunle, D., Torriti, J., Thomson, M., 2013. The evolution of electricity demand and the role for demand side participation, in buildings and transport. Energy Policy 52, 85–102. doi:10.1016/j.enpol.2012.08.040. Bezat, J.-M., 2015. Le réacteur EPR de Flamanville touché au coeur. Available at:
<http://www.lemonde.fr/economie/article/2015/04/07/nouvelles-difficultes-sur-le-reacteur-epr-de-flamanville_4610989_3234.html>.
33 Bruynooghe, C., Eriksson, A., Fulli, G., 2010. Load-following operation mode at muclear
power plants (NPPs) and incidence on operation and maintenance (O&M) costs. Compatibility with wind power variability (JRC Scientific and Technical Reports No. EUR 24583 EN). JRC European Commission.
Caumon, P., Lopez-Botet Zulueta, M., Louyrette, J., Albou, S., Bourasseau, C., Mansilla, C., 2015. Flexible hydrogen production implementation in the French power system: Expected impacts at the French and European levels. Energy 81, 556–562. doi:10.1016/j.energy.2014.12.073.
CEA, 2015. ELECNUC. Nuclear power plants in the world. CEA, France.
Choho, A.-M., 2013. Major innovations in PWR load follow opearations by AREVA. Atoms for the future 2013, France.
Connolly, D., Lund, H., Mathiesen, B.V., Leahy, M., 2010a. Modelling the existing Irish energy-system to identify future energy costs and the maximum wind penetration feasible. Energy 35, 2164–2173. doi:10.1016/j.energy.2010.01.037.
Connolly, D., Lund, H., Mathiesen, B.V., Leahy, M., 2010b. A review of computer tools for analysing the integration of renewable energy into various energy systems. Appl. Energy 87, 1059–1082. doi:10.1016/j.apenergy.2009.09.026.
Conseil National du Débat, 2013. Ministère de l’Ecologie, du Développement Durable et de l’Energie, French Ministry for Environment, Sustainable Development and Energy (MEDDE).Synthèse des travaux du débat national sur la transition énergétique de la France. Available at:
<http://www.developpement-durable.gouv.fr/IMG/pdf/dnte_synthese_web_bat_28-8.pdf>.
Cour des comptes, 2014. Le coût de production de l’électricité nucléaire. Actualisation 2014 (Rapport public thématique). Available at:
34 <https://www.ccomptes.fr/Publications/Publications/Le-cout-de-production-de-l-electricite-nucleaire-actualisation-2014>.
Dautremont, S., Colle, F.X., 2013. Modèle d’Allocations Efficientes des technologies de production de l’électricité (MAEL), Modélisation économique du système de production électrique français (Rapport I-tésé No. RT-2013-04). CEA DEN ITésé. Davis, C.D., Gotham, D.J., Preckel, P.V., Liu, A.L., 2013. Determining the impact of wind on
system costs via the temporal patterns of load and wind generation. Energy Policy 60, 122 – 131. doi:10.1016/j.enpol.2013.04.063.
Doherty, R., Outhred, H., O’Malley, M., 2006. Establishing the role that wind generation may have in future generation portfolios. IEEE Trans. Power Syst. 21, 1415–1422.
doi:10.1109/TPWRS.2006.879258.
EPEX SPOT, 2014. EPEX SPOT SE: Day-Ahead Auction database [Online]. Available at: <http://www.epexspot.com/en/market-data/dayaheadauction>. Accessed 11.30.15. European Commission, 2014a. Strategic Energy Technology (SET) Plan – Towards an
integrated Roadmap: Research & Innovation Challenges and needs of the EU Energy System. Available at:
<https://setis.ec.europa.eu/system/files/Towards%20an%20Integrated%20Roadmap_0 .pdf>.
European Commission, 2014b. Energy and climate goals for 2030. Available at: <http://ec.europa.eu/energy/en/topics/energy-strategy/2030-energy-strategy>. Accessed 11.27.15.
European Union, 2009. European Directive 2009/28/CE. Available at: <http://eur-lex.europa.eu/legal-content/FR/ALL/?uri=CELEX%3A32009L0028> Eurostat, 2015. Eurostat database [Online]. Available at:
35 French Government, 2015. LOI n° 2015-992 du 17 août 2015 relative à la transition
énergétique pour la croissance verte, 2015-992. Available at:
http://www.legifrance.gouv.fr/affichTexte.do?cidTexte=JORFTEXT000031044385&c ategorieLien=id.
French Ministry for the Environment, Sustainable Development and Energy, 2015. Chiffres clés du climat, France et Monde, édition 2015. Service de l’observation et des statistiques, Ministère de l’Ecologie, du Développement Durable et de l’Energie. Available at:
<http://www.statistiques.developpement-durable.gouv.fr/fileadmin/documents/Produits_editoriaux/Publications/Reperes/2014/r eperes-cc-climat-france-monde-ed-2015.pdf>.
Gross, R., Heptonstall, P., Anderson, D., Green, T., Leach, M., Skea, J., 2006. The costs and impacts of intermittency: an assessment of the evidence on the costs and impacts of intermittent generation on the British electricity network. UK Energy Research Centre, London.
Hand, M., Baldwin, S., DeMeo, E., Reilly, J., Mai, T., Arent, D., Porro, G., Meshek, M., Sandor, D., 2012. Renewable Electricity Futures Study. Volume 1: Exploration of High-Penetration Renewable Electricity Futures (No. NREL/TP-6A20-52409-1). NREL.
Haratyk, G., Forsberg, C.W., 2012. Nuclear-Renewables Energy System for Hydrogen and Electricity Production. Nucl. Technol. 178, 66–82.
Hart, E.K., Stoutenburg, E.D., Jacobson, M.Z., 2012. The Potential of Intermittent Renewables to Meet Electric Power Demand: Current Methods and Emerging
Analytical Techniques. Proc. IEEE 100, 322–334. doi:10.1109/JPROC.2011.2144951. Hoogwijk, M., Van Vuuren, D., de Vries, B., Turkenburg, W., 2007. Exploring the impact on
36 OECD Europe and the USA, results for wind energy. Energy 32, 1381–1402.
doi:10.1016/j.energy.2006.09.004.
Keane, A., Milligan, M., Dent, C.J., Hasche, B., D’Annunzio, C., Dragoon, K., Holttinen, H., Samaan, N., Söder, L., O’Malley, M., 2011. Capacity Value of Wind Power. IEEE Trans. Power Syst. 26, 564–572. doi:10.1109/TPWRS.2010.2062543.
Keppler, J.H., Cometto, M., 2012. Nuclear energy and renewables: system effects in low-carbon electricity systems. OECD/NEA.
Lokhov, A., 2011. Technical and economic aspects of load following with nuclear power plants. OECD/NEA.
Lokhov, A., Dufresne, L., Giraud, A., 2012. The economics of long-term operation of nuclear power plants. OECD/NEA.
Luickx, P.J., Delarue, E.D., D’haeseleer, W.D., 2008. Considerations on the backup of wind power: Operational backup. Appl. Energy 85, 787–799.
doi:10.1016/j.apenergy.2007.10.011.
Mougin, J., Reytier, M., Di Iorio, S., Chatroux, A., Petitjean, M., Cren, J., Aicart, J., 2014. Stack performances in high temperature steam electrolysis and co-electrolysis. 2014 World Hydrogen Energy Conference, South Korea.
Perez-Arriaga, I.J., Batlle, C., 2012. impacts of intermittent renewables on electricity generation system operation. Econ. Energy Environ. Policy 1. doi:10.5547/2160-5890.1.2.1.
RTE, 2015a. Eco2mix, RTE database [Online]. Available at: <http://www.rte-france.com/fr/eco2mix/eco2mix>. Accessed 11.30.15.
RTE, 2015b. RTE database - Portail clients - Production réalisée par groupe [Online]. Available at:
37 RTE, 2014. Bilan prévisionnel de l’équilibre offre-demande d’électricité en France, ed. 2014.
Available at: <http://www.rte-france.com/sites/default/files/bilan_complet_2014.pdf>. Ruiz Gomez, L.M., 2012. Intégration de la production éolienne aux réseaux électriques :
approches techniques et économiques. Université de Grenoble, France.
Ruth, M.F., Zinaman, O.R., Antkowiak, M., Boardman, R.D., Cherry, R.S., Bazilian, M.D., 2014. Nuclear-renewable hybrid energy systems: Opportunities, interconnections, and needs. Energy Convers. Manag. 78, 684–694. doi:10.1016/j.enconman.2013.11.030. Salvadores, M.S., Keppler, J.H., 2010. Projected costs of generating electricity, IEA,
OCDE/NEA.
Skea, J., Anderson, D., Green, T., Gross, R., Heptonstall, P., Leach, M., 2008. Intermittent renewable generation and the cost of maintaining power system reliability. IET Gener. Transm. Distrib. 2, 82. doi:10.1049/iet-gtd:20070023.
CO2 market website, Thomson Reuters, 2015 [Online]. Available at:
<http://financial.thomsonreuters.com/en/resources/articles/point-carbon.html>. Accessed 11.30.15.
Ueckerdt, F., Hirth, L., Luderer, G., Edenhofer, O., 2013. System LCOE: What are the costs of variable renewables? Energy 63, 61–75. doi:10.1016/j.energy.2013.10.072. Wagner, F., 2012. Feature of an electricity supply system based on variable input (No. IPP
18-1). Max Planck Institute of Plasma Physics.
Wan, Y., 2011. Analysis of Wind Power Ramping Behavior in ERCOT.pdf (No. NREL/TP-5500-49218). National Renewable Energy Laboratory.
Wittenstein, M., Rothwell, G., 2015. Projected costs of generating electricity. IEA, OCDE/NEA.