HAL Id: halshs-00552213
https://halshs.archives-ouvertes.fr/halshs-00552213
Preprint submitted on 5 Jan 2011
HAL is a multi-disciplinary open access archive for the deposit and dissemination of sci-entific research documents, whether they are pub-lished or not. The documents may come from
L’archive ouverte pluridisciplinaire HAL, est destinée au dépôt et à la diffusion de documents scientifiques de niveau recherche, publiés ou non, émanant des établissements d’enseignement et de
Exchange Rate
Jean-Louis Combes, Patrick Plane, Tidiane Kinda
To cite this version:
Jean-Louis Combes, Patrick Plane, Tidiane Kinda. Capital Flows and their Impact on the Real Effective Exchange Rate. 2011. �halshs-00552213�
Document de travail de la série Etudes et Documents
E 2010.32
Capital Flows and their Impact
on the Real Effective Exchange Rate
Jean-Louis Combesa, Tidiane Kindab, Patrick Planec,*
novembre 2010
a
Clermont University, University of Auvergne, Centre d’Etudes et de Recherches sur le Développement International, CERDI-CNRS, 65, bd François Mitterrand, 63000 Clermont-Ferrand, France -
j-l.combes@u-clermont1.fr - Tel. : 33 4 73 17 74 00 - fax : 33 4 73 17 74 28
b
African Department, IMF, 700 19th Street N.W., Washington DC 20431, USA, tkinda@imf.org
*
Corresponding author: c Clermont University, University of Auvergne, Centre d’Etudes et de Recherches sur le Développement International, CERDI-CNRS, 65, bd François Mitterrand, 63000 Clermont-Ferrand, France, patrick.plane@u-clermont1.fr
Acknowledgments
The authors acknowledge helpful comments and suggestions from Andrew Berg, Hamid Davoodi, Jaime de Melo, Gérard Duchêne, Mauro Mecagni, Brett Rayner, participants at the 58th French Economics Association (AFSE) annual conference, participants at the IMF (AFR) external sector network seminar, and participants at the European Research Group (GDR) Workshop on exchange rates in emerging and transition countries. Anne Grant provided useful editorial comments.
Abstract
This paper analyzes the impact of capital inflows and the exchange rate regime on the real effective exchange rate. A wide range of developing countries (42 countries) is considered with estimation based on panel cointegration techniques. The results show that both public and private inflows cause the real effective exchange rate to appreciate. Among private inflows, portfolio investment has the biggest effect on appreciation, almost seven times that of foreign direct investment or bank loans, and private inflows have the smallest effect. Using a de facto measure of exchange rate flexibility, we find that a more flexible exchange rate helps to dampen appreciation of the real effective exchange rate caused by capital inflows.
Keywords: Private capital flows, real effective exchange rate, exchange rate flexibility, emerging markets, low-income countries, pooled mean group estimator
1. Introduction
Policymakers in developing countries often seek to attract external resources on the assumption that they will finance savings gaps and promote growth and economic development (Dornbusch, 1998). However, evidence of the growth potential of capital account openness is mixed (Kose et al., 2006). Moreover, significant increases in capital inflows can make the financial system more vulnerable by exacerbating maturity mismatches between bank assets and their liabilities, and in some cases, mismatches between the
currencies in which banks lend and borrow. In addition, macroeconomic overheating can provoke accelerated inflation with possible price bubbles appreciating the real effective exchange rate (REER).
The loss of competitiveness caused by an appreciated REER is one of the main negative consequences associated with capital inflows (Calvo, Leiderman, and Reinhart, 1993; Bandara, 1995; Edwards, 1998; Agenor, 1998; Lartey, 2008). Where the exchange rate regime is flexible, real appreciation is due to appreciation of the nominal exchange rate. Where the exchange rate is fixed, real appreciation is due to a rise in inflation after the money supply increases. Real appreciation undermines competitiveness, widens the current account deficit, and increases vulnerability to a financial crisis. Significant appreciation can lead to a sudden drying up of capital flows, causing an abrupt adjustment of the current account. Beyond its negative effect on investment, significant real appreciation could thus create major problems for macroeconomic management.
The surge in external financing to developing countries, particularly private flows, over the last decade and up to the current financial crisis, sheds some light on the “transfer problem”. The “transfer problem” refers to the impact of capital inflows or outflows on the domestic economy - which is mainly observed through changes in the REER.
The spectacular rise in private inflows in recent years was driven by foreign direct investment (FDI) and current private transfers, mainly remittances. While commercial bank loans constituted the main component of private capital flows to developing countries in the mid-1980s, later on FDI and remittances replaced them, particularly in low-income countries. Portfolio investments have been a significant part of private capital flows to emerging
countries since the 1990s. These changes in the landscape of capital flows to developing countries underline the importance of reassessing the transfer problem, by looking particularly at the components of private flows.
Most studies analyze the effect of aggregated capital inflows on the REER, however this paper proposes a comprehensive analysis of the impact on the REER of different forms of private capital flows (FDI, portfolio investment, bank loans, and private transfers).
Developing countries use a variety of macroeconomic tools to dampen appreciation of their REER caused by capital inflows. One of these tools is exchange rate flexibility (IMF, 2007), and this paper questions whether such a policy is effective.
Using a sample of 42 developing countries for the period 1980–2006, we apply the pooled mean group estimator that allows short-run heterogeneity while imposing long-run
homogeneity on the REER determination across countries. The results show that whatever their institutional status, public or private, aggregated capital inflows are positively correlated with appreciation of the REER. Among private flows, portfolio investment has the highest appreciation effect- almost seven times that of FDI or bank loans. Private transfers have the least effect. The de facto measure of exchange rate flexibility allows us to conclude that a more flexible exchange rate could effectively dampen the real appreciation stemming from capital inflows.
The rest of this paper is organized as follows: Section II stresses potential heterogeneity by type of capital flow and discusses the role played by the exchange rate regime. Section III describes the main trends and composition of external financing for developing countries. Section IV presents the pooled mean group estimator and the dataset. Section V analyzes the results, and in Section VI conclusions are drawn.
2. Composition of capital inflows, exchange rate regime, and the real
effective exchange rate
Edwards (1989, 1994), Williamson (1994), Hinkle and Montiel (1999), Edwards and Savastano (2000), and Maeso-Fernandez, Osbat, and Schnatz (2004) provide comprehensive surveys of the extensive literature on determinants of the REER. A number of studies look at the impact of capital flows on the REER – the so-called “transfer problem”. Capital inflows generate increased demand for both tradables and non-tradables and lead both to a higher relative price of non-tradables, and to real appreciation. This is necessary so that domestic resources will be diverted to production of non-tradables to meet the increased demand.
As the next section establishes, net capital inflows to developing countries have increased dramatically since the 1980s, with private flows growing in influence, particularly in middle-income countries. As Lane and Milesi-Ferretti (2004) reported, based on an econometric analysis of 48 countries, net external liabilities go hand in hand with real depreciation. Lee, Milesi-Ferretti, and Ricci (2008) showed that higher net foreign assets cause the REER to appreciate. In other words, external capital allows expenditure to exceed income, generating excess demand for non-tradables. This effect has to be qualified, however, for at least two reasons: (1) the REER can be affected differently depending on the composition of capital inflows, and (2) the type of exchange rate regime may alter the effect of capital inflows on the REER.
2.1. Composition of Capital Inflows and the REER
The standard specification of the exchange rate determination model suggests that all capital inflows have a similar impact on the exchange rate which allows testing of an average effect through an aggregate flow. Although there is as yet little relevant empirical work, this hypothesis is debatable. Some authors, following the pioneering work by Elbadawi and de Soto (1994), have recently (with mixed results), hypothesized specific impacts of some of the capital components. The majority of the work deals with foreign aid, which was the main capital inflow of most developing countries until the 1990s. Some studies bring attention to FDI, but also to portfolio investment and other short term capital movements, which increase with both the liberalization of capital transactions and the degree of convertibility of the
currency. The dynamics of globalization, including labor movements, also enhances international migrations and thus the increase of remittances which have the effect of a significant transfer for some developing countries.
Official flows generally tend to be associated with a real appreciation (Kasekende and Atingi-Ego, 1999; Bulir and Lane, 2002; Prati, Sahai, and Tressel, 2003; Lartey, 2007; Elbadawi, Kaltani, and Schmidt-Hebbel, 2008) although not all the studies are conclusive on this point (Li and Rowe, 2007; Hussain, Berg, and Aiyar, 2009; Mongardini and Rayner, 2009). In Cerra, Tekin, and Turnovsky (2008), foreign aid goes hand with a real appreciation only if it enhances productivity in the tradable sector. Where foreign aid is channeled to improve productive capacity in the non-tradable sector, the authors find evidence of real depreciation.
The impact of official inflows on the REER seems to depend mainly on how resources are used. Assuming that a significant part of official flows is targeted to enlarge basic
infrastructure, the relative contribution of domestic consumption to global expenditure should be considered as an important factor of the exchange rate evolution. Where there are supply constraints, capital inflows associated with higher consumption put more pressure on the relative price of domestic goods than capital inflows associated with higher investments and with a significant content of imported goods.1
1 The structure of consumption also influences its effect on the REER: A larger share of traded goods in public or private consumption affects the REER differently.
Studies dealing with the impact of private flows on the REER provide mixed results. Athukorala and Rajapatirana (2003) show that FDI inflows are associated with a real depreciation. However the impact differs from one region to another: the magnitude of the real depreciation is smaller for Latin America compared to that for the entire country sample. Instead Saborowski (2009) suggests that in developing countries capital inflows, particularly FDI, lead to a real appreciation but this effect is attenuated if the economy disposes of a deep financial sector. Lartey (2007) finds that FDI causes the REER to appreciate, but the
probably varies according to the type of operation. When FDI is related to imported machinery and equipment for the accumulation process these imports do not suffer from constraints in local supply capacity; and thus, there is almost no appreciation effect to cause exchange rate disequilibrium. On the contrary, FDI has positive effects on productivity, and the efficiency of domestic resource utilization, through transfers of technology, managerial know-how and other intangible assets (Agenor, 1998, Javorcik, 2004, Kinda, 2008, 2009). Counterbalancing this argument, FDI may also consist of pure transfers of domestic assets between residents and non-residents, as illustrated by the implementation of some national privatization programs. The one time only revenues or bonanzas resulting from selling public enterprises can be channeled into permanent and current expenditures increasing the price of non-tradables.
In comparison with long-term capital movements, the impact of short-term inflows is more debatable. Commercial bank loans and international portfolio investments can be seen as temporary or reversible transactions consistent with unit root tests, suggesting that in most countries short-term capital inflows are a stationary variable and do not affect the long run evolution of the REER (Elbadawi and de Soto,1997). It should noted that for some countries, especially those where the capital account has been liberalized, these variables may have a trend or be part of a long run cycle, contrasting with presumed short run reversibility; and in this case, both a real appreciation and an exchange rate disequilibrium may appear. This effect potentially extends to all kinds of short run inflows as these transactions are more intermediated by domestic banks than FDI.
Remittances resulting from private international transfers can be assimilated to capital inflows. The impact of these transactions on the REER seems to depend on whether they are procyclical or not. On the one hand, remittances act as a buffer, helping to smooth
consumption, if these transfers increase when the recipient economy is suffering an economic downturn (Lueth and Ruiz-Arranz, 2007; Chami et al., 2008). In this case, transfers help to keep recipient economies stable by compensating for foreign exchange losses due to macroeconomic shocks. These countercyclical remittances do not have much effect on the
REER. On the other hand, remittances for investment purposes2 can be procyclical, exacerbating macroeconomic overheating and driving the REER to appreciate further. In some developing countries procyclical remittances spent on real estate have increased input prices, giving rise to construction booms. When more of the remittances are spent on traded goods (e.g. imported consumer durables), their effects on the REER tend to be weaker (Chami et al., 2008). Although the effect of private transfers or remittances on the REER is generally suggested by economic theory, in fact the empirical results are mixed (Chami et al., 2008). Bourdet and Falck (2006), Amuedo-Dorantes and Pozo (2004), Montiel (2006), and Saadi-Sedik and Petri (2006), among others, find that remittance inflows cause the REER to appreciate. Rodrik (2008), also defends the idea that competitive exchange rate policies proved difficult in some countries such as Jordan and Egypt. In these Middle Eastern economies the international competitiveness of domestic producers would suffer from a perverse effect of the remittances from Gulf Arab states. Counterbalancing these views, Izquierdo and Montiel (2006), as well as Rajan and Subramanian (2005) are not able to conclude unequivocally that remittances are associated with REER appreciation.
2.2. Exchange Rate Regime and the real appreciation effect of capital inflows
It is worth analyzing the role of the exchange rate regime that potentially interacts with capital inflows according to the flexibility of the exchange rate system and the degree of the convertibility of the currency. In the 1970s, academic debate focused exclusively on a binary choice between floating or fixed exchange rates. Although such a duality has analytic
convenience, the present reality is much more complex, as suggested by the distinction between de jure and de facto classifications, which expands the number of regime categories. In addition, in the context of a liberalization of capital transactions, the choice of the
exchange rate regime may interact with capital flows as the dynamic of these transactions may potentially enhance some short to medium term exchange rate movements that are not necessarily consistent with what the real economy needs.
2 The theoretical determinants of remittances said Lucas and Stark (1985) in their seminal paper, are pure altruism, pure self-interest, and tempered altruism (enlightened self-interest). Pure altruism remittances are driven by the income needs of a migrant’s family at home; pure self-interest remittances are driven by investment motives. In tempered altruism both drive remittances.
With a fixed exchange rate, capital inflows potentially increase inflation. The scope of these pressures depends on whether inflows are driven by autonomous factors, or by an increase in domestic money demand, and also on the policy response to the inflows. In a number of countries, a surge in capital flows led to a credit boom when monetary authorities failed to sterilize them. There, higher money supply and inflationary pressures spread within the economy, contributing to an increase in the relative price of non-tradables. A sterilization policy can dampen real appreciation, but recognition of the “perils of sterilization” (Calvo, 1991) led to doubt about its feasibility. Indeed, when the exchange rate is fixed, a
sterilization policy leads to higher interest rates and to additional capital inflows. Moreover, holding foreign assets with lower interest rates than domestic ones generates quasi-fiscal losses for central banks, leading them to give up the policy in the medium or long term.
With a floating exchange rate, capital inflows lead to an appreciation of the nominal exchange rate. Exchange rate flexibility ensures that monetary policy is partially independent of capital inflows.By introducing uncertainty, a more flexible exchange rate is able to discourage short-term speculative flows and reduce financial system vulnerability, particularly when supervision and regulation are poor (Calvo, Leiderman, and Reinhart, 1996; Lopez-Mejia, 1999). Hence, a flexible exchange rate regime would penalize the capital flows that generate the most real appreciation. However, a pure flexible exchange rate could be a problem if the rate resulting from all types of capital inflows differs from the long-term equilibrium rate required for the production of tradable goods. Appreciation of the nominal exchange rate may have a significant impact on the real sector, necessitating central bank interventions to limit perverse effects and useless reallocation of productive resources within the economy.
Although some monetary instruments might prevent the undesired real economic effects of a nominal appreciation of the exchange rate, with a managed floating exchange rate system it is difficult to go against market forces for long. That is also true for a fixed system, the efficiency of which is conditional on the possibility that the monetary authorities will neutralize inflows of external assets. Intermediate regimes can offer some flexibility. In countries with an intermediate exchange rate regime, authorities aim for a specific level of nominal exchange rate and monetary aggregate, and reserve accumulation becomes a policy instrument. Holding to a specified nominal exchange rate with intervention by accumulating
more reserves lowers the pressure on the nominal exchange rate and may raise inflation. By contrast, small-scale interventions, with authorities accumulating fewer reserves, can raise pressure on the nominal exchange rate and lower inflation.
To test the impact of the exchange rate regime on the REER several indicators are
possible, the spectrum being more complex than suggested by the de jure classification. We approximate the flexibility of the exchange rate using an index based on the idea of exchange
market pressure (EMP).The degree of exchange market pressure (EMP1) is derived from a
relationship between the nominal exchange rate and relative foreign reserves:3
1 % i t, / (% i t, % i t,) EMP = ∆e ∆e + ∆f , where: , , 1 , , 1 i t i t i t i t er er e abs er − − − ∆ =
eri,t is the nominal exchange rate of country i currency with the
US dollar during year ; abs denotes the absolute value; and %∆ei t, is the relative variation of
the nominal exchange rate (∆ei t, ) expressed as a percentage.
(
, , 1)
, , 1 i t i t i t i tabs RES RES f
MB
−
−
−
∆ = RESi,t represents reserve assets, and MBi,t the monetary base
in country i during year t.
In the hypothetical case of a pure floating system with no intervention on reserves (∆ = ), the EMP index is equal to 1, reflecting maximum flexibility, the exchange rate f 0 being allowed to float freely. Changes in the EMP index reflect only changes in the nominal exchange rate. With a hard peg, the exchange rate is constant (∆ = ) and the EMP index is e 0 equal to 0. Changes in the index reflect only changes in reserves through monetary authority intervention. Intermediate cases indicate less exchange rate flexibility or more intervention in the foreign exchange market. More volatility of foreign reserves reduces the EMP. This suggests that the monetary authorities are using foreign reserves to limit variation in the
3 For more details on theoretical and practical issues related to EMP indices, see Girton and Roper (1977); Tanner (2001); Pentecost, Van Hooydonk, and Van Poeck (2001); Guimaeres and Karacagdag (2004); Cavoli and Rajan (2007); and IMF (2007).
nominal exchange rate.4 Some practical problems potentially arise with this index as its range is limited to between zero and one. For example, for∆ = , there exists an infinity of f 0
solutions that potentially give different interpretations with an indicator systematically taking the value 1. Indeed, the exchange rate proves flexible even if its nominal variation∆ei t, is infinitesimal. The same conclusion applies if, on the contrary, its variation is large. An alternative measure of the EMP index (EMP2) is to subtract the change of foreign exchange reserves from the change in nominal exchange rate as follows:
2 i t, i t,
EMP = ∆e − ∆f .
During previous episodes of capital inflows (before the Debt and Asian crises), high flexibility of the exchange rate reflected large current account deficits. The wave of capital inflows that began early in the 2000s, however, has been associated with a lessening of exchange rate flexibility, particularly in 2005, reflecting policy intervention with reserve accumulation.
The dataset consists of annual observations for 42 developing countries for 1980–2006. While data availability guided the choice of countries, the sample gives representative
coverage of developing countries by including emerging and low-income countries as well as countries from the main developing regions.5
3. External financing in developing countries
Aggregated total capital flow is the sum of public and private flows, using data from the
World Economic Outlook. Private capital flows are the sum of four elements:
. Direct investment in the reporting economy from abroad (FDI), including debt-creating liabilities to foreign investors and direct investment in the form of equity
. Portfolio investment (PIL), which is the sum of debt instruments issued by the domestic private sector (corporate bonds and other private debt securities) and foreign purchases of equities of domestic companies
4 Changes in reserves could also be due to valuation changes rather than to policy intervention. Availability of data on the currency composition of reserves could help to address this possibility.
. Current private transfers6 (PRT)
. Liabilities to foreign banks (LFB)7
Public flows are the sum of official loans (OL) and official current transfers (OT). Official loans are the sum of official liabilities: IMF credits (BFOLG), debt instruments (such as government bonds issued by the domestic public sector) (BFPLDG), and debt forgiveness in the capital account (including relief granted by the IMF )(BKFO). To get a more precise picture of the net resources effectively transferred in each country, interest paid on all debt (DSI) is deduced from the OL.8
Private flows Net Transfers on Debt
Public Flows
Nettotal external financing FDI PIL LFB PRT BFOLG BFPLDG BKFO DSI PUT=1444424444+ + + 3 144444424444443+ + + − +
1444444442444444443
Using the estimates of total external financing, the following section reviews trends in the composition of external financing. Note that payment of interest on debt, which for
presentation purposes is represented as “other capital inflows,” actually constitutes a capital outflow.
6 Remittances are not adequately defined in the balance of payments (BOP). Remittances are part of three items in the BOP, but none refers exclusively to remittances. Following Dorsey et al. (2008) we use private current transfers as a proxy for remittances; workers’ remittances account for three-quarters of private transfers in the BOP for low income countries. The other items that include a small part of remittances—which are not represented in our proxy—are income credits or net income that includes compensation of employees. Another component of remittances included in the capital account is migrant transfers. Since the BOP data disaggregate capital transfers only into debt forgiveness and other capital transfers, estimating migrant transfers is very challenging. Private transfers could thus underestimate or overestimate remittances depending on the importance of employee compensation, migrant transfers, and the part of private transfers that is not remittances. See Reinke (2007) and Dorsey et al. (2008) for a comprehensive analysis of remittance measurement and definition issues related to using BOP data.
7 Total private flows also include other liabilities in the form of other loans, currency, and deposits, which are on average null between 1990 and 2004 in our sample countries. These flows consist of net outflows and net inflows, depending on country and year.
8 Items in the financial account measure net changes in stocks that could be due to new lending, amortization, and to some extent debt forgiveness.
Figure 1. External Financing in Developing Countries
(Sample of 42 countries analyzed) All Countries
Private Capital Flows Public Capital Flows
0 2 4 6 8 in p e rc e n ta g e o f G D P 1981-84 1986-89 1990-94 1995-1999 2000-04 2005-06
Private transfers Foreign Direct Investment Portfolio Investment Commercial Bank Loans
0 1 2 3 4 in p e rc e n ta g e o f G D P 1981-84 1986-89 1990-94 1995-1999 2000-04 2005-06 Official Loans Official Transfers Debt Interest
Low-Income Countries
Private Capital Flows Public Capital Flows
0 2 4 6 8 1 0 in p e rc e n ta g e o f G D P 1981-84 1986-89 1990-94 1995-1999 2000-04 2005-06 Private transfers Foreign Direct Investment Portfolio Investment Commercial Bank Loans
0 2 4 6 8 in p e rc e n ta g e o f G D P 1981-84 1986-89 1990-94 1995-1999 2000-04 2005-06 Official Loans Official Transfers Debt Interest
Private capital flows have steadily increased since the 1980s, but public flows have been decreasing. From less than 2% GDP just after 1980, private flows increased to more than 6% in 2005/6. The increase is even more dramatic in low-income countries, where for 2005/6 private flows represent almost 10% of GDP—well beyond the 1.5% at the beginning of the 1980s. In recent years private capital flows have largely been dominated by FDI, followed by private transfers (remittances) and portfolio investment. In low-income countries the marked increase in private flows is mainly due to private transfers, which increased from less than 2% of GDP at the beginning of the 1980s to more than 6% in 2005/6. FDI in low-income countries also increased, from less than 1% of GDP in the 1980s to almost 4 percent in 2005/6.9
A favorable economic and investment climate, characterized by solid growth, moderate inflation, and sound infrastructure, facilitates productive activities that attract foreign investment. The factors driving the surge in remittances are more complex. The significant increase may be due to changes in the host or home country economy, reductions in transfer fees, or simply better-quality data (Dorsey et al., 2008).
Commercial bank loans have become insignificant, particularly in low-income countries, since the financial crises of the 1990s. Meanwhile, although portfolio investments have been negligible for low-income countries, they have been significant for emerging economies, especially recently (Figure A.1). Private flows have surpassed the public flows (grants and official loans) that were the main source of capital for low-income countries. While public flows have fallen in all countries, there is an indication that grants are replacing loans in low-income countries, which is consistent with donor commitments.
Figure 2 illustrates the trend of the unweighted mean of the REER and of total capital inflows for the sample of 42 developing countries.10 On average, periods of reduced capital inflows are associated with depreciation of the REER, and periods of increased flows with appreciation.
9 Using a sample of low-income countries, Dorsey et al. (2008) find the same trend and composition of external financing. The similarity is even stronger for our sample of low-income countries.
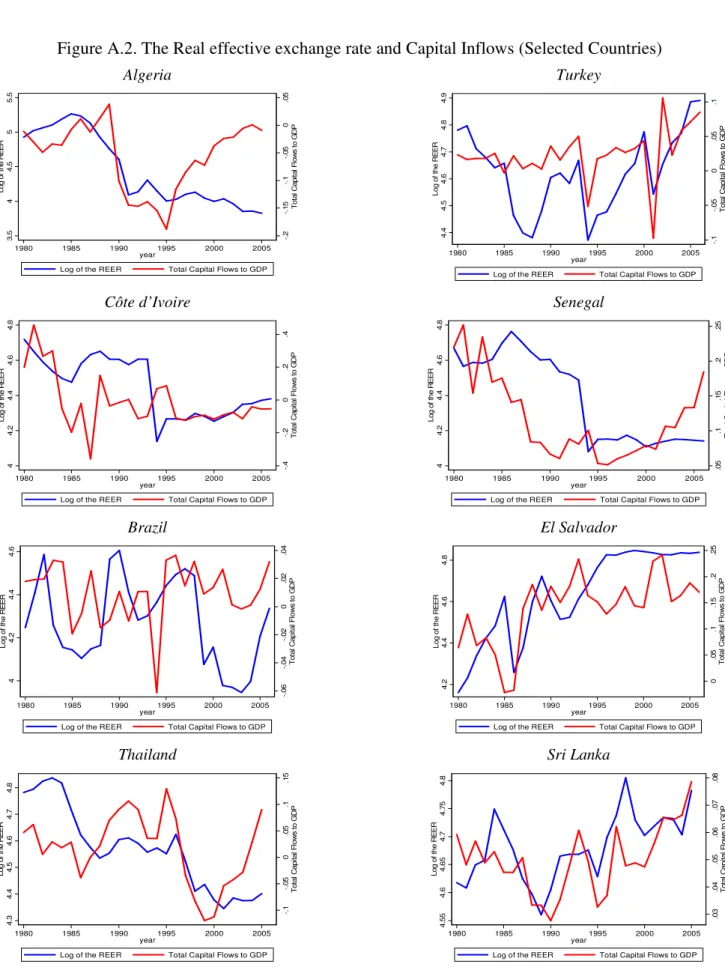
10 Total capital flows are total external financing excluding the payment of interest on debt. The ten countries shown in Figure A.2 reflect accurately the situation in different categories of developing countries and provide support for the trend of capital inflows and REER.
Figure 2. The REER and Capital Inflows
(Unweighted mean for a panel of 42 countries)
0 .0 5 .1 .1 5 T o ta l C a p it a l F lo w s t o G D P 4 .4 4 .5 4 .6 4 .7 4 .8 4 .9 L o g o f th e R E E R 1980 1985 1990 1995 2000 2005 year
Log of the REER Total Capital Flows to GDP
The following econometric analysis gives a clearer picture of the potential positive correlation between the REER and capital inflows shown in the graphical analyses.
4. ECONOMETRIC MODEL
Two estimation approaches are commonly used with dynamic panel data models. The first consists of averaging separate estimates for each group in the panel. According to Pesaran and Smith (1995), the mean group estimator provides consistent estimates of the parameter averages. It allows the parameters to be freely independent across groups and does not consider potential homogeneity between groups. The second is the usual pooled approach; examples are the random effects, fixed effects, and GMM methods.These models force the parameters (coefficients and error variances) to be identical across groups, but the intercept can differ between groups. GMM estimations of dynamic panel models may lead to
inconsistent and misleading long-term coefficients, a possible problem that is exacerbated when the period is long (Pesaran, Shin, and Smith, 1999).
Pesaran, Shin, and Smith (1999) propose an intermediate estimator that allows the short-term parameters to differ between groups while imposing equality of the long-short-term
coefficients.The long-term movements of the REER and other macroeconomic fundamentals
to be country-specific.The null hypothesis of homogeneity in the long-term coefficients can be verified with a Hausman (1978) test.The dynamic heterogeneous panel model of Pesaran, Shin, and Smith (1999) is an unrestricted error correction autoregressive distributed lag (ARDL) (p,q) representation. 1 1 ' ' , 1 , 1 , , 1 0 p q it i i t i i t ij i t j ij i t j i it j j y φ y β x λ y δ x µ ε − − − − − − = = ∆ = + +
∑
∆ +∑
∆ + + (1)The cross-section units (countries) are denoted by i = 1, 2, …, N; t = 1, 2, …, T represent time periods; yitis the dependent variable;xitthe matrix of regressors ;µi the fixed effects; φi the coefficient on the lagged dependent variable; βi the vector of coefficients on the
explanatory variables; λijthe coefficients on the lagged first-differences of the dependent variable; and δijthe coefficients on the first-differences of the explanatory variables and their lagged values. The disturbances, εit, are supposed to be normally and independently
distributed across i and t with zero mean and variancesσi2 > . 0
With φi < , there is a long-term relationship between 0 y and it x in the form: it
' it i it it y =θ x +η i=1, 2, …, N t= 1, 2, …, T (2) where ' ' i i i β θ φ
= − represents the long-term coefficient, and the error terms of the long-term relationship (ηit) are stationary. It is worth noting that on a large sample the existence of a long run or cointegration relationship excludes the omitted variable bias.
Considering the long-term relationship, equation 1 can be written as:
1 1 ' , 1 , , 1 0 p q it i i t ij i t j ij i t j i it j j y φη λ y δ x µ ε − − − − − = = ∆ = +
∑
∆ +∑
∆ + + (3) The error correction term,ηi t, 1− , is derived from the long-term equation (2), and theassociated coefficient, φi, measures the speed of adjustment to long-run equilibrium. By allowing short-term coefficients, intercepts, and error variances to differ between groups and by constraining long-term coefficients to be identical (θi'= ), the pooled mean θ
pooled likelihood estimators defined as ^ i φ , ^ i β , ^ ij λ , ^ ij
δ , and ˆθ, the pooled mean group estimators are given by:
1 ˆ ˆ N i i PMG N φ φ = =
∑
, 1 ˆ ˆ N i i PMG N β β = =∑
(4) 1 ˆ ˆ N ij i jPMG N λ λ = =∑
, j =1, …, p-1, 1 ˆ ˆ N ij i jPMG N δ δ = =∑
, j=0, …, q-1 (5) ˆ ˆ PMG θ = (6) θMore specifically, the long-term relationship between the REER and macroeconomic fundamentals is given by the following relation:
0 1 2 3 4
it it it it it it
REER =θ +θTOT +θ PROD +θTRADE +θ CAPITAL +ν (7)
i = 1, 2,…,N t = 1, 2, …,T
where REERit is the real effective exchange rate; TOTit the terms of trade; TRADEit the ratio of exports and imports to GDP; PRODit the productivity gap; and CAPITALit the ratio of total external financing to GDP (see Table A.1. and Table A.2. for the list of variables and
summary statistics).
The REER in the analysis is a CPI-based real effective exchange rate, defined as a
weighted geometric mean of the bilateral nominal exchange rate and consumer price indices. An increase in the REER indicates an appreciation, and hence a potential loss of
competitiveness. The REER of a country i is defined as
10 1 wj i i i j j CPI REER NEER CPI = = ×
∏
with:(
)
10 1 wj i j NEER NBER = =∏
With REERi representing the real effective exchange rate, NEERi, the nominal effective exchange rate, and NBERi the nominal bilateral exchange rate of country i with regard to the currencies of country j, CPIi and CPIj denote the consumer price indexes of country i and country j, and wj is the weight of the j-th partner in the bilateral trade of country i for 1996– 2003. The analysis considers the 10 main trade partners, excluding countries for which
petroleum-related products represent at least 50% of exports. Weights are calculated at the end of the period of observation in order to focus on the competitiveness diagnosis for the most recent years. This choice makes it possible to take into account the significant increase in the weight of international trade of some large emerging economies, such as China, India, or Brazil, in recent years. The increasing importance of these large emerging-market trade partners is even more pronounced for other developing countries.
The productivity gap aims to capture the potential Balassa-Samuelson effect. It is defined as a country’s GDP per capita relative to the weighted average GDP per capita of its trading partners. The weights of the partner countries are similar to those used in constructing the REER. The Balassa-Samuelson effect assumes that productivity grows faster in tradable than in non-tradable sectors. This results in higher wages in tradable sectors, which spill over to non-tradable sectors and put upward pressure on wages. Since prices in tradable sectors are internationally determined and homogeneous across countries, higher wages in non-tradable sectors result in a higher relative price for non-tradables. This implies an increase in domestic inflation and an appreciation of the REER.
A rise in the terms of trade is expected to cause the equilibrium REER to appreciate to the extent that it improves the trade balance—the income effect dominates the substitution effect.
Trade openness also affects the prices of non-tradables through income and substitution effects. Increasing restrictions on trade has a negative effect on the price of tradables through the income effect, and a positive effect through the substitution effect, so the income effect is less likely to dominate (Edwards, 1988). It is thus expected that restricting trade will push down the price of tradables relative to non-tradables, leading to appreciation of the equilibrium REER.
Assuming that all variables are I(1) and co-integrated, vit is supposed to be I(0) for all i and is independently distributed across t. With a maximum of one lag11 for all variables, the equilibrium error correction representation of the ARDL(1, 1, 1, 1, 1) model is
, 1 0 1 2 3 4
1 2 3 4
it i i t it it it it
i it i it i it i it it
REER REER TOT PROD TRADE CAPITAL
TOT PROD TRADE CAPITAL
φ θ θ θ θ θ δ δ δ δ ε − ∆ = − − − − − − ∆ − ∆ − ∆ − ∆ + (8)
11 The choice of lag length is based on the literature on the determinants of the real exchange rate and confirmed by the Akaike Information Criterion (AIC).
Since we are studying long-run relationships, the coefficients of primary interest are the θ. In the first part of the analysis, the interest variable, CAPITAL, will be disaggregated to assess the differential impact of each type of capital flow on the REER. Later, to assess the effectiveness of exchange rate policy as a hedge against real appreciation due to capital inflows, we will add into equation 8, the error correction equilibrium representation, an exchange rate flexibility variable and its cross-term (with capital inflow variable).
5.ECONOMETRICRESULTS
Before presenting the results of the cointegration analysis, we first validate that the variables are non-stationary and cointegrated.Table A.3 presents the unit root tests on the REER and other variables. These tests confirm that almost all variables are non-stationary and could be considered as integrated of order one.As a second step, we test whether there is a long-term relationship between the variables of the baseline specifications. Following Pedroni (2001), various cointegration tests (Panel rho, Panel ADF, Group rho, Group ADF, etc.) confirm the existence of a cointegrating vector in all cases. This result is consistent with the negative sign of the adjustment term. The analysis focuses firstly on the effect of private capital flows on the REER, and secondly on the importance of exchange rate flexibility.
5.1. Composition of Capital Inflows and the Real Effective Exchange Rate
Using the pooled mean group estimator, Table 1 presents the long-run coefficients that are of interest to us. Hausman tests do not reject the long-term homogeneity of coefficients at the 1% significance level. This result suggests that the pooled mean group estimator might be preferred to the mean group estimator that supposes heterogeneity in both short-term and long-term coefficients.
First, the estimations present the impact of aggregated capital inflows on the REER. Next, the impacts of public and private flows on the REER are separately estimated, and the effects of different components of private capital flows on the REER are analyzed.
Table 1. Composition of Capital Inflows and the Real effective exchange rate
Dependent Variable: Log Real Effective Exchange Rate
(1) (2) (3) EC -0.165 -0.171 -0.139 (5.38)*** (5.55)*** (4.91)*** Log(productivity) 0.052 0.050 0.085 (1.03) (0.97) (1.50) Log(terms of trade) 0.370 0.323 0.365 (8.41)*** (7.91)*** (8.08)*** Log(trade) -0.081 -0.074 -0.099 (2.56)** (2.37)** (2.80)*** Total capital 0.130 (2.00)** Private capital 0.181 (2.87)*** Public capital+ 0.852 1.597 (3.45)*** (4.99)***
Debt interest payment
FDI 1.233 (2.07)** Portfolio investment 7.844 (7.03)*** Private transfers 0.274 (2.61)*** Bank loans 0.917 (2.05)** Hausman Test 4.28 3.58 1.47 [p-value] [0.37] [0.61] [0.99] Co-integration Test Kao test 4.16 -4.21 3.71 [0.00] [0.00] [0.00] Panel rho 4.16 5.38 [0.00] [0.00] Panel ADF 1.33 1.40 [0.16] [0.15] Group rho 6.09 7.45 [0.00] [0.00] Group ADF 3.79 3.50 [0.00] [0.00] Observations 1073 1073 1073 Number of countries 42 42 42 Log-likelihood 1344.24 1378.62 1464.31
EC refers to the error correction term. Only long-run coefficients are reported. * significant at 10%; ** significant at 5%; *** significant at 1%
All specifications include a maximum of one lag. Numbers in parentheses are absolute t-statistics. Numbers in brackets for the Hausman and co-integration tests are p-values. For co-integration tests, the null hypothesis is the absence of co-integration. The null hypothesis for the Hausman test is the restriction of the homogeneity of long-term coefficients. + Except in regression 3, interest payments are excluded from public flows.
The results show that capital inflows are positively associated with an appreciation of the REER. The marginal impact of total capital on Log REER is 0.13 (semi-elasticity). The real appreciation due to public flows is statistically higher12 (χ2(1) = 8.50 [0.003]) than the real
appreciation due to private flows (Table 1, column 2). This could suggest that private flows are used more for investments that increase the productive capacity of the economy and public flows are more directed to government consumption, mainly in the non-tradable sector.
The last column of Table 1 shows how different components of private capital flows affect the REER.The highest level of appreciation from portfolio investments is statistically
significant compared to the effect of FDI (χ2(1) = 26.7 [0.000]), private transfers (χ2(1) = 46.4 [0.000]), and bank loans (χ2(1) = 33.8 [0.000]). The marginal impact of portfolio investments on Log REER is 7.8. Compared to other private flows, portfolio investments are more
volatile and speculative - something generally associated with macroeconomic instability and absence of improvements in productivity.
The real appreciation stemming from FDI is about one-seventh of that induced by portfolio investments. FDI is a more stable flow than portfolio investment and increases productive capacity through transfers of technology and know-how. It is primarily for investment purposes and could lead to imports of new machinery and equipment, which have limited impact on REER.
Loans from commercial banks are also positively correlated with an appreciation of REER, to a degree statistically similar to the appreciation due to FDI (χ2(1) = 0.2 [0.65]). The
marginal impact of FDI or bank loans on Log REER is about 1. One could expect bank loans to have a higher appreciation effect because they are more intermediated by the domestic banking system.The results suggest that bank loans may be directed more to investment financing like FDI, which would improve productive capacity. In this case, the inflation potential of bank loans could be similar to that of FDI, even though spillover effects are not associated with bank loans.
Private transfers appear to have the least effect on REER appreciation: the semi-elasticity is just 0.3.This result might justify viewing remittances as more countercyclical. By helping
households to smooth their consumption during difficult periods, remittances help keep the economy stable by avoiding an acute depreciation of the exchange rate (e.g. following loss of foreign exchange during a macroeconomic shock).
With respect to other macroeconomic fundamentals, terms of trade and trade openness are significant, with the expected sign.A 10% increase in the terms of trade proves to appreciate the REER by almost 4% while trade liberalization enhances a REER depreciation. A 10% increase in trade openness leads to a real depreciation of about 1%. These results are similar to those previously found in the literature (Chen and Rogoff, 2003; Cashin, Cépedes, and Sahay, 2004; Lee, Milesi-Feretti, and Ricci, 2008; Saborowski, 2009). The
Balassa-Samuelson effect captured by relative GDP per capita is not always significant, although it has the expected sign.This could be because GDP per capita, though it is widely used, is a poor proxy for the Balassa-Samuelson effect. The results are not significantly different for low-income countries (Table A.4).
The speed of the adjustment reflected by the coefficient of convergence is about –0.2. The movements of the REER within a year correct about a fifth of the gap between the REER and equilibrium REER as determined by the fundamentals.Therefore, the half-life of an REER deviation from the long-term equilibrium value is about three years.
5.2. Exchange Rate Regime and the Real Effective Exchange Rate
Using the index of the flexibility of the exchange rate based on EMP1, this study shows that a more flexible exchange rate helps to dampen REER appreciation stemming from capital inflows.13The result is robust for low-income countries (Table 2).
13 Other policy responses to appreciation of the REER include fiscal sterilization, capital control policies, and trade liberalization. These policies do not fall within the scope of this paper. Fiscal policy, measured by
government consumption, is also considered a main determinant of the REER by some authors, but some papers focusing on the transfer problem do not consider this variable (Lane and Milesi-Ferretti, 2004). Including this variable does not change our results, and there is no risk of omitted variable bias since the lag term of the dependant variable is always significant.
Table 2. Capital Inflows, Exchange Rate Flexibility, and the REER
Dependent Variable: Log Real Effective Exchange Rate
Total Sample Low-Income Countries
EC -0.239 -0.278 (5.32)*** (3.32)*** Log(productivity) 0.088 0.075 (2.71)*** (2.51)** Log(terms of trade) 0.189 0.280 (4.75)*** (6.89)*** Log(trade) -0.034 0.004 (1.67)* (0.24) Total capital 1.802 1.286 (3.13)*** (2.36)**
Exchange market pressure (EMP1) -0.727 0.158
(8.20)*** (1.15)
EMP1 x Total capital -1.666 -1.193
(2.87)*** (2.18)** Hausman test 1.23 1.58 [p-value] [0.97] [0.95] Co-integration test Kao test -5.00 -0.96 [0.00] [0.17] Panel rho 10.3 6.90 [0.00] [0.00] Panel ADF 2.65 -3.99 [0.01] [0.00] Group rho 12.4 8.55 [0.00] [0.00] Group ADF 3.99 -1.56 [0.00] [0.12] Observations 932 510 Number of countries 42 23 Log-likelihood 1480.75 793.24
EC refers to the error correction term.
All specifications include a maximum of one lag.
* significant at 10%; ** significant at 5%; *** significant at 1%
Numbers in parentheses are absolute t-statistics. Numbers in brackets for the Hausman and the co-integration tests are p-values. For co-co-integration tests, the null hypothesis is the absence of co-co-integration. The null hypothesis for the Hausman test is the restriction of long-term coefficient homogeneity.
As a robustness test, we present in Table A.5 the results obtained from regressions with an alternative measure of exchange rate flexibility. Ilzetzki, Reinhart, and Rogoff (2008)
classify exchange rate regimes in 15 categories according to their de facto flexibility (Table A.6.). Whether we use this alternative measure or the index EMP2 defined above, the results confirm that exchange rate flexibility reduces real appreciation due to capital inflows.
We must acknowledge the potential simultaneity bias between the REER and the nominal exchange rate flexibility. However we can make a hypothesis about the direction of the bias. Indeed, when a country suffers a sharp real appreciation, it may be led to adopt a more flexible exchange rate. Hence, the calculated coefficient is biased upward. A negative coefficient shows a negative impact of the nominal flexibility on the REER.
After the Asian financial crisis, developing countries, particularly in Asia, began to
accumulate significant reserves for precautionary reasons. We control for changes in reserves that do not reflect management of exchange rate volatility. We thus define an additional measure of flexibility of the exchange rate using the difference between the level of reserves and their trend value, obtained using the Hodrick-Prescott method (Filtered Reserve). This allows us to capture the change in reserves due only to management of exchange rate
volatility and not to other reasons, such as precautionary savings. The index of the flexibility of the exchange rate is also defined using the nominal effective exchange rate with each country’s top 10 trading partners, as in the definition of the REER. The results are robust with these alternative definitions of exchange rate flexibility (Table A.5). In all cases the flexibility of the exchange rate helps to dampen the real appreciation effect of capital inflows.
6.CONCLUSION
This paper has analyzed the effect on the REER of capital inflows and their components as well as the potential impact of exchange rate regimes on these relative prices. Using the pooled mean group estimator (Pesaran, Shin and Smith, 1999), which considers long-term homogeneity in the behavior of the REER across countries, while allowing for short-term heterogeneous shocks, we show that private and public capital inflows stimulate the
effect of private flows differs by type of flow.Portfolio investments, which are more volatile, have the highest appreciation effect, followed by FDI and bank loans.Since these flows are potentially related to an increase in productive capacity, the real appreciation associated with FDI and bank loans is barely one-seventh of the real appreciation due to portfolio
investments. Private transfers (mainly remittances) are the flows that have the least appreciation effect. This may suggest that remittances are more counter-cyclical than pro-cyclical, helping countries to offset the real depreciation of their exchange rate during periods of economic slowdown.
Countries often implement policies to reduce, or avoid, the loss of competitiveness associated with the REER appreciation that follows capital inflows. We have assessed the effectiveness of the policy of exchange rate flexibility, one of the main macroeconomic tools available to countries facing significant capital inflows.Using a de facto measure of
exchange rate flexibility, we find that allowing the exchange rate more flexibility helps dampen real appreciation due to capital inflows. This result does not change significantly when alternative measures of exchange rate flexibility are used. Nevertheless, the potential endogeneity bias should lead to interpretation of this result as evidence of a correlation rather than causality.
When implementing policies to attract capital flows, developing countries should consider that a significant REER appreciation might destabilize macroeconomic management.
Particular attention should be given to short-term flows, such as portfolio investments, which have a considerable real appreciation effect compared to other types of capital flow.
Resisting nominal appreciation of the exchange rate through intervention in the foreign exchange market does not prove to be useful for avoiding a real appreciation.Allowing the exchange rate some flexibility would help to cure appreciation stemming from capital inflows and avoid a significant loss of competitiveness.
REFERENCES
Agenor, P. R., 1998. Capital Inflows, External Shocks, and the Real Exchange Rate. Journal of International Money and Finance, 17, 713–40.
Amuedo-Dorantes, C., Pozo, S., 2004. Workers’ Remittances and the Real Exchange Rate: A Paradox of Gifts. World Development, 32 (8), 1407–17.
Athukorala, P-C., Rajapatirana, S., 2003. Capital Inflows and the Real Exchange Rate: Comparative Study of Asia and Latin America, World Economy, 26 (4), 613-637. Bandara, Jayatilleke S., 1995. ‘Dutch’ Disease in a Developing Country: The Case of
Foreign Capital Inflows to Sri Lanka. Seoul Journal of Economics, 8 (Fall), 314–29. Bourdet, Y., Falck, H., 2006. Emigrants’ Remittances and Dutch Disease in Cape Verde.
International Economic Journal, 20 (3), 267-284.
Bulir, A., Lane, T., 2002. Aid and Fiscal Management. IMF Working Paper 02/112 (Washington: International Monetary Fund).
Calvo, G, 1991. The Perils of Sterilization. IMF Staff Papers, 38 (4), 921–926.
_________, Leiderman, L., Reinhart, C., 1993. Capital Inflows and Real Exchange Rate Appreciation in Latin America: The Role of External Factors. IMF Staff Papers, 40 (1), 108–51.
_________, Leiderman, L., Reinhart, C.M., 1996. Inflows of Capital to Developing Countries in the 1990s. Journal of Economic Perspectives, 10 (Spring), 123–39. Cashin, Paul, Luis Cespedes, and Ratna Sahay, 2004. Commodity Currencies and the Real
Exchange Rate. Journal of Development Economics, 75 (1), 239–68.
Cavoli, T., Rajan, R.S, 2007. The Extent of Exchange Rate Flexibility in India: Basket Pegger or Closet US Dollar Pegger? Indian Macroeconomic Annual 2007, 125–40. Cerra, V., Tekin, S., Turnovsky, S.J., 2008. Foreign Aid and Real Exchange Rate
Adjustments in a Financially Constrained Dependent Economy. IMF Working Paper 204 (Washington: International Monetary Fund).
Chami, R., Barajas, A., Cosimano, T., Fullenkamp, C., Gapen, M., Montiel, P., 2008. Macroeconomic Consequences of Remittances. IMF Occasional Paper 259 (Washington: International Monetary Fund).
Chen, Y-C., Kenneth R., 2003. Commodity Currencies. Journal of International Economics, 60 (1), 133–60.
Dornbusch, R., 1998. Capital Controls: An Idea Whose Time Is Past. in Should the IMF Pursue Capital-Account Convertibility? Essays in International Finance, ed. by S. Fischer et al., pp. 207 (Washington: International Monetary Fund).
Dorsey, T., Tadesse H., Singh, S., Brixiova, Z., 2008. The Landscape of Capital Flows to Low-income Countries. IMF Working Paper 08/51 (Washington: International Monetary Fund).
Edwards, S., 1988, Exchange Rate Misalignment in Developing Countries (Baltimore, MD: The Johns Hopkins University Press).
_________, 1989, Real Exchange Rates, Devaluation and Adjustment (Cambridge, MA: MIT Press).
_________, 1994. Real and Monetary Determinants of Real Exchange Rate Behavior: Theory and Evidence from Developing Countries. in Estimating Equilibrium Exchange Rates, ed. J. Williamson (Washington: Institute for International Economics).
_________, 1998. Capital Flows, Real Exchange Rates, and Capital Controls: Some Latin American Experiences. NBER Working Papers 6800 (Cambridge, MA: National Bureau of Economic Research, Inc. ).
_________, Savastano, M., 2000. Exchange Rates in Emerging Economies: What Do We Know? What Do We Need to Know?” in Economic Policy Reform: The Second Stage, ed. A. Krueger (Chicago: University of Chicago Press).
Elbadawi, I. A., Soto, R., 1994. Capital Flows and Long Term Equilibrium Real Exchange Rate in Chile” World Bank Policy Research Working Paper 1306 (Washington: World Bank).
_________, 1997. Real Exchange Rate and Macroeconomic Adjustment in Sub Saharan Africa and Other Developing Countries. Journal of African Economies, 6 (97), 74-120.
Elbadawi, I. A., Kaltani, L., Schmidt-Hebbel, K., 2008. Foreign Aid, the Real Exchange Rate, and Economic Growth in the Aftermath of Civil Wars. World Bank Economic Review, 22 (1), 113–40.
Girton, L., Roper, D., 1977. A Monetary Model of Exchange Market Pressure Applied to the Post-War Canadian Experience. American Economic Review, 67 (4), 537–48. Guimãeres, R. F., Karacagdag, C., 2004. The Empirics of Foreign Exchange Intervention in
Emerging Market Countries: The Cases of Mexico and Turkey. IMF Working Paper 04/123 (Washington: International Monetary Fund).
Hausman, J., 1978. Specification Tests in Econometrics. Econometrica, 46, 1251–71. Hinkle, L. E., Montiel, PJ, Exchange Rate Misalignment: Concepts and Measurement for
Developing Countries (New York: Oxford University Press for the World Bank, 1999).
Hussain, M., Berg A., Aiyar, S., 2009. The Macroeconomic Management of Increased Aid: Policy Lessons from Recent Experience. Review of Development Economics, 13 (3), 491–509.
Im, K. S., Pesaran, M. H., Shin Y., 2003. Testing for Unit Roots in Heterogeneous Panels. Journal of Econometrics, 115, 53–74.
IMF, 2008 (April), Regional Economic Outlook, Sub-Saharan Africa (Washington: International Monetary Fund).
_________, 2007 (October), World Economic Outlook (Washington: International Monetary Fund).
Ilzetzki E., Reinhart, C. M., Rogoff, K. S., 2008, Exchange Rate Arrangements Entering the 21st Century: Which Anchor Will Hold?, Mimeo data available at: http://www. economics. harvard. edu/faculty/rogoff/Recent_Papers_Rogoff
Izquierdo, A., Montiel, PJ, 2006. Remittances and Equilibrium Real Exchange Rates in Six Central American Countries” (photocopy; Washington: Inter-American Development Bank).
Javorcik, B. S., 2004. Does Foreign Direct Investment Increase the Productivity of Domestic Firms? In Search of Spillovers Through Backward Linkages. American Economic Review, 94 (3), 605–27.
Kao, C., Chiang, M. H., 2000. On the Estimation and Inference of a Cointegrated Regression in Panel Data. in Advances in Econometrics 15, B. Baltagi and C. Kao, eds., pp. 179–222 (Amsterdam: Elsevier Science).
Kasekende, L. A., Atingi-Ego, M., 1999. Uganda’s Experience with Aid. Journal of African Economies, 8 (4), 617–49.
Kinda T., 2008. Infrastructures et flux de capitaux privés vers les pays en développement. Revue Economique, 59 (3), 537–49.
_________, 2009. Investment Climate and FDI: Firm-level Evidence. World Development, 38 (3), 498-513.
Kose, M. A., Prasad, E., Rogoff, K., Wei, S., 2006. Financial Globalization: A Reappraisal. IMF Working Paper 06/189 (Washington: International Monetary Fund).
Lane, P., Milesi-Ferretti, G.M., 2004. The Transfer Problem Revisited: Net Foreign Assets and Real Exchange Rates. Review of Economics and Statistics, 86 (4), 841–857. Lartey E., 2007. Capital Inflows and the Real Exchange Rate: An Empirical Study of Sub-Saharan Africa. Journal of International Trade & Economic Development, 16 (3), 337–57.
Lartey, E. K. K., 2008. Capital Inflows, Dutch Disease Effects and Monetary Policy in a Small Open Economy. Review of International Economics, 16 (5), 971–989.
Lee, J., Milesi-Ferretti, G. M., Ricci, L.A., 2008. Real Exchange Rates and Fundamentals: A Cross-Country Perspective. IMF Working Paper 08/13 (Washington: International Monetary Fund).
Li, Y., Rowe, F., 2007. Aid Inflows and the Real Effective Exchange Rate in Tanzania. World Bank Policy Research Working Paper 4456 (Washington: World Bank). Lopez-Mejia A., 1999. Large Capital Flows: A Survey of Causes, Consequences, and Policy
Responses. IMF Working Paper 17 (Washington: International Monetary Fund). Lucas, R. Stark, O., 1985. Motivations to Remit: Evidence from Botswana. Journal of
Political Economy, 93 (5), 901–18.
Lueth, E., Ruiz-Arranz, M., 2007. Are Workers’ Remittances a Hedge Against Macroeconomic Shocks? The Case of Sri Lanka. IMF Working Paper 07/22 (Washington: International Monetary Fund).
Maeso-Fernandez, F., Osbat, C. Schnatz, B., 2004. Towards The Estimation of Equilibrium Exchange Rate for CEE Acceding Countries: Methodological Issues and A Panel Cointegration Perspective. ECB Working Papers 353 (Frankfurt: European Central Bank).
Mongardini J., Rayner B, 2009. Grants, Remittances, and the Equilibrium Real Exchange Rate in Sub-Saharan African Countries. Working Paper 75 (Washington:
International Monetary Fund).
Montiel, P. J., 2006. Workers’ Remittances and the Long-Run Equilibrium Real Exchange Rate: Analytical Issues (unpublished; Williamstown, Massachusetts: Williams College).
Pedroni, P., 2001. PPP Tests in Cointegrated Panels. Review of Economics and Statistics, 83 (4), 727–31.
Pentecost, E. J., Van Hooydonk, C., Van Poeck, A., 2001. Measuring and Estimating Exchange Market Pressure in the EU. Journal of International Money and Finance, 20 (3), 401–18.
Pesaran, M. H., Smith, R., 1995. Estimating Long-run Relationships from Dynamic Heterogeneous Panels. Journal of Econometrics, 68 (1), 79–113.
_________, Shin, Y., Smith, RJ, 1999. Pooled Mean Group Estimation of Dynamic
Heterogeneous Panels. Journal of the American Statistical Association, 94, 621–34. Prati, A., Sahay, R., Tressel, T., 2003. Is There a Case for Sterilizing Foreign Aid?”
Macroeconomic Challenges in Low-Income Countries Workshop (Washington: International Monetary Fund). Available at: http://www. imf.
org/external/np/res/seminars/2003/lic/pdf/tt. pdf.
Rajan, R., Subramanian, A., 2005. What Undermines Aid’s Impact on Growth? NBER Working Paper 11657 (Cambridge, MA: National Bureau of Economic Research).
Reinke, J., 2007. Remittances in the Balance of Payments Framework: Current Problems and Forthcoming Improvements. presentation to Seminar on Remittance Statistics at the Center of Excellence in Finance, Ljubljana, Slovenia, February 26–March 2.
Available at: imf. org/external/np/sta/bop/pdf/rem. pdf.
Rodrik, D., 2008. The Real Exchange Rate and Economic Growth, Brooking Papers on Economic Activity, Fall, 2, 365-412.
Saadi-Sedik, T., Petri, M., 2006. To Smooth or Not to Smooth—The Impact of Grants and Remittances on the Equilibrium Real Exchange Rate in Jordan. IMF Working Paper WP/06/257 (Washington: International Monetary Fund).
Saborowski, C., 2009. Capital Inflows and the Real Exchange Rate: Can Financial Development Cure the Dutch Disease?” IMF Working Paper 09/20 (Washington: International Monetary Fund).
Tanner, E., 2001. Exchange Market Pressure and Monetary Policy: Asia and Latin America in the 1990s. IMF Staff Papers, Vol. 47, No. 3, 311–33.
Williamson, J., 1994, Estimating Equilibrium Exchange Rates (Washington: Institute for International Economics).
APPENDIX
List of Countries
Algeria, Bangladesh, Benin, Bolivia, Brazil, Burkina Faso, Cameroon, China, Colombia, Costa Rica, Côte d’Ivoire, Dominican Republic, Ecuador, Egypt, El Salvador, Gabon, Ghana, Guatemala, Guinea, India, Lesotho, Malaysia, Mali, Mauritania, Mauritius, Morocco,
Mozambique, Namibia, Nicaragua, Nigeria, Oman, Panama, Paraguay, Peru, Philippines, Republic of Congo, Senegal, South Africa, Sri Lanka, Thailand, Turkey, and Uruguay.
Table A.1. List, Definitions, and Sources of Variables
Variable Definition Source
Log(REER) Logarithm of real effective
exchange rate, CPI base
International Financial Statistics (IFS) and CERDI calculation
Log(productivity) Logarithm of GDP per capita
relative to trading partners. IFS and CERDI calculation
Log(terms of trade) Logarithm of the terms of trade World Economic Outlook (WEO)
Log(trade) Logarithm of (Exports +
Imports)/GDP
World Development Indicators (WDI)
Total capital Total external financing to GDP WEO
Private capital Private capital inflows to GDP WEO
Public capital Public capital inflows to GDP WEO
FDI Foreign direct investment to
GDP WEO
Portfolio investment Portfolio investment to GDP WEO
Private transfers Private transfers to GDP WEO
Bank loans Banks loans to GDP WEO
Debt interest Payment of interest on debt to
GDP WEO
Exchange market pressure
Index of flexibility of the
exchange rate WEO and WDI
IRR Ilzetzki, Reinhart, and Rogoff
Table A.2. Summary Statistics
Variable Observations Mean Std. Dev. Min Max
Log(REER) 1117 4.621 0.409 3.169 7.634
Log(productivity) 1117 -2.256 0.923 -4.211 -0.172
Log(terms of trade) 1117 4.637 0.248 3.590 5.947
Log(trade) 1117 -0.550 0.545 -2.761 0.828
Total capital flows to GDP 1117 0.055 0.197 -3.080 1.592
Total private flows to GDP 1117 0.051 0.108 -0.286 1.230
FDI to GDP 1117 0.015 0.024 -0.090 0.435
Portfolio investment to GDP 1117 0.007 0.060 -0.316 1.179
Private transfers to GDP 1117 0.025 0.078 -0.114 0.973
Bank loans to GDP 1117 0.005 0.036 -0.236 0.521
Total public flows to GDP 1117 0.024 0.116 -0.347 1.475
Debt interest 1117 0.024 0.025 -0.038 0.215
Exchange market pressure 979 0.845 0.338 0 1
Figure A.1. External Financing in Emerging Market Countries 0 2 4 6 in p e rc e n ta g e o f G D P 1981-84 1986-89 1990-94 1995-1999 2000-04 2005-06 Private transfers Foreign Direct Investment Portfolio Investment Commercial Bank Loans
0 1 2 3 in p e rc e n ta g e o f G D P 1981-84 1986-89 1990-94 1995-1999 2000-04 2005-06 Official Loans Official Transfers Debt Interest
Figure A.2. The Real effective exchange rate and Capital Inflows (Selected Countries) Algeria Turkey -. 2 -. 1 5 -. 1 -. 0 5 0 .0 5 T o ta l C a p it a l F lo w s t o G D P 3 .5 4 4 .5 5 5 .5 L o g o f th e R E E R 1980 1985 1990 1995 2000 2005 year
Log of the REER Total Capital Flows to GDP
-. 1 -. 0 5 0 .0 5 .1 T o ta l C a p it a l F lo w s t o G D P 4 .4 4 .5 4 .6 4 .7 4 .8 4 .9 L o g o f th e R E E R 1980 1985 1990 1995 2000 2005 year
Log of the REER Total Capital Flows to GDP
Côte d’Ivoire Senegal
-. 4 -. 2 0 .2 .4 T o ta l C a p it a l F lo w s t o G D P 4 4 .2 4 .4 4 .6 4 .8 L o g o f th e R E E R 1980 1985 1990 1995 2000 2005 year
Log of the REER Total Capital Flows to GDP
.0 5 .1 .1 5 .2 .2 5 T o ta l C a p it a l F lo w s t o G D P 4 4 .2 4 .4 4 .6 4 .8 L o g o f th e R E E R 1980 1985 1990 1995 2000 2005 year
Log of the REER Total Capital Flows to GDP
Brazil El Salvador -. 0 6 -. 0 4 -. 0 2 0 .0 2 .0 4 T o ta l C a p it a l F lo w s t o G D P 4 4 .2 4 .4 4 .6 L o g o f th e R E E R 1980 1985 1990 1995 2000 2005 year
Log of the REER Total Capital Flows to GDP
0 .0 5 .1 .1 5 .2 .2 5 T o ta l C a p it a l F lo w s t o G D P 4 .2 4 .4 4 .6 4 .8 L o g o f th e R E E R 1980 1985 1990 1995 2000 2005 year
Log of the REER Total Capital Flows to GDP
Thailand Sri Lanka
-. 1 -. 0 5 0 .0 5 .1 .1 5 T o ta l C a p it a l F lo w s t o G D P 4 .3 4 .4 4 .5 4 .6 4 .7 4 .8 L o g o f th e R E E R 1980 1985 1990 1995 2000 2005 year
Log of the REER Total Capital Flows to GDP
.0 3 .0 4 .0 5 .0 6 .0 7 .0 8 T o ta l C a p it a l F lo w s t o G D P 4 .5 5 4 .6 4 .6 5 4 .7 4 .7 5 4 .8 L o g o f th e R E E R 1980 1985 1990 1995 2000 2005 year
Table A.3. Unit Root Tests
Level First Difference
ADF IPS ADF IPS
REER 0.83 0.12 0.00 0.00 Productivity 0.32 0.42 0.00 0.00 Terms of trade 0.19 0.99 0.00 0.00 Trade 0.05 0.12 0.00 0.00 Total capital 0.05 0.06 0.00 0.00 Private capital 0.03 0.05 0.00 0.00 Public capital 0.00 0.01 0.00 0.00 FDI 0.53 0.60 0.00 0.00 Portfolio investment 0.21 0.91 0.00 0.00 Private transfers 0.98 0.96 0.00 0.00 Bank loans 0.00 0.00 0.00 0.00
Exchange market pressure 0.31 0.08 0.00 0.00
IRR index 0.11 0.21 0.00 0.00
Note: Numbers reported here are p-value. The null hypothesis is the presence of unit root. IPS refers to Im, Peseran, and Shin (2003).