HAL Id: inserm-02879275
https://www.hal.inserm.fr/inserm-02879275
Submitted on 23 Jun 2020
HAL is a multi-disciplinary open access
archive for the deposit and dissemination of
sci-entific research documents, whether they are
pub-lished or not. The documents may come from
teaching and research institutions in France or
abroad, or from public or private research centers.
L’archive ouverte pluridisciplinaire HAL, est
destinée au dépôt et à la diffusion de documents
scientifiques de niveau recherche, publiés ou non,
émanant des établissements d’enseignement et de
recherche français ou étrangers, des laboratoires
publics ou privés.
variants identify MX2 as a gene promoting melanoma
Jiyeon Choi, Tongwu Zhang, Andrew Vu, Julien Ablain, Matthew Makowski,
Leandro Colli, Mai Xu, Rebecca Hennessey, Jinhu Yin, Harriet Rothschild, et
al.
To cite this version:
Jiyeon Choi, Tongwu Zhang, Andrew Vu, Julien Ablain, Matthew Makowski, et al.. Massively parallel
reporter assays of melanoma risk variants identify MX2 as a gene promoting melanoma. Nature
Communications, Nature Publishing Group, 2020, 11 (1), pp.2718. �10.1038/s41467-020-16590-1�.
�inserm-02879275�
Massively parallel reporter assays of melanoma
risk variants identify
MX2 as a gene promoting
melanoma
Jiyeon Choi
1,10
, Tongwu Zhang
1,10
, Andrew Vu
1
, Julien Ablain
2
, Matthew M. Makowski
3
,
Leandro M. Colli
1
, Mai Xu
1
, Rebecca C. Hennessey
1
, Jinhu Yin
1
, Harriet Rothschild
2
, Cathrin Gräwe
3
,
Michael A. Kovacs
1
, Karen M. Funderburk
1
, Myriam Brossard
4
, John Taylor
5
, Bogdan Pasaniuc
6
, Raj Chari
7
,
Stephen J. Chanock
1
, Clive J. Hoggart
8
, Florence Demenais
4
, Jennifer H. Barrett
5
, Matthew H. Law
9
,
Mark M. Iles
5
, Kai Yu
1
, Michiel Vermeulen
3
, Leonard I. Zon
2
& Kevin M. Brown
1
✉
Genome-wide association studies (GWAS) have identi
fied ~20 melanoma susceptibility loci,
most of which are not functionally characterized. Here we report an approach integrating
massively-parallel reporter assays (MPRA) with cell-type-speci
fic epigenome and expression
quantitative trait loci (eQTL) to identify susceptibility genes/variants from multiple GWAS
loci. From 832 high-LD variants, we identify 39 candidate functional variants from 14 loci
displaying allelic transcriptional activity, a subset of which corroborates four colocalizing
melanocyte
cis-eQTL genes. Among these, we further characterize the locus encompassing
the HIV-1 restriction gene,
MX2 (Chr21q22.3), and validate a functional intronic variant,
rs398206. rs398206 mediates the binding of the transcription factor, YY1, to increase
MX2
levels, consistent with the
cis-eQTL of MX2 in primary human melanocytes.
Melanocyte-specific expression of human MX2 in a zebrafish model demonstrates accelerated melanoma
formation in a
BRAF
V600Ebackground. Our integrative approach streamlines GWAS
follow-up studies and highlights a pleiotropic function of
MX2 in melanoma susceptibility.
https://doi.org/10.1038/s41467-020-16590-1
OPEN
1Division of Cancer Epidemiology and Genetics, National Cancer Institute, Bethesda, MD 20892, USA.2Stem Cell Program and Division of Hematology/ Oncology, Boston Children’s Hospital and Dana-Farber Cancer Institute, Boston, MA 02115, USA.3Department of Molecular Biology, Faculty of Science, Radboud Institute for Molecular Life Sciences, Oncode Institute, Radboud University Nijmegen, 6525 XZ Nijmegen, The Netherlands.4Université de Paris, UMRS-1124, Institut National de la Santé et de la Recherche Médicale (INSERM), F-75006 Paris, France.5Leeds Institute for Data Analytics, School of Medicine, University of Leeds, Leeds LS2 9JT, UK.6Department of Human Genetics, David Geffen School of Medicine, University of California, Los Angeles, Los Angeles, CA 90024, USA.7Genome Modification Core, Frederick National Lab for Cancer Research, National Cancer Institute, Frederick, MD 21701, USA.8Department of Medicine, Imperial College London, London SW7 2BU, UK.9Statistical Genetics, QIMR Berghofer Medical Research Institute, Brisbane, QLD 4006, Australia.10These authors contributed equally: Jiyeon Choi, Tongwu Zhang. ✉email:kevin.brown3@nih.gov
123456789
A
series of genome-wide association studies (GWAS) over
the past decade has identified about twenty genomic loci
associated with cutaneous melanoma
1–10, highlighting the
genetic contribution to melanoma susceptibility in the general
population. Some of these loci represent genes or regions
impli-cated in melanoma-associated traits e.g., pigmentation
pheno-types
11–15and nevus count
5,16,17. Other than these loci, however,
underlying mechanisms of genetic susceptibility to melanoma in
the general population is less well understood. For a small
number of these loci, extensive characterization of susceptibility
genes and variants under the GWAS peaks have led to insights
into molecular pathways underlying melanoma susceptibility.
PARP1, located in the Chr1q42.1 melanoma locus
8, was shown to
be a susceptibility gene that has tumor-promoting roles in early
events of melanomagenesis through its regulation of melanocyte
master transcription factor and oncogene, MITF
18, while a
functional variant at a multi-cancer locus on Chr5p15.33 was
characterized highlighting the role of TERT in cancer
suscept-ibility including in melanoma
19. Still, the molecular mechanisms
underlying the majority of common melanoma risk loci remain
unexplained.
Recent advances in sequencing technologies have enabled a
number of classical molecular assays to be conducted at a large
scale. Massively Parallel Reporter Assays (MPRA) scale up
con-ventional luciferase reporter assays for testing transcriptional
activities of DNA elements, facilitating evaluation of tens of
thou-sands of different short sequences at the same time in cells, which
are then deconvoluted by massively parallel sequencing
20–22.
Incorporation of this approach is particularly attractive for GWAS
functional follow-up studies, as (1) linkage disequilibrium (LD)
limits statistical
fine-mapping and leaves numerous variants as
potential functional candidates, and (2) many trait-associated
var-iants are hypothesized to contribute to allelic gene expression
through cis-regulatory mechanisms that can be tested by reporter
assays. Therefore, direct assessment of allelic differences in
tran-scriptional regulation could help prioritize likely functional variants
among multiple variants tied by LD. For example, a recent study
adopted MPRA to test 2756 variants from 75 GWAS loci for red
blood cell traits and identified 32 functional variants from 23 loci
20.
In addition, expression quantitative trait loci (eQTL) analysis
can be a powerful approach for identifying susceptibility genes
from GWAS loci, as it informs on genes for which expression
levels are correlated with trait-associated variants. While there are
a number of publicly available eQTL datasets using tissues
representing different human organs including those through the
GTEx project
23, most of them are based on bulk tissue samples
(e.g., skin tissues) as opposed to individual cell types. Importantly,
melanomas arise from melanocytes, but they account for less than
5% of a typical skin biopsy. To dissect cell-type specific gene
expression regulation implicated in melanoma predisposition, a
melanocyte eQTL dataset using primary cultures of melanocytes
from 106 individuals was established and mapped six melanoma
GWAS loci (30% of all the loci) to melanocyte eQTLs
24. This
dataset identified more candidate susceptibility genes than using
eQTLs from datasets of larger sample size generated from bulk
skin tissues, other tissue types from GTEx, and melanoma
tumors
24, highlighting the utility of cell-type specific eQTL
dataset for functional follow-up of GWAS regions.
In this study, we combine MPRA and cell-type specific
mela-nocyte eQTL to scale up the functional annotation process for
melanoma GWAS loci and nominate the best candidates for
testing in a zebrafish model. Using our approach we identify a
functional risk variant that increases the level of an HIV-1
restriction gene, MX2, in cells of melanocytic lineage; subsequent
expression of MX2 in melanocytes of a zebrafish melanoma
model accelerates melanoma formation.
Results
MPRA identified melanoma-associated functional variants. To
identify functional melanoma-associated variants displaying
allelic transcriptional function, we used the MPRA approach.
Among 20 genome-wide significant melanoma loci from the most
recent GWAS meta-analysis
1, we prioritized 16 loci where a
potential cis-regulatory mechanism could be hypothesized,
excluding four pigmentation-associated loci previously explained
by functional protein coding variants (MC1R, SLC45A2, and
TYR
11–14) or shown not to be expressed in melanocytes (ASIP
15).
To comprehensively analyze genetic signals from these loci, we
then performed statistical
fine-mapping using the HyperLasso
25approach. The
fine-mapping nominated additional independent
signals (Supplementary Table 1), from which we selected 30
variants, adding to the 16 lead SNPs from the initial meta-analysis
results
1. To prioritize melanoma-associated variants to test by
MPRA, we
first selected 2748 variants that are in LD (r
2> 0.4)
with these 46 primary and secondary lead SNPs (Methods;
Sup-plementary Fig. 1; SupSup-plementary Table 2). Among them, we
further prioritized 832 variants that overlap potentially functional
melanoma-relevant genomic signatures, namely, open chromatin
regions and promoter/enhancer histone marks in primary
mela-nocytes and/or melanoma short term cultures
26(Supplementary
Data 1; Supplementary Table 3; Methods;
www.encodeproject.
org
;
www.roadmapepigenomics.org
). We then constructed MPRA
libraries for these 832 variants using methods adopted from
previous studies
20–22,27. A 145 bp genomic sequence
encom-passing the risk or protective allele of each variant was tested for
their potential as an enhancer or promoter element in luciferase
constructs. For each variant, a scrambled sequence for its core 21
bases was also tested as a null (Fig.
1
a; Methods). Transcribed
output of tag (barcode) sequences associated with each tested
DNA element were then measured by sequencing, after
trans-fections into a melanoma cell line (UACC903) to represent
melanoma-specific trans-acting factors and the HEK293FT cell
line to obtain maximum transfection efficiency. From these data,
we initially observed significantly high correlation of
transcrip-tional activities among replicates, and further applied a
con-servative quality control measure for downstream analyses
(Methods; Supplementary Figs. 2–6; Supplementary Table 4).
To nominate variants displaying allelic transcriptional activity,
we focused on those displaying significant difference between two
alleles (FDR < 0.01; two-sided Wald test with robust sandwich
type variance estimate; multiple comparisons adjusted using
Benjamini & Hochberg method), and then further selected those
with either allele displaying a significant departure from the null
(scrambled core sequence; FDR < 0.01) (Supplementary Fig. 2).
After applying these cutoffs, 39 of the 832 tested variants (~4.7%)
qualified as displaying allelic transcriptional activity in the
UACC903 melanoma cell dataset alone, as well as in the
combined total dataset (Methods; Supplementary Fig. 7a;
Sup-plementary Table 5). These candidate functional variants are
from 14 melanoma GWAS loci with 1–9 variants per locus
(median 1.5 variants), demonstrating that MPRA narrowed down
functional candidate variants to a considerably small number
from tens to hundreds of high-LD variants in most of the loci
(Fig.
1
b; Supplementary Table 6; Supplementary Fig. 8).
Tran-scriptional activities of these 39 variants were significantly higher
than those of negative controls (8 variants of high LD with the
lead SNP but located in non-DHS/non-promoter/enhancer
histone mark in melanocytes/melanoma cells; P < 2.2e−16, effect
size
= 0.137; Mann–Whitney U test; Supplementary Fig. 7b),
as well as the rest of the variants (non-significant variants; P <
2.2e−16, effect size = 0.109). These 39 variants displayed a
modest 1.13 to 3.49-fold (median 1.26-fold) difference in
transcriptional activity between two alleles consistent with subtle
effects on risk observed for common cancer-associated variants
(UACC903 cells; Supplementary Table 5). We then asked if the
observed allelic differences from MPRA are in part due to
differential binding of transcription factors. For this, we predicted
allelic transcription factor binding affinity of each tested variant
using motifbreakR
28and subsequently correlated the predicted
allelic binding scores with the allelic transcriptional activities
measured from MPRA. Notably, the MPRA-significant variants
displayed a higher level of correlation compared to that of
non-significant ones, shown by a larger Pearson r (Pearson r = 0.24 vs.
−0.023; Supplementary Fig. 9a), while the P-values for the both
tests are not significant (P = 0.149 and 0.556, respectively). We
then asked if MPRA-significant variants are enriched in credible
causal variants or those with higher probability scores from a
Bayesian
fine-mapping approach. For this we performed
statistical
fine-mapping of melanoma GWAS data using
PAIN-TOR
29while integrating primary melanocyte-specific functional
annotations (Methods). When overlaid with the
fine-mapping
results, the 39 significant MPRA variants (FDR < 0.01) indeed
displayed the highest median probability score compared to other
variant groups with varying FDR cutoffs, which was a 2.12-fold
enrichment over all the tested variants with probability scores
(Supplementary Fig. 9b). These data demonstrated that MPRA
can quickly narrow down to a small number of plausible
functional candidate variants from tens to hundreds of high-LD
variants from melanoma GWAS loci by measuring allelic
transcriptional activity.
eQTL prioritized functional candidates in four melanoma loci.
To prioritize functional variants that contribute to melanoma risk
through regulation of nearby gene expression, we turned to
cell-type specific melanocyte eQTL data from 106 individuals
24.
597,335 significant cis-eQTL SNPs (+/−1 Mb of TSS, FDR < 0.05,
not LD-pruned) were identified in this dataset, with 6 of 20
melanoma GWAS loci displaying significant co-localization/
TWAS
24. For the purpose of nominating the most plausible
candidates for functional follow-up, we mainly focused on the
five
of these six loci with melanocyte eQTL support (1q21.3, 1q42.12,
2q33-q34, 21q22.3, and 22q13.1) that were also tested in our
MPRA. While there were initially 17 to 116 eQTL variants per
locus at a genome-wide significant level, MPRA further narrowed
them down to 3 to 9 functional variants in four loci based on
transcriptional activity (Supplementary Table 6). Among them, a
total of nine variants from four loci displayed a consistent
direction between MPRA and eQTL, in which the direction of
allelic expression of local genes matches those of MPRA allelic
transcriptional activity (Supplementary Table 6; Supplementary
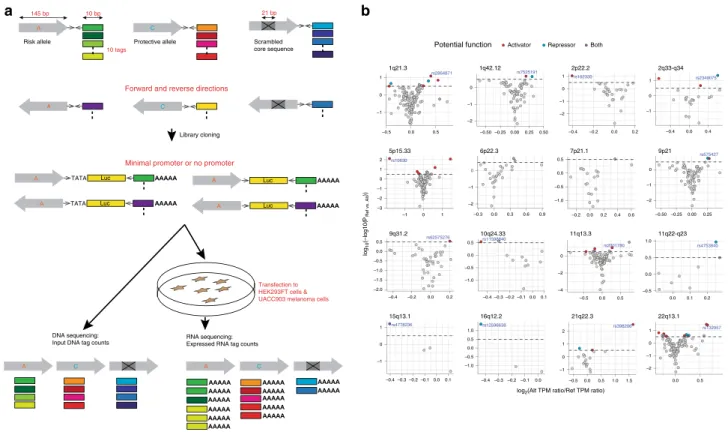
TATA TATA Luc Luc A C Luc Luc DNA sequencing:
Input DNA tag counts RNA sequencing:Expressed RNA tag counts Risk allele Protective allele
Library cloning
145 bp 10 bp
10 tags
Minimal promoter or no promoter
Transfection to HEK293FT cells & UACC903 melanoma cells
Scrambled core sequence
21 bp
Forward and reverse directions
A C
a
A A A A A C A C rs2001780 rs12596638 rs7525191 rs2864871 rs398206 rs132957 rs4753840 rs575427 rs11598840 rs62575276 rs2349075 rs162330 rs4778236 rs10630 1q42.12 22q13.1 9q31.2 5p15.33 16q12.2 21q22.3 10q24.33 15q13.1 11q13.3 6p22.3 9p21 2p22.2 7p21.1 1q21.3 11q22-q23 2q33-q34 –0.50 –0.250.000.25 0.50 0.0 0.5 –0.4 –0.2 0.0 0.2 –1 0 1 –0.4–0.3–0.2–0.10.0 –0.4 –0.3 –0.2 –0.1 0.0 –0.5 0.0 0.5 1.0 1.5 –0.4 –0.3 –0.2 –0.1 0.00.1 0.1 –0.5 0.0 0.5 –0.3 0.0 0.3 0.6 0.9 –0.50–0.25 0.00 0.25 –0.4 –0.2 0.0 0.2 –0.2 0.0 0.2 0.4 0.6 –0.5 0.0 0.5 0.0 0.1 0.2 –0.4 0.0 0.4 –1 0 1 –2 –1 0 1 –1 0 1 –3 –2 –1 0 1 2 –0.5 0.0 0.5 1.0 –2 –1 0 –1.0 –0.5 0.0 0.5 –2.0 –1.5 –1.0 –0.5 0.0 0.5 –1 0 1 –2 –1 0 –1 0 1 2 –2 –1 0 1 –1.0 –0.5 0.0 0.5 –4 –2 0 –1.0 –0.5 0.0 0.5 1.0 –2 –1 0log2(Alt TPM ratio/Ref TPM ratio)
log
10
(–log10(
PRef vs. Alt
))
Potential function Activator Repressor Both
b
Fig. 1 MPRA identified 39 functional variants from 16 melanoma GWAS loci. a MPRA workflow. Oligo libraries were synthesized using 145 bp of sequence encompassing each variant with risk or protective alleles or a scrambled sequence for core 21 bases in both forward and reverse directions, that wasflanked by enzyme recognition sites and sequencing primer sequences, as well as 10 bp barcodes (10 tags per unique sequence). Libraries were cloned into luciferase constructs with or without a minimal TATA promoter. Cloned libraries were then transfected into HEK293FT cells or UACC903 melanoma cells to generate expressed RNA tag libraries. Both input DNA and RNA libraries were sequenced to assess the tag counts associated with the test sequences. Luc: luciferase gene, AAAAA: poly-A tail.b Volcano plots of MPRA results for each melanoma GWAS locus. Inverse P-values and effect sizes of allelic difference from UACC903 transfections are shown for each of the 16 loci tested. A two-sided Wald test with robust sandwich type variance estimate was used. Multiple comparisons were adjusted using the Benjamini and Hochberg method. Dashed horizontal lines indicate the FDR 1% cutoff for allelic difference in the UACC903 set. The most significant variant from each locus is labeled. Putative function of 39 significant MPRA variants are shown as activator (red circle), repressor (blue circle), or both (purple circle) (expression levels of either allele is higher, lower, or higher and lower than those of scrambled sequence, respectively). Gray variants above the FDR 1% cutoff are those that failed additional criteria (allelic difference in the combined data or significant departure from the scrambled control). No significant variants were identified from the loci on Chr6p22.3 and Chr7p21.1. Source data are provided as a Source Datafile.
Fig. 9c). Namely, two MPRA-significant variants (rs2864871 and
rs6700022) from the locus on chromosome band 1q21.3 were
significant eQTLs for CTSS in melanocytes, where lower CTSS
levels were correlated with melanoma risk. Similarly, two to three
variants each (rs2349075, rs529458487, rs398206, rs408825,
rs4383, rs4384, and rs6001033) from three other loci (2q33-q34,
21q22.3, and 22q13.1) also overlapped with melanocyte eQTLs,
where lower CASP8, higher MX2, and higher MAFF levels were
correlated with melanoma risk, respectively (Supplementary
Table 7). For 1q42.12, none of the eQTL significant variants
passed the MPRA significance cutoff, and therefore were not
prioritized. Thus, by combining MPRA and cell-type specific
melanocyte eQTL, we efficiently prioritized candidate functional
variants and susceptibility genes from multiple melanoma
GWAS loci.
MX2 is a susceptibility gene in the 21q22.3 melanoma locus. To
validate the efficiency of our prioritization scheme, we performed
a thorough validation and functional characterization for one of
the four loci with combined MPRA and melanocyte eQTL
sup-port. We chose the locus on 21q22.3, where MPRA identified the
most significant variant. In this locus, twenty-two variants were
originally tested in MPRA (Supplementary Table 8), nineteen of
which are located in the
first intron of the MX2 gene (Fig.
2
a),
and the remaining three upstream. Of these, three variants were
significant in MPRA, and rs398206, in particular, (Fig.
2
a, shown
in magenta) displayed the lowest P-value of all 832 tested
var-iants. rs398206 displayed a strong transcriptional activator
function (1.7 to 4.3-fold above the scrambled sequence), as well as
significant allelic difference, where the melanoma risk-associated
A allele drove significantly higher luciferase expression than
protective C allele (3.1-fold in UACC903 cells, FDR
= 5.6e−206;
Fig.
2
b). Subsequent individual luciferase assays using the same
145 bp sequence in two melanoma cell lines validated this
finding
(2.7 to 5.0-fold allelic difference, P
= 1.1e−6–5.2e−11; two-tailed,
unpaired t-test assuming unequal variance; Fig.
2
c;
Supplemen-tary Fig. 9d). rs398206 was also a significant eQTL for levels of
MX2 gene expression in primary melanocytes, where the
mela-noma risk-associated A allele is correlated with higher MX2
expression (Slope
= 0.70, P = 6.6e−15; linear regression; Fig.
2
d).
While melanocyte eQTL consistently identified MX2 as the
best candidate susceptibility gene at the 21q22.3 melanoma
locus
24, we further interrogated eQTL data from melanocytes and
44 GTEx tissue types, to comprehensively assess potential
melanoma susceptibility gene(s) in this locus. When we inspected
eQTL data from 44 GTEx tissue types, rs398206 was a significant
eQTL for MX2 in
five other tissue types (testis, transformed skin
fibroblasts, ovary, tibial nerve, and whole blood) but no other
gene displayed a genome-wide significant eQTL with rs398206
(using a nominal P-value threshold set for each gene based on a
genome-wide empirical P-value as defined by GTEx V6p; GTEx
portal;
https://gtexportal.org
).
As the melanocyte cis-eQTL analyses used for the above
assessments were limited to the genes in
+/−1Mb of the tested
variants
24, we explored if rs398206 is a marginal eQTL for any
gene in the topologically-associated domain (TAD) to account for
potential gene regulation mediated by chromatin looping
typically occurring within this physical domain. From the
genomic interval defined as the TAD encompassing rs398206
(chr21:42,480,000–44,320,000; hg19; retrieved from Hi-C data of
SKMEL5 melanoma cell line generated for ENCODE dataset via
http://promoter.bx.psu.edu/hi-c/
), a total of 21 genes were
significantly expressed in melanocytes, for which eQTL analyses
were performed. The results demonstrated that MX2 displayed
the most significant eQTL with rs398206 (P = 6.6e−15; linear
regression), while none of the other genes in the TAD displayed
even a marginally significant eQTL after adjusting for multiple
testing (Bonferroni-corrected cutoff at P < 0.0024 for 21 genes;
Supplementary Table 9). These data determined that MX2 is the
most likely susceptibility gene at the 21q22.3 melanoma
susceptibility locus.
To complement the eQTL data, we also assessed allele-specific
expression (ASE) of MX2 in melanocytes. rs398206 is located in
the 5’ UTR region of an alternative MX2 transcript isoform
(ENST00000543692; Supplementary Fig. 10a), the expression
levels of which are correlated with the most abundant full-length
transcript in melanocytes (ENST00000330714; Pearson r
= 0.69,
P
= 1.63e−16; Supplementary Fig. 11). RNA sequencing data
from our previous study did not
find genome-wide significant
ASE for any melanoma-associated SNP (GWAS P < 5e−8)
residing in the transcribed region of MX2
24, partly due to low
sequence coverage of this transcript that is expressed at a low
level. To thoroughly examine allele-specific expression in this
region, we genotyped rs398206 in melanocyte cDNA using a
Taqman genotyping assay that recognizes both genomic DNA
and cDNA. The results demonstrated an over-representation of A
allele-bearing transcripts in 27 heterozygous individuals, when
the allelic ratio in cDNA was normalized to those in genomic
DNA (One-sample Wilcoxon test, P
= 2.49e−5; Supplementary
Fig. 12). These data are consistent with the eQTL data, where the
risk-associated A allele is correlated with higher MX2 expression.
To thoroughly investigate possible mechanisms of allelic MX2
expression in relation to rs398206, we performed additional QTL
analyses in melanocytes addressing alternative modes of gene
regulation, including splice-QTL (sQTL) and DNA methylation
QTL (meQTL). sQTL analyses using LeafCutter
30suggested that
the main effect of the MX2 eQTL was not driven by alternative
isoforms or splicing events (Supplementary Fig. 10b–f;
Supple-mentary Note). meQTL analysis, on the other hand, identified a
significant meQTL for rs398026 at a CpG probe near the MX2
canonical promoter, where the melanoma risk-associated A allele
is correlated with lower CpG methylation, which is consistent
with higher expression of the full-length isoform (Supplementary
Fig. 13). Two other CpG probes in the
first intron of MX2 (closer
to rs398206) also displayed significant meQTLs for rs398206 in
melanocytes, where higher CpG methylation is correlated with
the risk A allele. These observations are consistent with the
previous
findings that DNA methylation in promoters is
negatively correlated with gene expression, while that of
transcribed regions is positively correlated with gene
expres-sion
31–35. Taken together, eQTL, sQTL, and meQTL data are
consistent with the hypothesis that MX2 full-length transcript
mainly accounts for the eQTL at rs398206 in melanocytes
through a transcriptional mechanism.
rs398206 regulates
MX2 levels via allelic binding of YY1. To
identify protein factors mediating the allelic difference observed
in MPRA, we performed comparative mass-spectrometry using a
21 bp DNA probe encompassing rs398206 with A or C alleles and
nuclear extract from the UACC903 melanoma cell line (Fig.
3
a).
Among the proteins displaying allelic binding, the most
promi-nent A-allele preferential binding was shown for Yinyang-1
(YY1), a ubiquitous transcription factor having roles in
devel-opment and cancer
36, as well as in pigmentation pathways of
melanocytes
37. Sequence-based motif prediction was also
con-sistent with this
finding, indicating that the sequence around
rs398206 forms a consensus binding site for YY1 favoring the
A-allele (Fig.
3
b). Subsequent electrophoretic mobility shift assays
(EMSAs) validated that this A-allele-preferential binding of
nuclear proteins is sequence-specific, as shown by competition
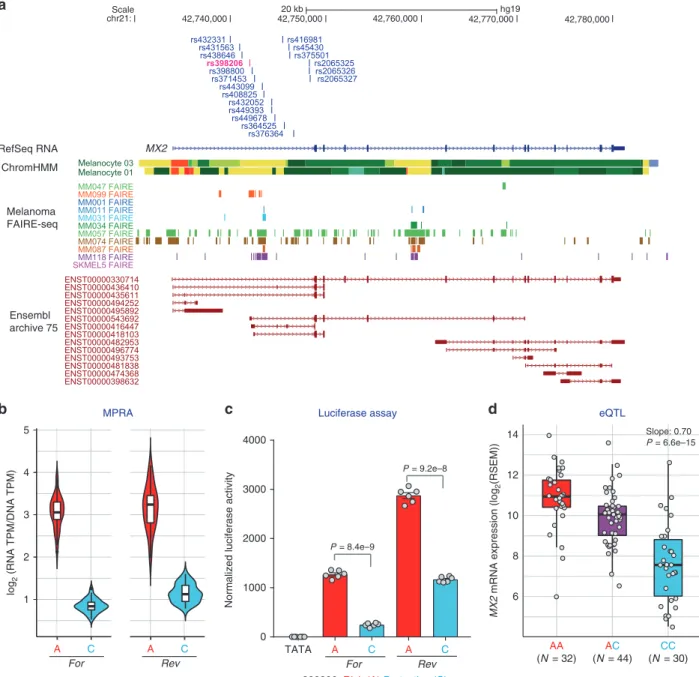
Scale chr21: 20 kb hg19 42,740,000 42,750,000 42,760,000 42,770,000 42,780,000 MX2 ChromHMM Melanoma FAIRE-seq M M Ensembl archive 75 RefSeq RNA log 2 (RNA TPM/DNA TPM) 1 2 3 4 5 A C A C For Rev 6 8 10 12 14 MX2
mRNA expression (log
2 (RSEM)) AA (N = 32) CC (N = 30) AC (N = 44) Slope: 0.70 P = 6.6e–15 0 1000 2000 3000 4000
Normalized luciferase activity
TATA A C A C
For Rev
P = 8.4e–9
P = 9.2e–8
rs398206: Risk (A) Protective (C)
a
b
MPRAc
Luciferase assayd
eQTLFig. 2 rs398206 is a functionalcis-regulatory variant and a significant cis-eQTL for MX2 levels in melanocytes. a Variants that were tested in MPRA from the Chr21q22.3 melanoma locus are shown relative to the genomic position ofMX2. Only the 19 variants located in the first intron of MX2 coming from the primary GWAS signal are shown (the other three from a secondary signal are located upstream of theMX2 genic region). ChromHMM annotation (Primary Core Marks segmentation) of Penis Foreskin Melanocyte Primary Cells from Roadmap Epigenomics Project is shown (Red/OrangeRed: Active_TSS/Flanking_Active_TSS, Yellow/GreenYellow: Enhancers/Genic_enhancers, Green/DarkGreen: Strong_transcription/Weak_transcription). Melanoma FAIRE-seq track of 11 samples is from a study by Verfaillie and colleagues26. Ensembl predicted transcripts from archive 75 are shown.
b Transcriptional activity of 145 bp sequences encompassing rs398206 from MPRA are shown as normalized tag counts (log2(RNA TPM/DNA TPM)). Results from UACC903 melanoma cells are shown for both alleles in forward (For) and reverse (Rev) directions, where results from promoter and enhancer constructs were combined. Center lines show the medians; box limits indicate the 25th and 75th percentiles as determined by R software; whiskers extend 1.5 times the interquartile range from the 25th and 75th percentiles, outliers are represented by dots. Density is reflected in the width of the shape. c Individual luciferase activity assays of 145 bp sequences encompassing rs398206 is shown for UACC903. pGL4.23 construct including minimal TATA promoter was used. One representative set is shown from three biological replicates. Mean with SEM,n = 6. All constructs are significantly higher than pGL4.23 (TATA) control (P < 0.0001, two-tailed, unpaired t-test assuming unequal variance). d eQTL plot of MX2 levels in primary melanocytes in relation to rs398206 is shown for three genotype groups. Center lines show the medians; box limits indicate the 25th and 75th percentiles; whiskers extend 1.5 times the interquartile range from the 25th and 75th percentiles.P-value and slope were derived from linear regression with no multiple-testing correction applied. Source data are provided as a Source Datafile.
with unlabeled probes (Fig.
3
c). Antibody super-shift
demon-strated that YY1 is present in this subset of allelic-binding
pro-teins (Fig.
3
c), which was further validated by EMSAs with
purified recombinant YY1 protein (Fig.
3
c, d). We subsequently
performed chromatin immunoprecipitation (ChIP) using
anti-YY1 antibody and scanned a ~5 Mb genomic region
encom-passing rs398206 in three melanoma cell lines representing each
genotype of rs398206 (AA, AC, and CC). We observed prominent
enrichment of YY1 binding on top of rs398206 in the AA cell line,
a weaker but clear enrichment in the AC line, and even weaker
binding enrichment over rs398206 in the CC line (Fig.
4
a;
Sup-plementary Fig. 14). Given that differences between cell lines (e.g.,
DNA copy number differences, accessibility of chromatin in the
region encompassing rs398206, YY1 levels, and variability in
formaldehyde
fixing and chromatin shearing efficiency) may also
contribute to differential YY1 binding, we also assessed
allele-specific YY1 binding in the heterozygous AC cell line
(UACC647). We performed genotyping of rs398206 using the
DNA fragments pulled down by anti-YY1 antibody. DNA
frag-ments pulled down using YY1 antibody displayed a significant
enrichment of A allele (Mann-Whitney U test, P
= 9.1e−3), while
genomic DNA and serial-diluted input DNA displayed equivalent
signal from both A and C alleles, indicating clear A-allele
pre-ferential binding of YY1 in melanoma cells (Fig.
4
b, c).
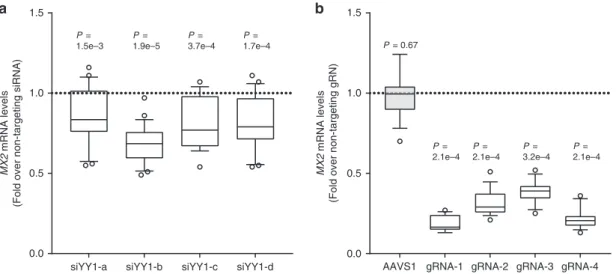
Based on this strong allelic YY1 binding, we next asked if YY1
regulates endogenous MX2 expression levels. siRNA knockdown
of YY1 in the UACC903 melanoma cell line demonstrated a weak
but consistent reduction of MX2 levels by four different sets of
siRNAs (14–32% decrease, P = 1.5e−3–1.9e−5, one-sample
Wilcoxon test; Fig.
5
a; Supplementary Fig. 15a) indicating a
regulation of MX2 levels by YY1. To further determine if the
genomic region encompassing rs398206 regulates endogenous
MX2 levels, we targeted this region by CRISPRi using
dCAS9-KRAB-MeCP2
38in the same melanoma cell line. Four gRNAs
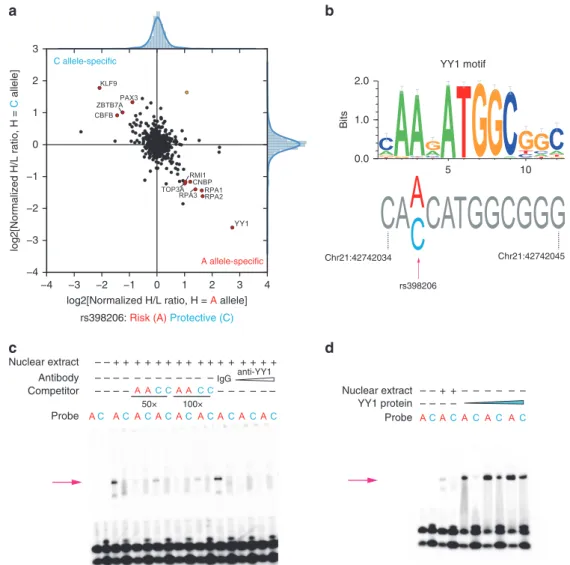
a
b
50× 100× anti-YY1 IgG Probe YY1 protein Antibody Nuclear extract Competitor Probe Nuclear extract – – + + + + + + + + + + + + + + + + – – – – – – – – – – – – – – – – – – – – – – – – + + – – – – – – – – – –c
d
YY1 motif rs398206 −4 −3 −2 −1 0 1 2 3 4log2[Normalized H/L ratio, H = A allele] −4 −3 −2 −1 0 1 2 3 log2[Normalized H/L ratio, H = C allele] A allele-specific C allele-specific 0.0 1.0 2.0 Bits 5 10 Chr21:42742034 Chr21:42742045
rs398206: Risk (A) Protective (C)
Fig. 3 rs398206 displays allele-preferential binding to YY1. a Quantitative mass-spectrometry of rs398206 using nuclear extract of UACC903 and 21 bp double-stranded DNA probes with A (risk) or C (protective) alleles. A-allele specific interacting proteins are shown in the bottom right quadrant, and C-allele specific interactors in the top left quadrant. Using label-swapping of high(H)-mass or low(L)-mass label, the A-bound/C-bound ratio is shown on the x-axis, and the C-bound/A-bound ratio on the y-axis. Proteins passing the inter-quartile >3 cutoff for both axes are color-coded for consistent (red circle) and inconsistent (yellow circle) direction from label-swapping. Names of consistently identified proteins are shown. b YY1 binding motif is shown as a position weight matrix at the top (motif obtained from HOCOMOCO database and plotted using weblogo3). The genomic sequence surrounding rs398206 is shown at the bottom with the risk-associated A allele matching the consensus YY1-binding motif. Genomic positions are hg19.c–d EMSAs using 21 bp double-stranded DNA probes witha or c alleles of rs398206 and nuclear extract from UACC2331 melanoma cells (c) or purified recombinant YY1 protein (d). Antibody super-shift using anti-YY1 antibody is shown at the last lanes of c, where the A-specific band (arrows) is diminished. Representative sets from three replicates (c) and one replicate (d) are shown. Source data are provided as a Source Datafile.
targeting the genomic regions either directly overlapping
rs398206 (gRNA 1, 3, and 4) or ~25 bp upstream (gRNA 2)
resulted in 61–82% reduction in MX2 expression levels (P = 2.05e
−4–3.19e−4, one-sample Wilcoxon test; Fig.
5
b), while the same
gRNAs do not have effect on nearby MX1 expression
(Supplementary Fig. 15b). As rs398206 is located in the intronic
region of MX2, it is formally possible that some of the effect on
MX2 expression could be due to physical blocking of passage of
transcriptional machinery by the dCAS9-KRAB-MeCP2 system.
CRISPRi using dCAS9 without the transcriptional repressor
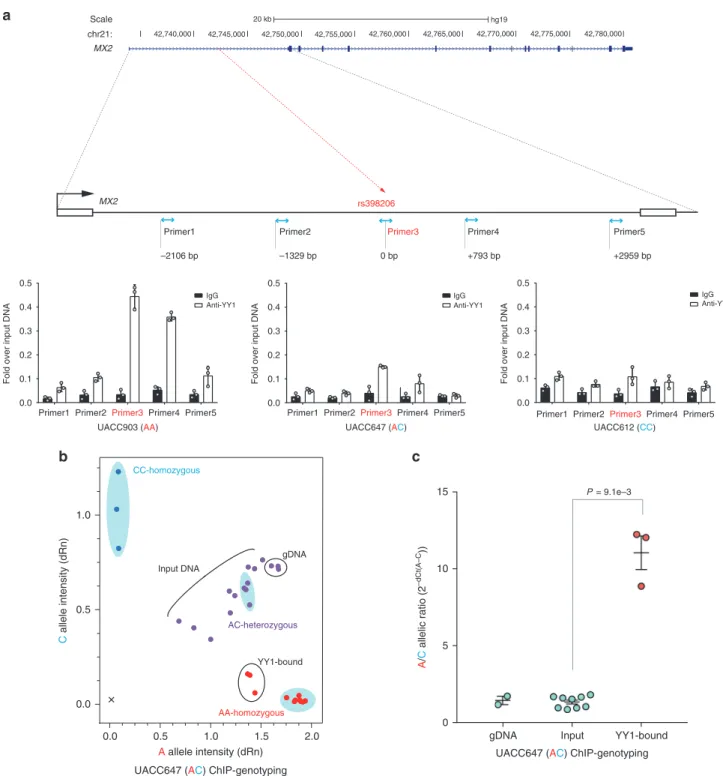
MX2IgG Anti-YY1
rs398206
Primer1 Primer2Primer3 Primer4 Primer5
IgG Anti-YY1
Primer1 Primer2Primer3Primer4 Primer5 0 bp
Primer1 Primer2 Primer3 Primer4 Primer5
–1329 bp
–2106 bp +793 bp +2959 bp
UACC903 (AA) UACC647 (AC)
20 kb hg19 42,740,000 42,745,000 42,750,000 42,755,000 42,760,000 42,765,000 42,770,000 42,775,000 42,780,000 Scale chr21: MX2 A allele intensity (dRn) C allele intensity (dRn) AA-homozygous AC-heterozygous CC-homozygous gDNA YY1-bound Input DNA
a
b
c
gDNA Input YY1-bound
0 5 10 15 A / C allelic ratio (2 –dCt(A–C )) P = 9.1e–3 0.0 0.5 1.0 1.5 2.0 0.0 0.5 1.0
Primer1 Primer2 Primer3Primer4 Primer5 UACC612 (CC) 0.0 0.1 0.2 0.3 0.4 0.5
Fold over input DNA
0.0 0.1 0.2 0.3 0.4 0.5
Fold over input DNA
0.0 0.1 0.2 0.3 0.4 0.5
Fold over input DNA
IgG Anti-YY1
UACC647 (AC) ChIP-genotyping
UACC647 (AC) ChIP-genotyping
Fig. 4 YY1 preferentially binds to the rs398206-A allele in melanoma cells. a Chromatin immunoprecipitation using anti-YY1 antibody or normal IgG followed by qPCR. On the top panel, genomic positions of the amplicons usingfive qPCR primer sets are shown relative to rs398206 (red dashed line) in thefirst intron of MX2. qPCR results from three melanoma cell lines are shown on the bottom panel with genotype for rs398206 indicated in the X-axis label. Relative quantities are shown as fold over input DNA. Mean of PCR triplicates with SD are plotted. One representative set of three biological replicates for each cell line is shown.b Taqman genotyping of rs398206 using YY1 ChIP DNA in UACC647 melanoma cells (heterozygous for rs398206). The blue shaded areas mark HapMap CEU DNA controls showing separation of three genotype clusters. qPCR triplicates were plotted separately. One representative set from three biological replicates is shown. Normalized A and C allele intensity is shown as dRn values onx and y-axis, respectively. gDNA: genomic DNA.c Combined plot for A/C allelic ratio from three rounds of biological replicates of UACC647. Each dot represents A/C ratio calculated from 2-(average dCt(alleleA-alleleC))from qPCR triplicates. Input includes three 10-fold serial dilutions from each round. Mean with SEM are plotted. A two-tailed Mann–Whitney U test was used for n = 9 (Input) and 3 (YY1-bound). Source data are provided as a Source Data file.
elements, however, displayed little or no effect on MX2
expression, which is consistent with the CRISPRi effect on MX2
being mainly transcriptional (Supplementary Fig. 15c–e).
To identify additional support for rs398206 regulating MX2 via
YY1, we examined available chromatin interaction data involving
YY1. Notably, YY1 was recently shown to mediate chromatin
looping and contribute to interactions between gene promoters
and enhancers within TADs
39. Given this, we examined
YY1-mediated chromatin interaction around the genomic region
encompassing rs398206 in these published Hi-ChIP data using
YY1 antibody. In the human colorectal carcinoma cell line,
HCT116, the 5Kb bin harboring rs398206 displayed a strong
interaction with the adjacent bin encompassing MX2 promoter
area
39(PET count
= 18, P = 2.27e−80, hypergeometric test;
Supplementary Fig. 16). Together these data determined that
rs398206 is a functional variant regulating MX2 expression via
differential YY1 binding in the Chr21q22.3 melanoma locus.
MX2 accelerates melanoma formation in zebra
fish. MX2 is best
known for its function in innate immunity as an HIV-1
restric-tion gene
40,41. In GTEx tissue types, the highest MX2 expression
levels are observed in EBV-transformed lymphocytes, whole
blood, and spleen, reflecting its main role in innate immune
response as an interferon-stimulated gene (GTEx portal;
https://
gtexportal.org
). On the other hand, a previous study also
demonstrated that MX2 has cell-autonomous function in the
proliferation of HeLa cells without IFNα-mediated induction
42.
In our primary melanocyte dataset, MX2 is expressed at a
rela-tively high level (median expression ranked at top 26.5% of all
expressed genes) without IFNα stimulation. To assess
co-expressed genes and enriched pathways in melanocytes
expres-sing MX2 at a higher level, we profiled differentially expressed
genes between MX2-high (top 25%; n
= 28) and MX2-low
(bot-tom 25%; n
= 28) melanocytes from 106 individuals. We
identi-fied 253 differentially expressed genes in MX2-high melanocytes
(FDR < 0.01 and |log
2fold difference| >1; Supplementary Data 2),
which include many of the top correlated immune-response genes
based on pairwise comparisons of all expressed genes in the full
melanocyte set (Supplementary Data 3; Supplementary Table 10).
Significantly enriched pathways in these 253 differentially
expressed genes included those relevant to cellular immune
response as might be expected, but also included those affecting
cellular growth and cancer (Fig.
6
a; Supplementary Table 11)
suggesting a possible melanocyte-specific function of MX2 not
limited to immune function. On the other hand, an examination
of immune infiltrates in melanomas from TCGA did not provide
sufficient evidence for the roles of MX2 in tumor immune
sur-veillance other than weak correlations with infiltration of a few
cell types (Supplementary Note; Supplementary Fig. 17).
Given the possibility of a melanocyte-specific function of MX2,
we hypothesized that melanocyte-specific MX2 expression might
have roles in early events of melanoma formation. To test this
hypothesis, we
first asked if MX2 affects growth of primary
melanocytes and melanoma cells in a single culture system. Cell
growth assays using the xCELLigence system demonstrated
that inducible lentiviral expression of MX2 (2–10-fold induction
at 72 h; Supplementary Fig. 18a, b) resulted in slightly decreased
growth of both melanoma cells and primary melanocytes at
100 ng/ml of doxycycline treatment, while empty vector
trans-duced cells did not show any difference (Fig.
6
b, c). To begin to
understand what genes and pathways might be affected by
increased MX2 expression and could potentially underlie the
altered melanoma cells/melanocytes growth, we performed
RNA-seq analyses on melanocytes over-expressing MX2 (2–10-fold
induction at 72 h; Supplementary Fig. 18a, c). Differentially
expressed genes in MX2-overexpressing melanocytes compared
to controls (158 genes, FDR < 10%; melanocytes from 3
individuals, 3 biological replicates each; Supplementary Data 4)
displayed enrichment of pathways relevant to immune response,
as well as those involving second messenger mediated kinase
signaling and cellular growth, among others (Supplementary
Table 12; Fig.
6
d). We subsequently examined pathways enriched
at a shorter time point after MX2 induction (6 h, melanocytes
from one individual, 3 biological replicates) and observed
consistent results highlighting intracellular second messenger
a
siYY1-a siYY1-b siYY1-c siYY1-d 1.5 1.0 0.5 0.0 P = 1.5e–3 P = 1.9e–5 P = 3.7e–4 P = 1.7e–4 MX2 mRNA levels
(Fold over non-targeting gRN)
MX2
mRNA levels
(Fold over non-targeting siRNA)
1.5 1.0 0.5 0.0
b
P = 2.1e–4 P = 2.1e–4 P = 2.1e–4 P = 3.2e–4AAVS1 gRNA-1 gRNA-2 gRNA-3 gRNA-4
P = 0.67
Fig. 5 YY1 and rs398206 affectMX2 expression in melanoma cells. a YY1 was knocked down using four different siRNAs in UACC647 cells, and MX2 levels were measured.GAPDH-normalized MX2 mRNA levels are shown as fold change over those from non-targeting siRNA. Four biological replicates of n = 6 were combined (total n = 24). b CRISPRi using dCAS9-KRAB-MeCP2 and four different gRNAs targeting rs398206 in UACC903 cells. MX2 mRNA levels (GAPDH-normalized) are shown as fold change over those from non-targeting gRNA. Three biological replicates of n = 6 were combined (total n = 18, except gRNA-3,n = 17). gRNA 1, 3, and 4 directly overlap rs398206. gRNA 2 targets ~25 bp upstream of rs398206. AAVS1 (gRNA targeting adeno-associated virus integration site on Chr19). Box: Median and 25th to 75th percentile. Whisker: 10th to 90th percentile.P-values are shown from one-sample Wilcoxon test (two-sided) for difference from non-targeting siRNA/gRNA. Dotted line denotes theMX2 levels in non-targeting siRNA/gRNA control. Source data are provided as a Source Datafile.
signaling, cancer, cell growth, neurotransmitters, cardiovascular
signaling, in addition to cellular immune response
(Supplemen-tary Note; Supplemen(Supplemen-tary Data 5 and 6; Supplemen(Supplemen-tary Tables 13
and 14). Since these data did not provide strong support for a
specific mechanistic hypothesis linking the effect of increased
MX2 on reduced melanocyte growth in single cultures to its
association with melanoma risk, we speculated that the effect of
MX2 on melanocyte growth might change depending on cellular
context and microenvironment.
To test this idea and establish a melanocyte-specific role for
MX2 expression in the development or progression of melanoma,
we examined transgenic expression of human MX2 in a zebrafish
melanoma model, in conjunction with the most recurrent somatic
driver event of melanoma, BRAF
V600E. Using the previously
developed miniCoopR transgene system
43, we over-expressed
human MX2 exclusively in the melanocytic-lineage using an
MITF promoter in the background of BRAF
V600Eand p53
−/−.
The results demonstrated that zebrafish with transgenic human
b
e
0 20 40 60 80 100 5 10 15 20 Melanoma-free survival (%) Time (weeks) EGFP (n = 194) MX2 (n = 184) P = 3e–3Normalized cell index
MX2 dox 0 MX2 dox 1 MX2 dox 10 MX2 dox 100 Empty dox 0 Empty dox 1 Empty dox 10 Empty dox 100 Hour Dox 20 40 60 80 –1 0 1 2 3 20 40 60 80 –1 0 1 2 3 4 5 Hour
Normalized cell index
MX2 dox 0 MX2 dox 1 MX2 dox 10 MX2 dox 100 Empty dox 0 Empty dox 1 Empty dox 10 Empty dox 100
c
Primary melanocytesMelanoma cells (UACC2545)
P value threshold Positive Z -score
Negative Z -score
0 0.25 0.5 0.75 1 1.25 1.5 1.75 2 2.25 2.5 2.75 3 Superpathway of inositol
Phosphate compounds Apelin endothelial signaling IL-8 signaling Ga12/13 signaling Cardiac hypertrophy signaling D-myo-inositol-5-phosphate metabolism Opioid signaling Endothelin-1 signaling Protein kinase A signaling Adrenomedullin signaling
d
a
0 0.5 1 1.5 2 2.5 3 3.5 4 4.5 5 5.5 6 6.5 7 7.5 8 8.5 9 –log(P value) –log(P value) Osteoarthritis pathway Interferon signaling GP6 signaling Coagulation system Colorectal cancer metastasis signaling ILK signaling Ovarian cancer signaling Acute phase response signaling STAT3 pathway TGF-b signaling Endocannabinoid cancer inhibition pathway Leukocyte extravasation signaling p38 MAPK signaling PTEN signalingMX2-overexpressed vs. control melanocytes
MX2-high vs. -low melanocytes
Dox
f
Tg(mitfa:BRAFV600E),p53–/–,mitfa–/–
+ miniCoopR mitfa:EGFP
Tg(mitfa:BRAFV600E),p53–/–,mitfa–/–
MX2 expression presented an accelerated melanoma formation
(46% of
fish developed melanoma by 19 weeks; n = 184)
compared to those with GFP controls (33% of
fish by 19 weeks;
n
= 194) in this genetic background (P = 0.003; log-rank test;
Fig.
6
e, f). While we did not see significant difference in tumor
count and pigmentation between the two groups, we observed
larger tumor size in the MX2 group compared to GFP control
group at median onset (P
= 0.028; chi-square test), which is
consistent with accelerated tumor formation demonstrated
through survival analysis (Supplementary Fig. 19). We further
performed histopathology analyses of zebrafish melanomas and
did not observe gross difference in tumor morphology and
invasion between MX2 and GFP groups (Supplementary
Fig. 20a–d). Immunohistochemistry for phospho-Histone H3
also did not display a significant difference in cell proliferation
between two groups (P
= 0.47, two-tailed t-test, n = 5;
Supple-mentary Fig. 20e–g). Together these data are consistent with MX2
expression contributing to an increased melanoma risk, however
consistent with in vitro data, likely through a mechanism other
than increased cell proliferation.
Discussion
In this study, we adopted an integrative approach combining
MPRA with cell-type specific epigenomic and eQTL data to
efficiently nominate functional variants and susceptibility genes
from 20 known melanoma GWAS loci. We demonstrate that
MPRA is a high-throughput variant prioritization tool
com-plementing statistical
mapping. While Bayesian
fine-mapping methods could nominate a small number of credible
causal variants for functional testing, these methods are
none-theless limited by their dependence on imputability, imputation
quality, population LD reference, causal assumptions, and choice
of functional annotation datasets
44,45. Further, variants that are
tightly linked by LD are often still difficult to distinguish based
solely on the genetic data and require individual functional
testing. To this end, MPRA provides an agnostic approach to
quickly screen a large number of variants linked by LD without
relying on assumptions about LD structure or number of causals.
By applying a conservative cutoff, we identified 39 variants
dis-playing allelic transcriptional activity from 14 melanoma GWAS
loci and showed that they are more likely to change transcription
factor binding preference and more likely to be causal compared
to the rest of the tested variants. Starting from an average of 52
high-LD melanoma-associated variants per locus that overlap
active chromatin regions, MPRA narrowed the candidate variants
down to an average of 2.78 per locus. These results highlight the
utility of our approach in complementing statistical
fine-mapping
and breaking up LD structure using a functional assay. To further
prioritize variants functioning through cis-regulation of local gene
expression, we integrated the 39 MPRA significant variants with
melanocyte eQTL data which best represents the cell type of
origin for melanoma. By choosing the variants displaying the
same allelic directions as those from eQTL, we nominated a short
list of candidate genes and variants from four loci. In particular,
from the locus on chromosome band 21q22.3, 5 of 22 total tested
variants are in near perfect LD (r
2> 0.99) with the GWAS lead
SNP (rs408825), including the lead SNP from the original study
identifying this locus (rs45430)
9(Supplementary Table 8). While
both Bayesian
fine-mapping using PAINTOR in this study and
eQTL colocalization using eCAVIAR from our previous study
24assigned higher probability scores for some of these perfect LD
SNPs as causal variants for melanoma risk and/or eQTL, MPRA
results for this set of 22 SNPs determined rs398206 (r
2= 0.94
with the lead SNP) as the most significant functional variant.
Integrating this result with melanocyte eQTL nominated MX2 as
the best candidate susceptibility gene, and we performed
thor-ough functional characterization of this locus including
generat-ing an animal model as a proof of principle.
In addition, our integrative approach efficiently identified the
most plausible susceptibility genes and functional variants from
three other melanoma GWAS loci. For the melanoma locus on
chromosome band 22q13.1, increased MAFF levels were
corre-lated with risk. MAFF is a small Maf protein regucorre-lated by EGF
signaling
46and plays a role in the oxidative stress response
47,
which is relevant to melanomagenesis, given the vulnerability of
melanocytes to oxidative stress attributable to melanin
produc-tion
48. For the locus on chromosome band 1q21.3 and 2q33-q34,
lower CTSS and CASP8 levels were correlated with the risk,
respectively. CTSS is a member of cathepsin proteases, initially
known as lysosomal enzymes
49. Increased expression of CTSS is
correlated with poor prognosis in the context of some cancers
(breast and colorectal cancer) but also correlated with better
outcome in others (lung cancer). CASP8 is mainly known for its
function in apoptosis
50, and GWAS also implicated the CASP8
locus for breast cancer
51and basal cell carcinoma
52. Our results
provide strong support for these three genes and warrant further
in-depth characterization.
Our approach also successfully identified a small number of
candidate functional variants (median 1 variant per locus) in nine
Fig. 6 MX2 accelerates melanoma formation. a Ingenuity Pathway Analysis of differentially expressed genes fromMX2-high vs. MX2-low melanocytes from 106 individuals. 252 differentially expressed genes (FDR < 1% and >2-fold change) betweenMX2-high and MX2-low melanocytes (top and bottom quantile based onMX2 levels; n = 28 each) from 106 individuals were used as input for the analysis. Enrichment P-values are based on a two-sided Fisher’s exact test with no multiple-testing correction applied. (B-C) Cell growth and movement of human primary melanocytes C23 (b) or melanoma cell line UACC2545 (c) infected with an inducible lentiviral construct ofMX2 cDNA or Empty pINDUCER20 vector were measured on xCELLigence system. Cell Index values were normalized relative to those at the time of doxycycline addition (dotted vertical line: Dox). The amount of doxycycline (dox) is shown in ng/ml and color-coded. Mean Normalized Cell Index (colored dots) and SD (gray vertical lines) are plotted (n = 3). A representative set of three biological replicates is shown.d Ingenuity Pathway Analysis of differentially expressed genes from RNA sequencing ofMX2 overexpressed vs. control melanocytes from 3 individuals. 158 differentially expressed genes (FDR < 10%) betweenMX2-overexpressing (100 ng/ml doxycycline) vs. control (no doxycycline) melanocytes using 3 biological replicates for 3 individuals were used as input for the analysis. Significantly enriched canonical pathways (P < 0.05 and |Z-score| >1) are color-coded for the direction of effect relative toMX2-high melanocytes (a) or MX2-overexpressing melanocytes (d). Enrichment P-values are based on a two-sided Fisher’s exact test with no multiple-testing correction applied. A weaker to stronger shade of each color represent the relative magnitude ofZ-scores: Positive Z-score between 1 and 2.646 and negative Z-score between −1 and −3.464 (a) or positive between 1 and 1.134 and negative between−1.342 and −2.236 (d), where lightest red is closer to 1 and lightest blue is closer to −1. (e) Representative pictures of adult fish from GFP or MX2 group. Pictures were taken at week 10 post-injection.f Melanoma-free survival curves of a zebrafish melanoma model43(Tg(mitfa:
BRAFV600E),p53−/−, mitfa−/−). The fish were injected at the one cell stage with either miniCoopR mitfa:MX2 or miniCoopR mitfa:EGFP and monitored weekly for melanoma formation. The percentage of melanoma-freefish was combined from three independent experiments and plotted. Log-rank test was used. Source data are provided as a Source Datafile.
melanoma loci not currently supported by cell-type specific
melanocyte eQTLs (Supplementary Table 6). These variants may
represent plausible functional candidates for loci where we are
underpowered to detect melanocyte cis-eQTLs from only 106
cultures. Alternatively, as our eQTL dataset is based on gene
expression patterns captured in cultured primary melanocytes, it
is possible that these variants may function within specific cellular
contexts not captured in this eQTL dataset. Given that our
MPRA assay was conducted in melanoma cells, it may be possible
that such variants, for example, may only be functioning in the
context
of
oncogenic
signaling
(e.g.,
oncogenic
BRAF),
tumor suppressor loss (e.g., CDKN2A), or immortalizing events
(e.g., mutation of the TERT promoter). Future evaluation of
these variants in the context of additional genome-scale
datasets, including cell-type specific chromatin interaction data,
as well as chromatin features of different cellular contexts, may
strengthen or clarify evidence for functionality of leads for
these loci.
Through molecular interrogation, we demonstrated that a
melanoma-associated intronic variant, rs398206, contributes to
allelic expression of MX2 via modifying an enhancer element
recruiting the transcription factor, YY1. Our multi-QTL analyses
of primary melanocytes further supported a transcriptional
mechanism, while ruling out an alternative mechanism through
splicing. While our data demonstrated the YY1 transcription
factor plays a major role in MX2 regulation via the functional
SNP, it is also possible that other trans-acting factors, perhaps
among other proteins identified through mass-spec with less
pronounced allelic difference (e.g., KLF9, ZBTB7A, PAX3),
could also play a role in the observed allelic transcriptional
regulation.
Our zebrafish model provided further support for MX2 as a
melanoma susceptibility gene accelerating melanoma formation
when expressed in the cells of melanocytic-lineage. MX2 has been
mainly known as an effector of innate-immunity, conferring
restriction to HIV-1 infection
40,41, and its roles in
melanoma-genesis have not been studied well. Our
findings suggest a role of
MX2 in promoting melanoma formation when exclusively
expressed in cells of melanocytic-lineage, in the presence of
BRAF
V600E, a frequent somatic driver mutation. Unlike the
relatively high level of MX2 overexpression in the zebrafish
model, increased melanoma risk and MX2 levels associated with
this common functional variant (rs398206 risk allele frequency
=
0.61, EUR) in human populations are rather modest, which is
nearly always the case for cancer-associated common variants. It
is possible that the effect of increased MX2 levels have roles only
in specific contexts during the process of melanoma development.
Our single cell-type growth assays for MX2 also show growth
effects for MX2 in melanocytic-lineage in the absence of
neigh-boring cell types from the skin, albeit in the opposite direction. A
recent study also reported that MX2 over-expression resulted in
decreased growth in primary melanocytes and melanoma cells,
while the effect could be the opposite in a subset of melanoma
cells
53. Our zebrafish tumor proliferation assay also suggested
that accelerated melanoma formation by MX2 might not be due
to increased proliferation per se. Given this apparent complexity,
we speculate that MX2 function in the growth of cells of
mela-nocytic lineage might depend on cellular context (e.g., somatic
driver events) and or interaction with microenvironment (e.g.,
immune cells). Further studies will be required to tease out the
discrepancy between single cell-type assay and zebrafish
model, as well as the molecular mechanisms of how MX2
con-tributes to melanoma promotion. Nevertheless, our
findings
established MX2 as a gene displaying pleiotropic roles in
mela-noma susceptibility and immune response, building on to the
established roles of telomere biology (TERT, Chr5p15.33)
19and
oncogene-induced senescence (PARP1, Chr1q42.1)
18in genetic
susceptibility to melanoma in the general population.
Methods
Melanoma GWASfine-mapping. Fine-mapping of the 20 genome-wide sig-nificant loci from the meta-analysis reported by Law and colleagues1was
con-ducted following a very similar approach to that of Barrett et al.54. Using the results
from Law et al.1a window was defined as 1 Mb on either side of the most
sig-nificant variant at each locus. The only exception to this was the region that included the ASIP gene (20q11.2-q12), where a 6 Mb region was instead defined, as this region demonstrated a long-range linkage disequilibrium. Melanoma case/ control status was regressed on each genotyped and imputed variant in turn across these regions, with thefirst four principal components as covariates to account for stratification on 12,419 cases and 14,242 controls from the meta-analysis (only the Harvard GWAS samples and the endometriosis controls from the Q-MEGA_610k study were unavailable). Each region was further narrowed down to the interval covering 500 kb on either side of the most extreme SNPs with p-value <10−6in the initial single SNP analysis and any variants with an imputation INFO score <0.5 (for variants with MAF >= 0.03) or INFO score <0.8 (for variants with MAF < 0.03) was removed. A Bayesian-inspired penalized maximum likelihood approach implemented in HyperLasso25was applied to these regions. 100 iterations of
HyperLasso were then conducted, using all variants in each region and a Normal Exponential Gamma prior distribution for SNP effects with a shape parameter 1.055,56and scale parameter such that type 1 error is 10−4. Both the study (as a
categorical variable) and thefirst four components were included as covariates. Because of the stochastic nature of the order in which variables are tested for inclusion, this produced a number of potential models, including some that can be considered to‘correspond’ to one another, because they differ only by substituting genetic variants that are in very strong LD (r2> 0.9). By dropping equivalent
models, a reduced set of models was produced and was then further reduced by dropping any model whose likelihood was inferior to that of the best model by a factor >= 10. For each remaining model, a logistic regression was conducted using the SNPs in the model to generate adjusted odds ratios. For SNPs retained in any of the models, LD blocks were defined (based on both the HyperLasso results and strength of LD) and the most significant SNP (in a multivariable analysis) from each block was selected. rs36115365 in the region near TERT gene (5p15.33) was not identified in the fine-mapping but included for variant selection as it was identified previously based on functional evidence19. Subsequent analysis showed
that the risk-associated alleles at rs36115365 and at rs2447853 (the most significant SNP in the region at the time) are in negative LD and when adjusted for the latter SNP, rs36115365 has a P-value of 10−4(Supplementary Table 1). Similarly, for the locus on chromosome band 2p22.2, the optimal model was a 2-SNP, but the secondary signal at rs163094 displayed low INFO scores in some studies rendering imputation less optimal and hence was not used for variant selection. Instead, the best SNP identified by 1-SNP model (rs1056837; a missense variant of CYP1B1) was included as an alternative (Supplementary Table 1). Since the effect of the region around MC1R gene (16q24.3) on melanoma risk is mainly explained by several well-established coding variants12, we did not include this region in our
fine-mapping data.
MPRA variant selection. Among 20 genome-wide significant loci from the mel-anoma meta-analyses by Law and colleagues1, we prioritized 16 loci where
potential cis-regulatory mechanism could be applied. We excluded the other 4 loci containing genes that are implicated in melanoma-associated pigmentation phe-notypes (SLC45A2, TYR, MC1R, and ASIP loci), as for many of these genes, coding variants were shown to alter the protein functions. To select high-LD proxy var-iants for 16 melanoma GWAS loci (Law et al., 20151), we used the following
criteria:
1. Primary lead SNPs were taken from Law et al.1meta-analysis paper and
supplemented by those from additional HyperLasso analysis when there are alternative best SNPs available.
2. For 8 loci, HyperLasso analysis nominated independent multiple secondary signals and these lead SNPs were also added.
3. SNPs of r2> 0.4 with the primary or secondary lead SNPs using 1000
Genomes phase3 EUR or CEU populations were selected as high-LD variants (n= 2748).
To prioritize high-LD variants overlapping melanocyte/melanoma open chromatin regions and/or active promoter/enhancer histone marks, we used one or more of the following criteria:
1. Variant is located within a human melanocyte DHS peak from one or more individuals of three available through ENCODE and Epigenome Roadmap database.
2. Variant is located within a human melanocyte H3K27Ac ChIP-Seq peak from one or more individuals and a H3K4Me1 ChIP-Seq peak from one or more individuals of two and three available through Epigenome Roadmap database, respectively.
3. Variant is located within a human melanocyte H3K27Ac ChIP-Seq peak from one or more individuals and a H3K4Me3 ChIP-Seq peak from one or