HAL Id: hal-01069269
https://hal-onera.archives-ouvertes.fr/hal-01069269
Submitted on 29 Sep 2014
HAL is a multi-disciplinary open access archive for the deposit and dissemination of sci-entific research documents, whether they are pub-lished or not. The documents may come from teaching and research institutions in France or abroad, or from public or private research centers.
L’archive ouverte pluridisciplinaire HAL, est destinée au dépôt et à la diffusion de documents scientifiques de niveau recherche, publiés ou non, émanant des établissements d’enseignement et de recherche français ou étrangers, des laboratoires publics ou privés.
T. Vandellos, E. Martin, Dominique Leguillon
To cite this version:
T. Vandellos, E. Martin, Dominique Leguillon. Comparison between cohesive zone models and a coupled criterion for prediction of edge debonding. 16th European Conference on Composite Materials, Jun 2014, SEVILLE, Spain. �hal-01069269�
1
COMPARISON BETWEEN COHESIVE ZONE MODELS AND A
COUPLED CRITERION FOR PREDICTION OF EDGE DEBONDING
T. Vandellosa*, E. Martinb, D. Leguillonc
a
ONERA – The French Aerospace Lab, F-92322 Châtillon, France b
LCTS, CNRS UMR 5801, Université de Bordeaux, 3 rue La Boétie, 33600 PESSAC, France c
IJLRA, CNRS UMR 7190, Université Pierre et Marie Curie, 4 place Jussieu, 75252 PARIS Cedex 05, France
*thomas.vandellos@onera.fr
Keywords: Failure analysis, Finite Fracture Mechanics, Cohesive Zone Model.
Abstract
The onset of edge debonding within a bonded specimen submitted to bending is modeled with two numerical approaches: the coupled criterion and the cohesive zone model. The comparison of the results obtained with the both approaches evidences that (i) the prediction of edge debonding strongly depends on the shape of the cohesive law and (ii) the trapezoidal cohesive law is the most relevant model to predict the edge debonding as compared with the coupled criterion.
1. Introduction
The prediction of the onset of interface debonding is generally performed using a stress criterion [1] or linear fracture mechanics [2]. In each case, a characteristic length is needed which has to be identified experimentally. A first alternative approach is the use of a cohesive zone model [3] which simulates a progressive debonding build up in terms of continuum damage variables. It was shown by previous authors that the shape of the cohesive zone model (for a given value of the fracture toughness) does not have any influence on the steady state propagation of a rectilinear crack [4]. This result does not hold at crack initiation for which the shape of the cohesive law has a strong influence [4]. A second alternative approach is the coupled strength and energy criterion [5] which permits the prediction of the applied load involving the onset and the associated crack nucleation length. This approach has proved to be successful to analyze the onset of fracture mechanisms within composite materials [6,7,8] and bonded specimens [9,10]. An extension to the 3D geometry has been recently proposed [11] but, at the moment, the use of cohesive zone models seems to be easier.
The aim of this paper is to assess the capabilities of cohesive zone models to predict the failure onset of a bonded specimen submitted to bending as compared with the coupled criterion. In this study, it is important to note that the coupled criterion is just considered as a numerical reference solution; but this assumption should be experimentally verified. First, the both approaches are described. Second, several shapes of the cohesive law are compared to the coupled criterion in order to show their influence on the prediction. Finally, with the most relevant shape, the influence of the interfacial properties on the prediction of the edge debonding is presented to conclude about the use of the cohesive zone model.
2
2. The coupled criterion
As proposed by a previous author [5], combining an energy and a stress condition allows to derive an initiation criterion in the vicinity of a stress concentration. First, an energy balance between an elastic state prior to any crack growth and after the onset of a crack extension of area δS leads to the following incremental energy condition:
C inc G δS a W 0 W a G (1)where W(0) is the potential energy at the initial state (without crack), W(a) is the potential energy at the final state (with a crack of length a) and Ginc is the incremental energy release
rate in which the infinitesimal energy rates of the classical Griffith approach are replaced by finite energy increments.
Second, a stress condition states that the normal out-of-plane stress σ along the anticipated path of crack nucleation is greater than the relevant strength σC
x σ forx aσ C (2)
Finally, for a monotonic and increasing applied loading, the crack increment and the applied load at nucleation are obtained by combining the equations (1) and (2).
3. The cohesive zone models
Cohesive zone models are used to describe the behavior of interfaces. More precisely, the traction in mode I (i.e. the opening mode of fracture), T1 (resp. T2 in mode II (shearing
mode)), between the top and bottom surfaces of the interface is related to the relative displacement in mode I δ1 (resp. δ2 in mode II). Several shapes of cohesive law (bilinear,
tri-linear and trapezoidal [12]), including an elastic part, can be obtained using the constitutive law written as
λ -1 Kδ T Kδ α T 0 δ if λ -1 Kδ T λ -1 Kδ T 0 δ if 2 2 1 C 1 1 2 2 1 1 1 (3)where K is the initial stiffness of the interface, αC is a penalization factor for out-of-plane
compression, λ is the damage variable, related to the damage kinetics, and f(λ) represents the effect of damage. The evolution of the damage variable λ is defined by
0 λ and δ δ if ,1 ) δ δ(δ δ) (δ δ α ) δ δ(δ min λ δ δ δ if ) δ δ(δ δ α δ δ) (δ λ δ δ if 0 λ * f * f 0 σ f * * 0 * 0 0 σ * 0 0 (4)
3 The relative displacement δ is determined by
2 2 2 1 δ δ δ (5)where <.>+ are the classical Macaulay brackets defined by
0,x maxx (6)
It should be noted that, in order to avoid damage under pure out-of-plane compressive normal stress, the normal relative displacement 1 is only taken into account when positive.
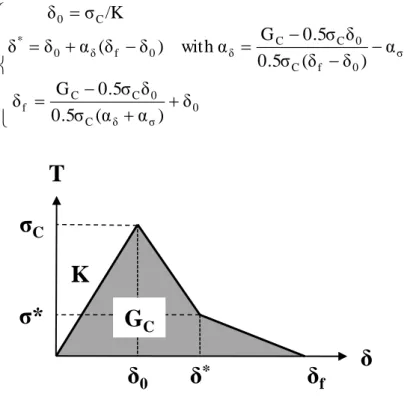
Parameters δ0 and δf are material constants corresponding respectively to the relative
displacement associated with the damage threshold σC and the interfacial stiffness K, and to
the relative displacement attained when the energy release rate G is equal to the fracture toughness GC. The threshold δ* is the relative displacement associated with the maximal
damageable stress σ* which represents the admissible stress on the interface at the end of the first part of the damage process. It is defined by σ*=σC where is a shape parameter. The
value of δ* depends on the shape parameter δ. The couple (δ, defines where the negative slope of the cohesive law can changed. Finally, the relative displacements δ0, δ*and
δf, represented in Figure 1, are defined by
0 σ δ C 0 C C f σ 0 f C 0 C C δ 0 f δ 0 * C 0 δ ) α (α 0.5σ δ 0.5σ G δ α ) δ (δ 0.5σ δ 0.5σ G α with ) δ (δ α δ δ /K σ δ (7)
Figure 1. Representation of the relative displacements of the constitutive law from a tri-linear cohesive model
The shape of the cohesive law only depends on the values of the both shape parameters (δ, σ) which are equal to (0,1) for the bilinear law and (δ, for the trapezoidal one. The
three laws are illustrated in Figure 2 for identical interfacial properties (σC,GC). In the next
paragraphs, the value of the relative displacement δ0 has been imposed to 1.10-5 mm for all
simulations. It is important to note that the parameter δ0 is just considered as a numerical
parameter. Moreover, two tri-linear shapes have been used, with (δ, σ) = (,) and
T
δ
σ
Cδ
0δ
fK
δ
*σ*
G
C4
(δ, σ) = (,), and the shape parameter of the trapezoidal law has been imposed to δ = .
Figure 2. Illustration of the bilinear, tri-linear and trapezoidal shape of the cohesive zone model for the same interfacial properties
4. Prediction of edge debonding: coupled criterion versus cohesive zone models
In order to compare the two numerical approaches, simulations of a bonded specimen submitted to four-point flexure loading have been performed. Cohesive zone models and the coupled criterion are here applied to analyze the initiation of fracture mechanisms near the free edge between the bond and the substrate. The geometry of the specimen is schematized in Figure 3. It consists of two substrates with the same thickness h = 2 mm bonded with a thin interlayer which is here neglected. When the cohesive models are used, interface elements are inserted between the two bonded substrates. The elastic properties of the substrates are selected to be ES = 400 GPa (Young's modulus) and νS = 0.2 (Poisson's ratio). Due to the
symmetry of the loaded specimen, it is assumed that the onset occurs near each free edge. A bidimensional finite element procedure with strongly refined mesh is used to derive the results which are now presented.
Figure 3. The geometry of the specimen tested under four-point bending
Several values of the interfacial strength σC and of the fracture toughness GC have been
studied for the comparison. These interfacial properties are considered similar whatever the fracture mode. The comparison between the load versus displacement curves obtained with the coupled criterion and with the cohesive zone models, for σC = 1 MPa, (Figure 4) shows
5
the coupled criterion, whatever the value of the fracture toughness. This observation is also true when σC = 10 MPa.
Figure 4. Comparison of load versus displacement curves between the coupled criterion (CC) and different cohesive zone models (CZM) with σC = 1 MPa and (a.) GC = 1 J/m², (b.) GC = 5 J/m², (c.) GC = 15 J/m², (d.) GC = 60 J/m²
This result can be explained comparing the damage kinetics of the different cohesive laws. Indeed, contrary to the bilinear and the tri-linear laws where the evolution of the damage variable λ between 0 (unbroken state) and 1 (broken state) is continuous and relatively slow, the damage variable of the trapezoidal model can evolve very quickly when the relative displacement exceeds * (i.e. at the end of the plateau). This kinetics involves that the process zone (i.e. the area where the damage variable is positive but smaller than 1) with the trapezoidal law is smaller than the ones obtained with the bilinear and the tri-linear shapes, as shown in Figure 5. This observation could explain the better correlation obtained with the coupled criterion.
6
Figure 5. Normalized length of the process zone lcz/L versus the fracture toughness GC (a.) with σC = 1 MPa and (b.) with σC = 10 MPa.
Nevertheless, it is important to note that this correlation reduces when the fracture toughness increases (Figure 6 and Figure 7). This phenomenon results from the variation of the process zone length lcz. Indeed, for the same interfacial strength σC, the larger the fracture toughness,
the longer the length. Thus, the softening behavior becomes noticeable when the normalized crack length lcz /L is higher than 10%. Consequently, as indicated in Table 1 and Table 2, the
percentages error of the fracture displacement dc and of the fracture load Fc exceed 5% as the consequence of softening (i.e. when GC > 15 J/m² for σC = 1 MPa and when GC > 1000 J/m²
for σC = 10 MPa).
Figure 6. Comparison of load versus displacement curves between the coupled criterion (CC) and the trapezoidal cohesive zone model (CZM) for several fracture toughness with σC = 1 MPa
7
Figure 7. Comparison of load versus displacement curves between the coupled criterion (CC) and the trapezoidal cohesive zone model (CZM) for several fracture toughness with σC = 10 MPa
GC (J/m²) 1 5 15 25 30 60 CC C CZM c CC C d d d 100 4.7 2.4 -0.08 -1.5 -2.7 -6.3 CC C CZM c CC C F F F 100 1.8 2.3 4.9 6.6 7.5 9.7
Table 1. Percentages error of the fracture displacement dC and the fracture load FC obtained by the trapezoidal cohesive zone model with σC = 1 MPa
GC (J/m²) 100 500 1000 3000 8000 CC C CZM c CC C d d d 100 4.7 2.4 1 -1.8 -6.4 CC C CZM c CC C F F F 100 1.8 2.2 3.8 7.2 11.6
Table 2. Percentages error of the fracture displacement dC and the fracture load FC obtained by the trapezoidal cohesive zone model with σC = 10 MPa
5. Conclusion
Simulations of a four-point bending test, for the prediction of edge debonding, with a coupled criterion and several cohesive zone models have been realized. First, the influence of the shape of the cohesive law on the prediction of the onset has been shown. The trapezoidal model appears the most adapted model to predict the initiation in a similar manner to the coupled criterion. Second, it has been demonstrated that the length of the process zone has to be small enough to verify a good correlation between the results obtained by the both
8
numerical approaches. Therefore, it seems possible to use the trapezoidal cohesive zone model, under a few material conditions, to predict precisely the edge debonding. A comparison between numerical and experimental results will be realized in future works in order to confirm the relevance of the trapezoidal cohesive zone model.
References
[1] J. C. Brewer and P. A. Lagace. Quadratic stress criterion for initiation of delamination.
Journal of composite materials, volume(22):1141-1155, 1988.
[2] M. E. Waddoups, J. R. Eisenmann and B. E. Kaminski. Macroscopic fracture mechanics of advanced composite materials. Journal of composite materials, volume(5):446-454, 1971.
[3] A. Needleman. A continuum model for void nucleation by inclusion debonding. Journal
of Applied Mechanics, volume(54):525-531, 1987.
[4] M. Jean, V. Acary and Y. Monerie. Non-smooth contact dynamics approach of cohesive materials. Philosophical Transactions of the Royal Society A, volume(359):2497-2518, 2001.
[5] D. Leguillon. Strength or toughness? A criterion for crack onset at a notch. European
Journal of Mechanics A/Solids, volume(21):61-72, 2002.
[6] V. Mantic. Interface crack onset at a circular cylindrical inclusion under a remote transverse tension. Application of a coupled stress and energy criterion. International
journal of Solids and Structures, volume(46):1287-1304, 2009.
[7] E. Martin, D. Leguillon and N. Carrère. A twofold strength and toughness criterion for the onset of free-edge shear delamination in angle-ply laminates. International journal of
Solids and Structures, volume(47):1297-1305, 2010.
[8] E. Martin, D. Leguillon and N. Carrère. A coupled strength and toughness criterion for the prediction of the open-hole tensile strength of a composite plate. International journal of
Solids and Structures, volume(49):3915-3922, 2012.
[9] A. Moradi, N. Carrère, D. Leguillon, E. Martin and J. Y. Cognard. Strength Prediction of Bonded Assemblies Using a Coupled Criterion under Elastic Assumptions: Effect of Material and Geometrical Parameters. International Journal of Adhesion and Adhesives, volume(47):73-82, 2013.
[10] L. M. Nguyen, D. Leguillon, O. Gillia and E. Riviere. Bond failure of a SiC/SiC brazed assembly. Mechanics of Materials, volume(50):1-8, 2012.
[11] D. Leguillon. An attempt to extend the 2D coupled criterion for crack nucleation in brittle materials to the 3D case. Submitted, 2014.
[12] T. Vandellos, C. Huchette and N. Carrère. Proposition of a framework for the development of a cohesive zone model adapted to Carbon-Fiber Reinforced Plastic laminated composites. Composite Structures, volume(105):199-206, 2013.