HAL Id: hal-02954128
https://hal-univ-paris.archives-ouvertes.fr/hal-02954128
Submitted on 30 Sep 2020
HAL is a multi-disciplinary open access
archive for the deposit and dissemination of
sci-entific research documents, whether they are
pub-lished or not. The documents may come from
teaching and research institutions in France or
abroad, or from public or private research centers.
L’archive ouverte pluridisciplinaire HAL, est
destinée au dépôt et à la diffusion de documents
scientifiques de niveau recherche, publiés ou non,
émanant des établissements d’enseignement et de
recherche français ou étrangers, des laboratoires
publics ou privés.
Long range self-organisations of small metallic
nanocrystals for SERS detection of electrochemical
reactions
Sihem Groni, Claire Fave, Bernd Schöllhorn, Lionel Chapus, Pierre Aubertin,
Thomas Touzalin, Ivan Lucas, Suzanne Joiret, Alexa Courty, Emmanuel
Maisonhaute
To cite this version:
Sihem Groni, Claire Fave, Bernd Schöllhorn, Lionel Chapus, Pierre Aubertin, et al.. Long range
self-organisations of small metallic nanocrystals for SERS detection of electrochemical reactions. Journal
of Electroanalytical Chemistry, Elsevier 2020, 872, pp., 114322. �10.1016/j.jelechem.2020.114322�.
�hal-02954128�
Long range self-organisations of small metallic nanocrystals for SERS
detection of electrochemical reactions
Sihem Groni
a, Claire Fave
a, Bernd Schöllhorn
a, Lionel Chapus
b,c, Pierre Aubertin
b,c, Thomas Touzalin
c,
Ivan T. Lucas
c, Suzanne Joiret
c, Alexa Courty
b,⁎
, Emmanuel Maisonhaute
c,⁎
aUniversité de Paris, Laboratoire d'Electrochimie Moléculaire, UMR CNRS 7591, 15 Rue Jean-Antoine de Baïf, F-75013 Paris, France bSorbonne Université, CNRS, MONARIS, UMR 8233, F-75005, 4 place Jussieu, F-75005 Paris, France
cSorbonne Université, CNRS, Laboratoire Interfaces et Systèmes Electrochimiques, LISE, F-75005 Paris, France
A B S T R A C T
Gold electrodes were modified by silver and gold nanocrystals (NCs) that self-organize onto the surface. Their optical properties were explored by measuring electroreflectance spectra as a function of electrode potential. Below their ox-idation potential, no shift of the reflectance maximum was observed for Ag NCs. This can be explained by a low inter-facial capacitance resulting from the impossibility for the electrolyte to penetrate into the hydrophobic layer created by the NCs dodecanethiol ligands. Conversely, a non-monotonous evolution was observed with the electrode potential for oleylamine capped Au NCs. This behavior is suggesting a less dense hydrophobic layer, allowing significant electrolyte penetration. Next, electroactive compounds were adsorbed on the the Au NCs assemblies and characterized by Raman spectroelectrochemistry. In thefirst system displaying a single electron transfer with no coupled chemical reaction, only the spectrum intensity changed, because oxidation generated a Raman resonant radical cation. The second study considered 4-nitrothiophenol, for which up to 6 electrons and 6 protons may be transferred. In this case, the nitro band disappeared upon reduction, and the spectrum displayed typical features of the formed 4-aminothiophenol.
1. Introduction
Spectroscopic techniques have long been coupled with electrochemical methods to decipher complex electron transfer reactions, often associated with preceding or successive chemical steps [1–3]. Among the various tech-niques, Raman spectroscopy is becoming increasingly important for several reasons [4,5]. First, as a vibrational spectroscopy, it provides a direct chem-ical identification, even for complex mixtures. Second, a visible excitation laser is most often used, allowing a rather easy implementation in liquids and then under electrochemical conditions contrary to infrared spectros-copy. Nevertheless, the Raman scattering process is usually rather inef fi-cient, so that in comparison with conventional UV–Vis spectroelectrochemistry the signal needs to be amplified [6]. To this re-spect, it was soon realized that the gain in sensitivity provided by Surface Enhanced Raman Spectroscopy (SERS) [5] would also benefit to
electro-chemistry. Nanoscale resolution is even nowadays accessible through Tip-Enhanced Raman Spectroscopy [7–12]. First SERS substrates were in fact roughened silver or gold electrodes [13,14], presenting randomly distrib-uted“hot spots”, i.e. specific locations on the electrode surface where the electromagneticfield is considerably increased. Nowadays, the trend is to control rationally the location and amplification properties of these hot
spots, and two major approaches are prominent in the literature. Thefirst consists in designing nanoobjects with a localized surface plasmon reso-nance close to the desired excitation laser wavelength. Spheres, dimers, rods, bipyramids or raspberry shape particles have been proposed for exam-ple [15–18], as well as bimetallic core-shell systems and SHell Isolated Protected Nanoparticles [19]. Here, it is however impossible to control the precise location of the hot spot on the studied surface, and some of these substrates lack a good reproducibility. The second approach is to rely on electron lithography to produce very well-controlled nanostructures [20]. Nevertheless, this method is time consuming, expensive and do not presently allow a subnanometric precision that may provide the best enhancement.
In this context, we recently proposed a new strategy relying onto long-range 2D or 3D self-organisations of small (5–12 nm diameter) metallic nanocrystals (NCs) that provide very reproducible SERS signal [21,22]. The great advantage of these organisations is to provide areas bearing mul-tiple hot spots in a reproducible manner. In addition, molecules of interest can be easily adsorbed onto these substrates and readily detected. We re-cently explored the optical and Raman properties of these metamaterials in the air, and this paper will describe their behavior under electrochemical polarization. In the following, we the electroreflectance properties of Ag
⁎Corresponding authors.
and Au NCs organisations will befirst described. Next, we will consider the dependence of the Raman signal with the electrode potential, opening a new way to perform Raman spectroelectrochemistry.
2. Results and discussion
2.1. Electrode preparation and experimental setup
Experimental details for the synthesis of NCs and molecule 1 are pro-vided in Supporting Information. In this paper, we usedfirst gold substrates (100 nm of Au deposited onto mica) modified with 5.2 nm Ag NCs capped with dodecanethiol as ligand. The narrow size distribution of the NCs drive their self-organization in 2D or 3D micrometric structures easily detectable with an optical microscope. To produce thinfilms, a 20 μL droplet of a 4.6 × 10⁻⁷molL−1toluene solution of NCs was deposited on top of a larger drop of diethyleneglycol. The latter acts as a“bad solvent” for the NCs that self-organize at the interface. After 30 mins, thefilm was trans-ferred onto the gold wafer. This produces thinfilms having a thickness from 1 to 5 layers of NCs. InFig. 1a that shows an optical image of the mod-ified electrode, zone 1 corresponds to a bare Au area, zone 2 to an area with a very thin (one or two monolayers) area, and zone 3 to a thicker one. In the high resolution scanning electron microscopy image ofFig. 1b, the high density and long-range organization of the NCs is apparent.
For 11.5 nm Au NCs, the thinfilms were produced by dropcasting a 1.4 × 10⁻⁶molL−1chloroform solution of NCs directly onto Pt-coated mica substrates. Here, monolayers with a coverage of 70–80% of the sub-strate were obtained, as shown inFig. 1c.
In order to monitor the electroreflectance properties of the modified electrodes, the microscope of our Raman spectrometer was used. The sam-ples were inserted in a dedicated electrochemical cell and illuminated with
white light through an opticalfiber. The reflected light was redirected to the spectrometer as described in our previous papers and inFig. 1d [21,22]. In this work, an immersion objective was used to keep a good ex-citation and collection efficiency. Polarization of the sample was imposed with an Autolab potentiostat. Potentials are referred versus a saturated mer-curous sulfate reference electrode (MSE) having a potential of +0.655 V vs SHE. A platinum wire was used as counter electrode. The reflectance is ob-tained by dividing the intensity measured on an area covered with NCs (e.g. zone 2 ofFig. 1a) with the one obtained on an area where no NCs are de-tected (e.g. zone 1). This procedure was previously validated using electron microscopy.
For all data presented in this manuscript, reproducibility of the sub-strate elaboration and signal intensity was checked at several positions of the sample. Typically within one experiment reproducibility was better than 20%.
2.2. Electroreflectance of silver and gold NCs self-organisations 2.2.1. Silver NCs organisations
The 5.2 nm diameter Ag NCs assembly were investigated at increasing potentials every 10 mV from−500 to −130 mV vs MSE, andFig. 2a pre-sents two spectra obtained under these potentials. InFig. 2b, an image is constructed with all spectra after normalization by the peak maximum in-tensity. In solution, the NCs spectrum shows a maximum at 420 nm domi-nated by the Localized Surface Plasmon Resonance (LSPR) [21]. In comparison, the maximum is red-shifted onto the gold surface as expected when NCs interact together [23]. The spectra between−500 and − 250 mV are very similar, with no significant evolution. Conversely, an important de-crease in intensity as well as a blue shift are apparent above−250 mV, as illustrated inFig. 2a. Optical and electronic microscopy observations
Fig. 1. a) Optical image obtained after modification of a gold substrate by silver NCs. Zone 1 corresponds to the bare gold surface, zone 2 to a very thin film (mostly monolayer) of NCs, and zone 3 to a thicker area. b) SEM-FEG image of a silver NCs self-organization. c) SEM-FEG image of a gold NCs self-organization. d) Instrumental setup for electroreflectance measurements. White light is provided with an optical fiber and reaches the sample (represented in yellow) through a 40× water immersion objective. The reflected light is then dispersed by the grating of the Raman spectrometer to recover the spectrum.
revealed afterwards that at high potentials the substrate is in fact irrevers-ibly altered.
Influence of the potential to the reflectance spectra was previously stud-ied theoretically and experimentally by Schiffrin and Sagara independently for gold systems [24–28]. A key parameter to determine the position of the LSPR peak is the number of free electrons N +ΔN in the nanostructure as shown in Eq.(1): [5,24–28]. ωpp¼ ffiffiffiffiffiffiffiffiffiffiffiffiffiffiffiffiffiffiffiffiffiffiffiffiffiffiffiffiffiffiffiffiffi N þ ΔN ð Þe2 meffϵ0ðεmþ 2εeÞ s ð1Þ hereωppis the plasma polariton pulsation that determines the LSPR
posi-tion, N the number of electrons in the nanostructure when no polarization is applied and meffthe effective mass of the electrons.εmandεeare
respec-tively the dielectric constants of respecrespec-tively the NC metal and environ-ment. Under polarization, it may be modified by an amount ΔN that then depends on the electrode potential. While negative potentials should in principle increaseΔN, the situation may be complicated if specific adsorp-tion of electrolyte ions occurs since creaadsorp-tion of chemical bonds would also involve the free electrons of the NCs and also affect the interfacial ca-pacitance. Returning to our experiment, the independence of the spectrum with the potential in the−500/−200 mV region indicates that ΔN is close to 0, although the NCs are sensitive to the electrode potential as demon-strated by their degradation above−250 mV.
A semi-quantitative estimation ofΔN can be provided by examining the electrochemical interface. Organized NCs are capped with dodecanethiol li-gands that interpenetrate, thus a very hydrophobic layer with a low dielec-tric constant. In a very simplified scheme the metallic cores are considered as a plane. If the diffuse layer contribution is neglected, the interface would then be comparable to two identical capacitances in series. Using a dielec-tric constant of 2.5 (the one of pure dodecanethiol) wefind a capacitance per unit area of 0.65μFcm−2for the whole interface. Hence, upon a 1 V po-larization versus the potential of zero charge, a charge of only 6.5 × 10⁻³ Ccm−2would appear in the metallic structure, which amounts toΔN being less than 1 electron per nanoparticle. This value being extremely small, it rationalizes the independence of the spectra with the potential as long as the integrity of the system is preserved.
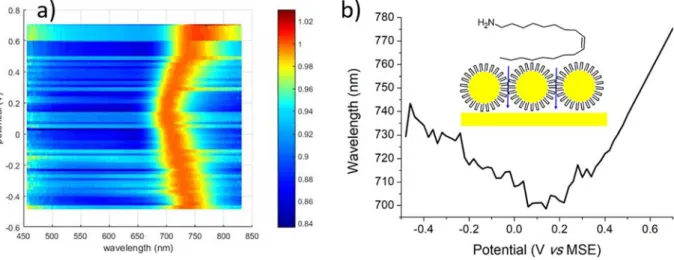
2.2.2. Gold NCs organisations
We next consider assemblies made of 11.5 nm diameter gold NCs. These systems are here capped with oleylamine ligand (see SI for details of
synthesis). The potential excursion was larger (−500 up to +700 mV vs MSE) since gold is more stable than silver under oxidizing conditions. In the map presented inFig. 3a, a non-monotonous shift of ca 40 nm is ob-served for the peak, a red-shift being obob-served below 0.10 V.Fig. 3b reports the maximum position as a function of potential to pinpoint this evolution. Previously, Schiffrin and Sagara observed a blue shift for decreasing poten-tials as expected from the theoretical considerations presented above [24–28]. In comparison to the results obtained with silver, the important and reversible changes suggest that electrolyte can better penetrate in the ligand layer that encapsulates the NCs, leading to a larger interfacial capac-itance in comparison with dodecanethiol. In fact, dodecanethiol is bearing a linear alkyl chain (see insets inFig. 2a and3b), so that interdigitated ligands of adjacent NCs interact strongly via Van der Waals interactions [23]. As a consequence, chain interpenetration is important, which creates a very compact hydrophobic layer. Conversely, it is well-established that chain in-terpenetration is weaker for oleylamine ligands [29]. As a consequence, the local dielectric constantεeis increased, and more generally the structure of
the electrochemical interface may be severely affected, inducing changes in ΔN. Besides, we stress that the red shift observed below 0.1 V cannot be ex-plained by an increase of the number of free electrons as stated in Eq.(1). The observed behavior is thus very complex and remains unexplained. We suggest the occurrence of interdependent specific potential-induced ion adsorption and/or ligand chain reorganization.
These two examples demonstrate that electroreflectance measurements are a very sensitive way of probing a complex interface. Since gold NCs are far more stable, we consider in the following sections the SERS properties of the latter system modified with electroactive molecules.
2.3. SERS detection of electrochemical reactions 2.3.1. Single electron transfer
In afirst step, we chose a system displaying a single electron transfer step not coupled with any chemical reaction. Molecule 1, displayed in
Fig. 4a, is derived from the phenylenediamine system that was extensively studied by the Oxford group [30–32] and by some of us [33,34]. It was syn-thesized as described in SI. It was then immobilized either onto a gold ball electrode or on a substrate covered with gold NCs by immersion in a 1 mM acetonitrile solution for at least 12 h. After thorough rinsing (30 min twice in neat acetonitrile), the substrates were transferred in an electrochemical cell. The electrolyte used was here a 0.10 M H2SO4aqueous solution.
Fig. 4b and c compare the CVs obtained for 1 adsorbed either on a gold ball microelectrode or onto the NCs modified electrode at 0.10 Vs−1.
Fig. 2. a) Reflectance spectra acquired at −500 (red curve) and − 130 mV (black curve) vs MSE for a gold wafer modified with 5.2 nm diameter Ag NCs. The dip at 633 is an artefact due to the notchfilter of the Raman spectrometer. Inset: dodecanethiol structure and sketch featuring Ag NCs self-organization and impossibility for the electrolyte to penetrate inside the hydrophobic layer surrounding the NCs ligands. b) Intensity map constructed with spectra acquired every 10 mV between−500 and − 130 mV vs MSE, after normalization by their maximum.
Although the oxidation and reduction peaks are split possibly because of ohmic drop due to the large electrode area in contrast to the gold ball elec-trode used as standard, a clear reversible process is apparent. Nevertheless, some decrease of the signal was observed upon cycling (seeFig. 4c) suggest-ing that some molecules were only physisorbed although copious rinssuggest-ing of the electrode was applied during the electrode modification procedure. We also suggest that this desorption is induced by the molecule oxidation. An-other possibility is that the oxidized system 1•+reacts with some free ligand resulting from the NCs synthesis (either dodecanethiol or oleylamine).
Fig. 4d presents successive SERS spectra obtained at −0.30 V and + 0.20 V vs MSE using a 632.8 nm laser as excitation source. Despite the progressive desorption and therefore global diminution of the signal, the oxidized system shows more intense spectra as evidenced inFig. 4d
for which the red and orange traces obtained at +0.20 V were acquired re-spectively after the black and purple ones at−0.30 V. Our hypothesis is that these variations are induced by a resonance Raman effect upon oxida-tion. Indeed, phenylenediamine radical cations are known to provide a strong absorption in the 500–650 nm range [35]. Performing Raman mea-surements close to an electronic excitation is in fact known to further en-hance the signal, and is often used when ultimate resolution is desired [36]. An additional contribution to this resonance effect may also stem from an electromagnetic effect since as reported above the LSPR is potential-dependent, which may modify the electricfield intensity inside the hot spots [5].
These last results demonstrated that our new substrates made of self-organized gold NCs provide a very convenient an easy way to follow an
Fig. 3. a) Intensity map constructed with spectra acquired every 10 mV between−500 and + 700 mV vs MSE, after normalization by their maximum for a platinum electrode modified with gold NCs. b) Position of the maximum of the reflectance spectra as a function of the potential. Inset: oleylamine structure and sketch featuring Au NCs self-organization and electrolyte permeation.
Fig. 4. a) Structure of molecule 1 that displays a reversible one electron transfer upon oxidation. b) CV of 1 adsorbed onto a gold ball electrode in 0.10 M H2SO4at 0.1 Vs−1.
c) CV of 1 adsorbed onto a Pt wafer electrode modified with gold NCs in 0.10 M H2SO4at 0.1 Vs−1. Black curve:first cycle. Blue curve: 7th cycle, showing that desorption
electrochemical reaction by Raman spectroscopy. In the next section, we consider the case of a more complicated electrochemical system involving several electron and proton transfers.
2.3.2. Multistep electron and proton transfers
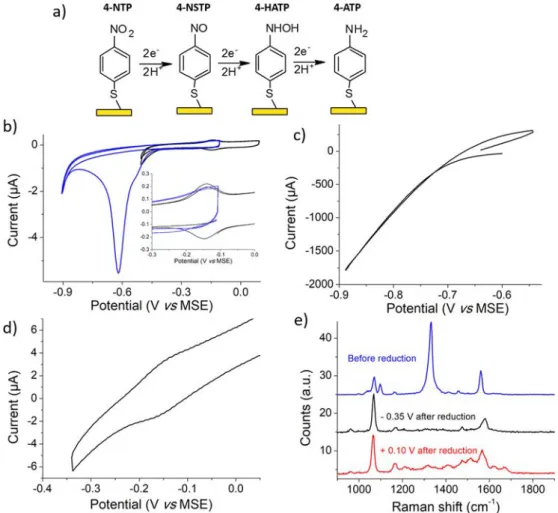
With the aim of demonstrating that our new SERS substrates are suit-able to follow electrochemical reactions involving multiple electron and protons transfers, we examine below the reduction mechanism of 4-nitrothiophenol (4-NTP). This system has often been considered both in electrochemistry and Raman spectroscopy, but also in combined ap-proaches [37–44]. Up to 6 electrons and 6 protons can be transferred to lead to 4-aminothiophenol (4-ATP) as depicted inFig. 5a, but two other in-termediates corresponding to 4-nitrosothiophenol (4-NSTP, 2 electrons two protons) or 4-hydroxyaminophenol (4-HATP, 4 electrons 4 protons) may also be observed [7].Fig. 5b presents CVs of 4-NTP adsorbed on a gold elec-trode and reduced in a 0.10 M H2SO4solution for two different inversion
potentials. In agreement with literature, a single reduction wave is ob-served (seeFig. 5b, blue curve) since NTP is irreversibly reduced to 4-ATP. Nevertheless, if the initial scan is reversed near the peak (black curve inFig. 5b), a reversible wave is observed near 0.16 V vs MSE upon the backward scan corresponding to the 2-electrons and 2-protons ex-change of the 4-NSTP/4-HATP system.
Fig. 5c depicts the CV obtained when a Pt electrode modified with gold NCs is polarized. Pt was chosen as a substrate in comparison to gold to avoid coadsorption of 4-NTP on the unmodified areas. In our case however, 4-NTP signal was unfortunately masked by the proton reduction current on
the platinum surface that was not covered with the NCs. It was then difficult to optimize conditions for which the 4-NSTP/4-HATP ratio was optimized versus the 4-ATP one. Nevertheless, the system 4-NSTP/4-HATP is slightly apparent inFig. 5d that was recorded after a single reduction cycle. During this experiment, Raman acquisitions were performed in situ before and after reduction. Afirst observation evidenced inFig. 5e is that the intense band at 1335 cm−1characteristic of the NO2symmetric stretching of 4-NTP
van-ishes, demonstrating the complete reaction of the initial system. Next, spec-tra at−0.35 and + 0.10 V vs MSE were acquired. At −0.40 V, the signal is characteristic of the adsorbed 4-ATP system already reported by several au-thors [7,37]. Identification of 4-HATP is thus impossible probably because
this system is diluted within a 4-ATP matrix for which the Raman cross sec-tion is larger. At +0.10 V however, the spectrum deviates slightly from the previous one and new features appear. These are reproducibly observed and stable upon several oxidation and reduction cycles. Nitrosobenzene was studied previously by Gao and Weaver [37]. No bands were observed above 1600 cm−1. It therefore seems unlikely to attribute the all the new features to 4-NSTP. In order to remove the contribution of 4-ATP and re-cover only the contribution of the other reaction products, a differential spectrum is displayed in Fig. S2. At this stage it is difficult to identify clearly the additional product detected at +0.10 V. In the literature, at oxidizing potentials 4-ATP may be oxidized to radicals that subsequently couple [45]. Also, during chemical oxidation of aniline to polyaniline, production of benzoquinone moieties have been evidenced, with a signal appearing at 1650 cm−1[46]. One possibility is thus that coupling of reacting interme-diates or/and 4-ATP within the NCs matrix produces oligomers that are
Fig. 5. a) Reduction mechanism of 4-nitrothiophenol (4-NTP). b) CV of 4-NTP adsorbed onto a gold ball electrode at 0.10 Vs−1at two different inversion potential. Inset: zoom in the−0.30/0.00 V region showing the presence of the 4-NSTP/4-HATP system if the potential excursion is not too negative (black curve). c) CV of 4-NTP at 0.10 Vs−1onto a Pt wafer modified with gold NCs at 0.10 Vs−1. d) Second CV using a smaller potential excursion to identify the 4-NSTP/4-HATP system. e) Raman
spectra obtained before reduction (blue, representative of 4-NTP), at a potential of−0.35 V after reduction at −0.84 V (black, representative of 4-ATP) and at a potential of +0.10 V after reduction at−0.84 V (red, showing presence of 4-ATP and an unknown product).
oxidized and Raman resonant at +0.10 V. This hypothesis needs further ex-periments to be confirmed [47]. The influence of the excitation laser
through production of hot electrons should also be considered [38]. 3. Conclusions
Herein, we took benefit from the supramolecular organisations of small NCs to conceive a new spectroelectrochemical platform. Electroreflectance spectra revealed that the plasmonic properties of dodecanethiol capped silver nanocrystals do not significantly change be-fore they are irreversibly degraded by oxidation whereas gold ones that are capped with oleylamine present a non-monotonous shift of the spec-trum with the potential, revealing interactions of the metallic core with the electrolyte. The self-organisations are easily detected, and the large number of hot spots present under the laser beam allow reproducible Raman signals to be acquired for adsorbed molecules. We therefore pro-posed a new convenient Raman spectroelectrochemical platform that may be useful to study more complex objects [48] and possibly include transient measurements [49].
Declaration of Competing Interest None.
Acknowledgements
This work was funded by Sorbonne Université, CNRS and the Labex “MiChem” (ANR-11-IDEX-0004-02).
Appendix A. Supplementary data
Supplementary data to this article can be found online athttps://doi. org/10.1016/j.jelechem.2020.114322.
References
[1] T. Kuwana, R.K. Darlington, D.W. Leedy, Electrochemical studies using conducting glass indicator electrodes, Anal. Chem. 36 (1964) 2023–2025.
[2] O. Alévêque, C. Gautier, E. Levillain, Real-time absorption spectroelectrochemistry: from solution to monolayer, Curr. Opin. Electrochem. 15 (2019) 34–41.
[3] M. Aller Pellitero, F.J. del Campo, Electrochromic sensors: innovative devices enabled by spectroelectrochemical methods, Curr. Opin. Electrochem. 15 (2019) 66–72. [4]D.L. Jeanmaire, M.R. Suchanski, R.P. Van Duyne, Resonance Raman
Spectroelectrochemistry. 1. Tetracyanoethylene anion radical, J. Am. Chem. Soc. 97 (1975) 1699–1707.
[5] E.C. Le Ru, P.G. Etchegoin, Principles of Surface-Enhanced Raman Spectroscopy and Re-lated Plasmonic Effects, Elsevier Science Bv, Amsterdam, 2009.
[6] D.Y. Wu, J.F. Li, B. Ren, Z.Q. Tian, Electrochemical surface-enhanced Raman spectros-copy of nanostructures, Chem. Soc. Rev. 37 (2008) 1025–1041.
[7] T. Touzalin, S. Joiret, E. Maisonhaute, I.T. Lucas, Complex electron transfer pathway at a microelectrode captured by in situ nanospectroscopy, Anal. Chem. 89 (2017) 8974–8980.
[8] T. Touzalin, S. Joiret, E. Maisonhaute, I.T. Lucas, Capturing electrochemical transforma-tions by tip-enhanced Raman spectroscopy, Curr. Opin. Electrochem. 6 (2017) 46–52. [9] T. Touzalin, A.L. Dauphin, S. Joiret, I.T. Lucas, E. Maisonhaute, Tip enhanced Raman spectroscopy imaging of opaque samples in organic liquid, Phys. Chem. Chem. Phys. 18 (2016) 15510–15513.
[10] J.H.K. Pfisterer, M. Baghernejad, G. Giuzio, K.F. Domke, Reactivity mapping of nano-scale defect chemistry under electrochemical reaction conditions, Nat. Commun. 10 (2019) 5702.
[11] Z.-C. Zeng, S.-C. Huang, D.-Y. Wu, L.-Y. Meng, M.-H. Li, T.-X. Huang, J.-H. Zhong, X. Wang, Z.-L. Yang, B. Ren, Electrochemical Tip-enhanced Raman spectroscopy, J. Am. Chem. Soc. 137 (2015) 11928–11931.
[12] T. Touzalin, S. Joiret, I.T. Lucas, E. Maisonhaute, Electrochemical tip-enhanced Raman spectroscopy imaging with 8 nm lateral resolution, Electrochem. Commun. 108 (2019) 106557.
[13] M. Fleischmann, P.J. Hendra, A.J. McQuillan, Raman-spectra of pyridine adsorbed at a silver electrode, Chem. Phys. Lett. 26 (1974) 163–166.
[14] D.L. Jeanmaire, R.P. Vanduyne, Surface Raman spectroelectrochemistry. 1. Heterocy-clic, aromatic and aliphatic amines adsorbed on anodized silver electrode, J. Electroanal. Chem. 84 (1977) 1–20.
[15] N. Pazos-Perez, C.S. Wagner, J.M. Romo-Herrera, L.M. Liz-Marzan, F.J.G. de Abajo, A. Wittemann, A. Fery, R.A. Alvarez-Puebla, Organized plasmonic clusters with high coor-dination number and extraordinary enhancement in Surface-Enhanced Raman Scatter-ing (SERS), Angew. Chem. Int. Ed. 51 (2012) 12688–12693.
[16] R.A. Alvarez-Puebla, A. Agarwal, P. Manna, B.P. Khanal, P. Aldeanueva-Potel, E. Carbo-Argibay, N. Pazos-Perez, L. Vigderman, E.R. Zubarev, N.A. Kotov, L.M. Liz-Marzan, Gold nanorods 3D-supercrystals as surface enhanced Raman scattering spectroscopy sub-strates for the rapid detection of scrambled prions, Proc. Natl. Acad. Sci. U. S. A. 108 (2011) 8157–8161.
[17] R. Arenal, L. Henrard, L. Roiban, O. Ersen, J. Burgin, M. Treguer-Delapierre, Local plas-monic studies on individual core-shell gold-silver and pure gold nano-bipyramids, J. Phys. Chem. C 118 (2014) 25643–25650.
[18] A. Le Beulze, S. Gomez-Grana, H. Gehan, S. Mornet, S. Ravaine, M. Correa-Duarte, L. Guerrini, R.A. Alvarez-Puebla, E. Duguet, E. Pertreux, A. Crut, P. Maioli, F. Vallee, N. Del Fatti, O. Ersen, M. Treguer-Delapierre, Robust raspberry-like metallo-dielectric nanoclusters of critical sizes as SERS substrates, Nanoscale 9 (2017) 5725–5736.
[19] J.F. Li, Y.J. Zhang, S.Y. Ding, R. Panneerselvam, Z.Q. Tian, Core-shell nanoparticle-enhanced Raman spectroscopy, Chem. Rev. 117 (2017) 5002–5069.
[20] I. Tijunelyte, I. Kherbouche, S. Gam-Derouich, M. Nguyen, N. Lidgi-Guigui, M.L. de la Chapelle, A. Lamouri, G. Lévi, J. Aubard, A. Chevillot-Biraud, C. Mangeney, N. Felidj, Multi-functionalization of lithographically designed gold nanodisks by plasmon-mediated reduction of aryl diazonium salts, Nanoscale Horizons 3 (2018) 53–57.
[21] P. Aubertin, M. Ben Aissa, N. Raouafi, S. Joiret, A. Courty, E. Maisonhaute, Optical re-sponse and SERS properties of individual large scale supracrystals made of small silver nanocrystals, Nano Res. 8 (2015) 1615–1626.
[22]L. Chapus, P. Aubertin, S. Joiret, I.T. Lucas, E. Maisonhaute, A. Courty, Tunable SERS platforms from small nanoparticle 3D Superlattices: a comparison between gold, silver, and copper, ChemPhysChem 18 (2017) 3066–3075.
[23] A. Courty, Silver Nanocrystals: self-organization and collective properties, J. Phys. Chem. C 114 (2010) 3719–3731.
[24] T. Baum, D. Bethell, M. Brust, D.J. Schiffrin, Electrochemical charge injection into immobilized nanosized gold particle ensembles: potential modulated transmission and reflectance spectroscopy, Langmuir 15 (1999) 866–871.
[25] D. Bethell, M. Brust, D.J. Schiffrin, C. Kiely, From monolayers to nanostructured mate-rials: an organic chemist’s view of self-assembly, J. Electroanal. Chem. 409 (1996) 137–143.
[26] T. Sagara, N. Kato, N. Kakashima, Electroreflectance study of gold nanoparticles immobilized on an aminoalkanethiol monolayer coated on a polycrystalline gold elec-trode surface, J. Phys. Chem. B 106 (2002) 1205–1212.
[27] A. Toyota, T. Sagara, Time dependent spectral change upon potential step perturbation for Au nanoparticles immobilized on an organic monolayer-modified ITO electrode, Colloids Surfaces A: Physicochem. Eng. Aspects 286 (2006) 62–69.
[28] A. Toyota, T. Sagara, Particle size dependence of the charging of Au nanoparticles immobilized on a modified ITO electrode, Electrochim. Acta 53 (2008) 2553–2559.
[29] J. Borges, J.A. Ribeiro, E.M. Pereira, C.A. Carreira, C.M. Pereira, F. Silva, Preparation and characterization of DNAfilms using oleylamine modified Au surfaces, J. Colloid In-terface Sci. 358 (2011) 626–634.
[30] N.S. Lawrence, L. Jiang, T.G.J. Jones, R.G. Compton, Voltammetric characterization of a N,N '-diphenyl-p-phenylenediamine-loaded screen-printed electrode: a disposable sen-sor for hydrogen sulfide, Anal. Chem. 75 (2003) 2054–2059.
[31] J.S. Long, D.S. Silvester, A.S. Barnes, N.V. Rees, L. Aldous, C. Hardacre, R.G. Compton, Oxidation of several p-phenylenediamines in room temperature ionic liquids: estima-tion of transport and electrode kinetic parameters, J. Phys. Chem. C 112 (2008) 6993–7000.
[32] J.D. Wadhawan, R.G. Compton, F. Marken, S.D. Bull, S.G. Davies, Photoelectrochemically driven processes at the N,N,N ',N '-tetrahexylphenylenediamine microdroplet/electrode/aqueous electrolyte triple interface, J. Solid State Electrochem. 5 (2001) 301–305.
[33] C. Amatore, D. Genovese, E. Maisonhaute, N. Raouafi, B. Schollhorn, Electrochemically driven release of picomole amounts of calcium ions with temporal and spatial resolu-tion, Angew. Chem. Int. Ed. 47 (2008) 5211–5214.
[34] R. Sahli, N. Raouafi, K. Boujlel, E. Maisonhaute, B. Schollhorn, C. Amatore, Electro-chemically active phenylenediamine probes for transition metal cation detection, New J. Chem. 35 (2011) 709–715.
[35] H. de Santana, S. Quillard, E. Fayad, G. Louarn, In situ UV-vis and Raman spectroscopic studies of the electrochemical behavior of N,N’-diphenyl-1,4-phenylenediamine, Synth. Met. 156 (2006) 81–85.
[36] S. Zaleski, M.F. Cardinal, J.M. Klingsporn, R.P. Van Duyne, Observing single, heteroge-neous, one-Electron transfer reactions, J. Phys. Chem. C 119 (2015) 28226–28234. [37] P. Gao, D. Gosztola, M.J. Weaver, Surface-enhanced Raman spectroscopy as a probe of
electroorganic reaction pathways. Processes involving adsorbed nitrobenzene and re-lated species, J. Phys. Chem. 92 (1988) 7122–7130.
[38] N. Kumar, B. Stephanidis, R. Zenobi, A.J. Wain, D. Roy, Nanoscale mapping of catalytic activity using tip-enhanced Raman spectroscopy, Nanoscale 7 (2015) 7133–7137. [39] C. Medard, M. Morin, Chemisorption of aromatic thiols onto a glassy carbon surface, J.
Electroanal. Chem. 632 (2009) 120–126.
[40] S. Schwamborn, L. Stoica, S. Neugebauer, T. Reda, H.-L. Schmidt, W. Schuhmann, Local modulation of the redox state of p-nitrothiophenol self-assembled monolayers using the direct mode of scanning electrochemical microscopy, ChemPhysChem 10 (2009) 1066–1070.
[41] H. Shindo, Raman-spectroscopic observation of adsorbates on Ag during electrochemi-cal reduction of nitrobenzene, J. Chem. Soc. Faraday Trans. 82 (1986) 45–51. [42] H. Tsutsumi, S. Furumoto, M. Morita, Y. Matsuda, Electrochemical behavior of a
4-nitrothiophenol modified electrode prepared by the self-assembly method, J. Colloid In-terface Sci. 171 (1995) 505–511.
[43] L.-B. Zhao, J.-L. Chen, M. Zhang, D.-Y. Wu, Z.-Q. Tian, Theoretical study on electroreduction of p-nitrothiophenol on silver and gold electrode surfaces, J. Phys. Chem. C 119 (2015) 4949–4958.
[44] J. Wiechers, T. Twomey, D.M. Kolb, R.J. Behm, An insitu scanning tunneling micros-copy study of Au(111) with atomic scale resolution, J. Electroanal. Chem. 248 (1988) 451–460.
[45] J. Lukkari, K. Kleemola, M. Meretoja, T. Ollonqvist, J. Kankare, Electrochemical post-self-assembly transformation of 4-aminothiophenol monolayers on gold electrodes, Langmuir 14 (1998) 1705–1715.
[46] M. Blaha, F. Marek, Z. Moravkova, J. Svoboda, J. Brus, J. Dybal, J. Prokes, M. Varga, J. Stejskal, Role of p-benzoquinone in the synthesis of a conducting polymer, polyaniline, Acs Omega 4 (2019) 7128–7139.
[47] X. Wang, M.C. Bernard, C. Deslouis, S. Joiret, P. Rousseau, Kinetic reactions in thin polyanilinefilms revisited through Raman-impedance dynamic coupling, Electrochim. Acta 56 (2011) 3485–3493.
[48] M. Steffenhagen, A. Latus, T.M.N. Trinh, I. Nierengarten, I.T. Lucas, S. Joiret, J. Landoulsi, B. Delavaux-Nicot, J.F. Nierengarten, E. Maisonhaute, A rotaxane scaffold bearing multiple redox centers: synthesis, surface modification and electrochemical properties, Chem. Eur. J. 24 (2018) 1701–1708.
[49] X.S. Zhou, B.W. Mao, C. Amatore, R.G. Compton, J.L. Marignier, M. Mostafavi, J.F. Nierengarten, E. Maisonhaute, Transient electrochemistry: beyond simply temporal res-olution, Chem. Commun. 52 (2016) 251–263.