HAL Id: hal-02972147
https://hal.archives-ouvertes.fr/hal-02972147
Preprint submitted on 20 Oct 2020HAL is a multi-disciplinary open access archive for the deposit and dissemination of sci-entific research documents, whether they are pub-lished or not. The documents may come from teaching and research institutions in France or abroad, or from public or private research centers.
L’archive ouverte pluridisciplinaire HAL, est destinée au dépôt et à la diffusion de documents scientifiques de niveau recherche, publiés ou non, émanant des établissements d’enseignement et de recherche français ou étrangers, des laboratoires publics ou privés.
Distributed under a Creative Commons Attribution - NonCommercial - NoDerivatives| 4.0 International License
A Primer on African Market Integration with a Hard
look at Progress and Challenges Ahead
Jaime de Melo, Jean-Marc Solleder, Zakaria Sorgho
To cite this version:
Jaime de Melo, Jean-Marc Solleder, Zakaria Sorgho. A Primer on African Market Integration with a Hard look at Progress and Challenges Ahead. 2020. �hal-02972147�
fondation pour les études et recherches sur le développement international
LA FERDI EST UNE FOND
ATION REC ONNUE D ’UTILITÉ PUBLIQUE . ELLE ME T EN ŒUVRE A VEC L ’IDDRI L ’INITIA TIVE POUR LE DÉ VEL OPPEMENT E
T LA GOUVERNANCE MONDIALE (IDGM).
ELLE C
OORDONNE LE LABEX IDGM+ QUI L
’ASSOCIE A U CERDI E T À L ’IDDRI. CE TTE PUBLIC
ATION A BÉNÉFICIÉ DU SOUTIEN DU MINIST
ÈRE DE L ’EUR OPE E T DES AFF AIRES É TR ANGÈRES . Abstract
Treaties implemented by Regional Organizations (ROs) among which the eight Regional Economic Communities (RECs) have piloted integration across the African continent. The recently created Africa Continental Free Trade Area (AfCFTA), effective since May 2019, is the latest effort along the roadmap started with the Abuja Treaty of 1994 and continued with the launch of ‘Agenda 2063’ on the 50th anniversary of the OAU. This primer has three objectives: take stock of progress at market integration and understand the causes of the African ‘proximity gap’; summarize and provide new evidence on the extent of integration, and; discuss challenges ahead.
… /…
* This paper is an extension of Melo, Solleder and Sorgho (2020) financed by the Africa Development Bank (AfDB) completed in December 2019. Sections 2, 7 and 8 are reproduced from that paper. Melo and Solleder thank (FERDI) for support. We also thank the AfDB research team for encouragement during preparation of a background paper for AEO 2019. Earlier drafts benefitted from comments by Célestin Monga, Dani Rodrik and Alan Winters. Any views reflect only those of the authors’ and not those of the Africa Development Bank (AfDB) or FERDI.
Jaime de Melo, University of Geneva and FERDI
Jean-Marc Solleder, University of Geneva
Zakaria Sorgho, Laval University and FERDI
A Primer on African Market
Integration with a Hard look
at Progress and Challenges
Ahead*
Jaime de Melo
│Jean-Marc Solleder
│Zakaria Sorgho
Poli tiques de développem en t Docu ment de travail July 2020
268
1
…/…
The ambitious objectives of the AfCFTA among highly diverse economies is suggestive of a trilemma: (i) solidarity (calls for special and differential treatment); (ii) build large markets (calls for the removal of all policy-imposed barriers to trade to reap economies of scale); (iii) ‘deep’ integration (calls for covering behind-the-border measures). The example of the negotiations for the Tripartite FTA illustrates the difficulties of accommodating differences in preferences in a group of 28 countries. This ambitious agenda in a setting of limited implementation capabilities raises the specter of capability traps.
Lowering regional trade costs is key for a successful AfCFTA. Model-based calculations show that these costs have fallen over the last two decades, but not faster than elsewhere so that Africa has not improved its relative position. Estimates of the intensity of bilateral trade in parts and components are positively related to measures of ‘deep integration’, an indication of the importance of tackling ‘behind-the-border’ measures affecting trade, an objective of phase II of the AfCFTA. Estimates of the correlates of bilateral trade costs give support to measures promoting ‘deep’ integration. An outcome indicator of the thickness of borders based on changes in light-intensity along all major cross-border African roads shows that over the period 2000-13, the thickness of African borders has fallen.
All RECs are lagging MERCOSUR and ASEAN in supply chain trade. Over the 1990-2015 period, participation has been limited to the downstream side (i.e. value-added exports enter mostly as inputs into exports of importing countries) with partners outside the region which is in contrast with MERCOSUR and ASEAN where all value chains have developed with regional partners. In the case of ASEAN, the share of trade involving partners outside the region has stayed constant over the 25 period while the share of Regional Value Chain (RVC) trade only involving RTA partners has more than doubled from 7 percent to 17 percent. By 2015, ASEAN’s RVC share was about 6 times higher than the RVC rate for SADC, the REC with the most RVC integration. This suggests that intra-regional trade costs have fallen in MERCOSUR and ASEAN but not across the RECs. In short, African countries still have to produce a complete product in order to enter a new product line.
The review singles out two areas for reducing intra-regional trade costs: adopting simple rules of origin, i.e. rules that are business friendly rather than business owned (details in annex A3) and ‘taking seriously’ the Trade Facilitation Agreement (TFA). New estimates suggest that if the average time in customs for imports at the African Union level were to be reduced to the average time for exports, that is reduced by 49 hours, this would be equivalent to a reduction of 2.7% on tariffs in importing countries.
The greatest challenge ahead is increasing the provision of Regional Public Goods (RPGs). These are under-provided across the continent. Because this primer is
2 mostly about economic integration, we only cover evidence of RPGs in two areas: peace and security and cross-border infrastructure. For both, the evidence suggests that provision of these RPGs has been low. Greater provision would be conducive, if not essential, to the success of African regional integration.
3 Executive Summary
Ever since independence, African countries have engaged in a series of treaties in their journey to integrate at the regional and continental levels. Regional Organizations (ROs) among which the eight Regional Economic Communities (RECs) are to pilot this integration. From the start, most efforts at integration (and most assessments) have concentrated on removing policy-imposed barriers (tariffs and Non-Tariff Barriers) to trade in goods, then more recently barriers to the movement of capital and persons. Steps have followed the European linear model of integration (goods markets, factor markets, behind-the-border measures). The recently signed Africa Continental Free Trade Area (AfCFTA), effective since May 2019, is the latest effort in this direction.
The geography of Africa inherited from the ‘scramble of Africa’ in the late 19th Century is the strongest rationale for regional integration among the many, largely ‘artificial’ states. Transboundary externalities are numerous in this landscape. These have been tackled in the specialized ROs established to supply Regional Public Goods (RPGs) (electricity, hard
infrastructure, management of rivers and lakes, peace and security, health, environment). This primer has three objectives: to take stock of progress at market integration by
exploring the causes of the African ‘proximity gap’; to provide new evidence wherever possible, and; to discuss challenges ahead.
The ambitious objectives of the AfCFTA among highly diverse economies face a trilemma: (i) solidarity (calls for special and differential treatment); (ii) build large markets to reap
economies of scale (calls for the removal of all policy-imposed barriers to trade); (iii) deep integration (calls for covering behind-the-border measures in small groupings where trust and agreement is easier to obtain). Only two of the three objectives can be achieved. The example of the negotiations for the Tripartite FTA is developed to illustrate difficulties implied by this trilemma in negotiations involving 28 countries. The specter of capability traps implied by this ambitious continental agenda in a setting of limited implementation capabilities is raised.
So far, policy measures actually taken (as opposed to commitments announced) to integrate markets has been uneven. Some RECs still maintain applied bilateral tariffs among members close to MFN tariffs. The resulting disparity in starting point across RECs increases the challenge for implementing the AfCFTA agenda. This is recognized in the adopted variable geometry approach. Measures of progress at financial integration and labor market integration are discussed. In goods markets, once internal free trade is reached, the next step at integration beyond an FTA involves adopting a Common External Tariff (CET). Here, the experiences of EAC and ECOWAS show that the outcome has been detrimental to the small members, especially for the distribution of household income, as the adopted CET has increased household income inequality in Rwanda and Liberia, two small and low-income members in their respective Customs Union.
Lowering regional trade costs is key for the success of the AfCFTA. Model-based calculations of bilateral trade costs show that these costs have fallen over the last two decades, but not faster than elsewhere. On average relative to other comparable groups, African RECs have not improved their relative position by lowering trade costs more rapidly than those of
4 comparators in world trade. Correlations suggest that, having controlled for distance and other bilateral characteristics like common border and common language, high bilateral trade costs are associated with large gaps in indicators of logistics performance and of institutional quality. Nonetheless, once bilateral and time-varying factors affecting bilateral trade are controlled for, 50-year panel estimates of the intensity of bilateral trade in
manufactures show that WTO membership and belonging to a REC are associated with greater intensity of bilateral trade. Furthermore, estimates of the intensity of bilateral trade in parts and components are positively related to measures of ‘deep integration’ an
indication of the importance of tackling ‘behind-the-border’ measures that affect trade. Taken together, these estimates give overall support to the measures adopted. This is confirmed by an outcome indicator of the thickness of borders based on changes in light-intensity along all major cross-border African roads. The indicator shows that over the period 2000-13, differences in light-intensity as one moves along cross-border highways have fallen, an indication that the thickness of African borders has fallen.
Supply chain participation estimates are reported at the REC level from the Eora Multi Region Input Output national and global input-output tables covering the period 1990-2015 for 189 countries. The estimates show that the RECs have not yet entered supply chain trade. Compared with MERCOSUR and ASEAN, participation rates in supply chain trade has been low for African RECs over the period 1990-2015. Their participation has been mostly on the downstream side (i.e. value-added exports enter mostly as inputs into exports of importing countries). Moreover, while an objective of AfCFTA is to develop Regional Value Chains (RVCs) as well as Global Value Chains (GVCs), so far the RECs have only integrated with countries outside the region which is consistent with persistently high within-REC trade costs. This is in contrast with MERCOSUR and ASEAN where all integration has been towards members. In the case of ASEAN, the share of GVC trade involving partners outside the region has stayed constant over the 25 period while the share of RVC trade only involving RTA partners has more than doubled from 7 percent to 17 percent. By the end of period, ASEAN’s RVC is about 6 times higher than the RVC rate for SADC, the REC with the most RVC integration.
These comparisons suggest that intra-regional trade costs have fallen in MERCOSUR and ASEAN but not within the RECs so that RVCs have not developed across Africa. In short, African countries still have to produce a complete product in order to enter a new product line.
Two areas for reducing intra-regional trade costs are singled out for attention: adopting simple rules of origin (details in annex A3) and ‘taking seriously’ the Trade Facilitation Agreement (TFA). New estimates of the potential reduction in times at the border suggest much room for improvement. For example, if the average time in customs for imports at the African Union level was to be reduced to the average time for exports, that is reduced by 49 hours from the current average, this would be equivalent to a reduction of 2.7% on tariffs in importing countries.
The greatest challenge ahead is assuring the provision of Regional Public Goods (RPGs). These are under-supplied across the continent. Because this primer is mostly about
5 economic integration, we only cover evidence of RPG supply in two areas: peace and
security, and cross-border infrastructures. For both, the evidence suggests that these RPGs are under-provided. Adequate provision will be conducive, if not essential, to the success of integration.
6
Table of Contents
Acronyms ... 9
1. Introduction ... 12
1.1. The African Regional Organizations ... 12
1.2 The three phases of African Integration: from the Lagos plan of Action to the AfCFTA ... 15
1.3. Outline... 17
2. Implementation challenges ... 20
2.1 The 2016 Agenda: an African integration trilemma ... 20
2.2 Market size and the provision of Public Goods ... 22
2.3 Reconciling wide-ranging objectives: the case of the Tripartite FTA ... 24
2.4 Capability traps and Political economy considerations ... 26
3. Policy Measures to foster market Integration: Progress so far ... 28
3.1 Shallow integration: Reduction in tariffs and non-tariff barriers to trade ... 28
3.2 Deep integration: Factor markets and other provisions ... 34
4. Market integration: Outcomes Patterns across RECs ... 39
4.1. Intra-African Trade ... 39
4.2. Financial and Labor Market integration ... 40
4.3. Distributional implications of deeper integration: Common External Tariffs and the Poor ... 41
5. Trade Costs: Calibrated estimates and correlates ... 45
5.1 Correlates of Bilateral Trade Costs ... 45
5.2 Deep integration and bilateral trade in intermediate products ... 51
6. Wrapping up: African Borders are less thick ... 54
7. Supply Chain Trade and Regional Value Chains ... 57
7.1 Patterns of supply Chain Trade in sub-saharan Africa ... 57
7.2. Taking Advantage of the Trade Facilitation Agreement. ... 61
8. Beyond Market Access: Cooperation on Regional public goods ... 69
8.1 Hard and soft infrastructure ... 72
8.2 Peace and security ... 75
9 Conclusions ... 77
References ... 79
ANNEX ... 87
The AfCFTA in the broader landscape of African integration ... 87
7
A.2 A workable dispute settlement mechanism will be necessary ... 91
A3: Towards harmonized rules of origin ... 92
A.4: Examples of delegation of authority: Peer Review Mechanism and Standby Force ... 94
8 Tables
Table 1 Regional Organizations in Africa* ... 14
Table 2: NTM frequency Indices by HS section (in %) ... 32
Table 3 Ad Valorem Equivalents (AVEs) of Services Trade Restrictions Index (SRTI) by Sector and Country Group ... 38
Table 4: Bilateral Trade Costs and Logistics indicators ... 48
Table 5: Quality of Institutions are negatively correlated with bilateral Trade Costs ... 50
Table 6: Detecting Institutional correlates of bilateral Trade in Manufactures ... 52
Table 7: Detecting Institutional correlates of bilateral Trade in parts and components ... 53
Table 8: Estimates of time in customs for imports and exports ... 66
Table 9: Time-reducing estimates of TFA implementation using Zero-inflated Negative Binomial Model (ZINB) ... 67
Table 10: Supporting and Detracting Factors for Regional Subsidiarity ... 71
Figures Figure 1: African Trade and Economic Organizations ... 12
Figure 2 The Abuja Roadmap: 1994-2028 ... 16
Figure 3 The African Integration Trilemma ... 21
Figure 4: Market size across African RECs (GNI 2018 at PPP) ... 23
Figure 5 Comparison of applied bilateral and applied MFN tariffs across selected RECs ... 30
Figure 6: Prevalence, Coverage and Frequency indices across RECs: NTMs and NTBs ... 34
Figure 7: Coverage of Provisions across South-South RTAs ... 36
Figure 8 : The CET rates on a sample of imports on the Nigerian import ban list ... 43
Figure 9 : CET Effect on household welfare by income level: Côte d’Ivoire, Ghana, Guinea ... 43
Figure 10: Calibrated Trade Costs across Africa by income group: 1995-2015 ... 46
Figure 11 Activity agglomerates away from borders, but less so in 2013 than 2000 ... 55
Figure 12 The iron curtain effect is weaker across borders along smooth corridors ... 56
Figure 13: GVC Participation 1990-2015: RECs and Comparators ... 59
Figure 14: Growth in Value-chain integration outside the region dominates supply chain trade across African RECs ... 60
Figure 15. Boxplot of scores on OECD TFI components for RECs ... 64
Boxes Box 1: The TFA: Obligations and Flexibilities ... 62
9
Acronyms
AEC: Africa Economic Community AEO: African Economic Outlook
AfCFTA: Africa Continental Free Trade Area
AGADIR: Agreement between Tunisia, Morocco, Jordan, and Egypt (in force since 2007) AGOA: African Growth Opportunities Act
AIDA: Accelerated Industrial Development of Africa
ANDEAN: Regional community comprising Bolivia, Colombia, Ecuador, and Peru. APIDA: Action Plan for Accelerated Industrial Development of Africa
APRM: African Peer Review Mechanism ASEAN: Association of Southeast Asian Nations ASF: African Standby Force
AU: African Union
AVEs: Ad valorem equivalents BIAT: Boosting Intra-African Trade
CEMAC: Communauté économique et monétaire de l'Afrique centrale CEN-SAD: Communauté des États sahélo-sahariens
CET: Common External Tariff CMS: Common Market Scorecard
COMECON: Council for Mutual Economic Assistance COMESA: Common Market for East and South Africa CU: Customs Union
DB: Doing Business
EAC: East African Community
EASF: East Africa the East African Standby Force EBA: Everything But Arms
ECCAS: Economic Community of Central African States ECOWAS: Economic Communities of West African States ELF: Ethno-Linguistic Fractionalization
ETLS: ECOWAS Trade Liberalization Scheme EU: European Union
FTA: Free Trade Area
GATS: General Agreement on Trade in Services
10 GDP: Gross Domestic Product
GERD: Grand Ethiopian Renaissance Dam GVCs: Global Value Chains
HICs: High-income countries
HS: Harmonized System Description and Coding System of tariff nomenclature
IAT: Import Adjustment Tax
ICT: Information and communication technologies
ICTSD: International Centre for Trade and Sustainable Development IGAD: Intergovernmental Authority on Development
ITC: International Trade Centre LDCs: Least developed countries LICs: Low-income countries
LLDCs: Landlocked Developing Countries
LPI: Logistic Performance Index of the World Bank LSCI: Liner shipping connectivity index of UNCTAD MAST: Multi-Agency Support Team
MERCOSUR: Mercado Común del Sur (Southern Common Market) MFN: Most Favoured Nation
NAFTA: North American Free Trade Agreement NARC: North African Regional Capability NTBs: Non-Tariff Barriers
NTMs: Non-Tariff Measures OAU: Organization of Africa Unity
OECD: Organisation for Economic Co-operation and Development PAFTA: Pacific Alliance Free Trade Area
PIDA: Programme for Infrastructure Development in Africa PSI: Pre-Shipment Inspections
PTA: Preferential Trade Agreement RECs: Regional Economic Communities RoO: Rule of origin
RO: Regional Organization ROW: Rest of the World RPG: Regional Public Good RTA: Regional Trade Agreement RVC: Regional Value Chain
11 SACU: Southern African Customs Union
SADC: Southern African Development Community SDGs: Sustainable Development Goals
SDT: Special and Differential Treatment
SOA: Stays of Application (ruling halting application of a decision) SPM: Special Protection Measures
SPS: Sanitary and Phytosanitary SRTI: Services Trade Restrictions Index SSA: Sub-Saharan African
TBTs: Technical Barriers to Trade TC: Trade Costs
TFA: Trade Facilitation Agreement TFI: Trade Facilitation Index of the OECD TFTA: Tripartite Free Trade Area
TRIM: Agreement on Trade-Related Investment Measures
TRIPs: Agreement on Trade-Related Aspects of Intellectual Property Rights UEMOA : Union Économique et Monétaire de l’Afrique de l’Ouest (also WAEMU) UMA: Arab Maghreb Union
UMIC: Upper-middle Income country
UNAMID: African Union-United Nations Hybrid Operation in Darfur UNCTAD: United Nations Conference on Trade and Development UNECA: United Nations Economic Commission for Africa
WAMZ: West African Monetary Zone WB: World Bank
WGI: World governance indicators WTO: World Trade Organization
12
1. Introduction
1.1. The African Regional Organizations
Since independence, African countries have embarked on a journey to integrate at the regional and continental levels through a plethora of Regional Integration Agreements, also called Regional Economic Communities (RECs) in Africa. Two types of Regional
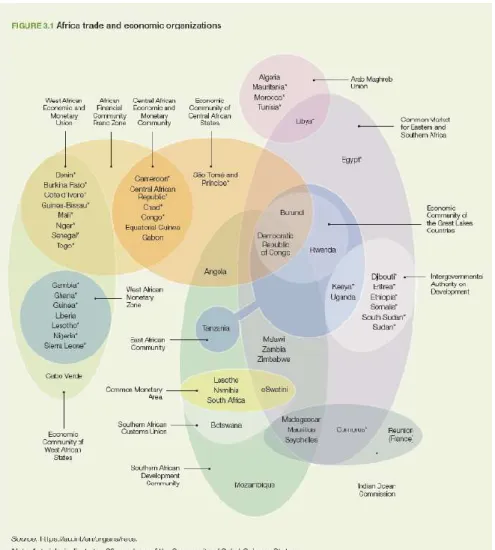
Organizations (ROs) were set up to carry out this integration: Trade and Economic Organizations (see figure 1) and other ROs (see figure 2). From the start, most efforts at integration have concentrated on removing policy-imposed barriers (tariffs and Non-Tariff Barriers (NTBs)) to trade in goods, then more recently to the movement of capital and persons following the European linear model of integration. These steps towards market integration were part of – and often the main – mandate in the negotiations in the trade and economic organizations listed in the figure 1 (the three distinct phases along this journey are summarized in section 1.2.)
Figure 1: African Trade and Economic Organizations
13 The geography of Africa inherited from the ‘scramble of Africa’ in the late 19th Century is the strongest rationale for regional integration among many largely ‘artificial states’. Recall the following. First, the share of straight-line (i.e. artificial) borders is about 80% across Africa, the highest across continents. Second, ethnic partitioning across borders is strongest in Africa. The mean of the share of an average African country’s population that comes from partitioned ethnicities is 47% while for non-African countries it is 18.2% (Alesina et al., 2011). Third, Africa has the highest share of countries per area across continents
mechanically increasing the importance of transboundary externalities within the continent. The importance of these RPGs is evident from the large number of specialized organizations across the continent. Table 1 lists the most important among these along with the two other types of Regional Organizations: The ‘AU-recognized RECs’ and the ‘other economic
organizations’ that often, though not always, focus on market integration. This primer starts from Newfarmer’s (2017) observation that evaluation of progress at integration in Africa has concentrated on eliminating barriers to trade in goods (and only recently to trade in services including the mobility of people and capital) at the expense of evaluating progress on the provision of RPGs.
Typically, the transboundary externalities are addressed in the specialized Regional
Organizations (ROs) established to supply Regional Public Goods (RPGs) such as electricity, hard infrastructure, management of rivers and lakes, peace and security, health,
environment. These are the other specialized organizations referred to above. In contrast to private goods, public goods, at all levels, national, regional, global are undersupplied. This is the case everywhere because, once a public good is provided, it is difficult to exclude consumption by non-providers and, except for Common Pool Resources, consumption by one party does not diminish consumption by others. This implies that efficiency calls for usage by all, including non-providers. For national public goods, a sufficiently strong
government can supply these public goods. For all Public Goods, but especially for RPGs, the prognosis for their supply is directly linked to the share of benefits that can be captured by financial contributors. For RPGs, collective action is necessary at the regional level. This requires some delegation of authority beyond the nation state.
Concentrating on the causes of market fragmentation and on the benefits of market integration is easier to evaluate than progress at delivering RPGs. This is why much of the survey concentrates on progress at market integration. It is the path followed by European integration, at a time when barriers to trade in goods were large, trade had not yet been ‘servicified’ and cross-border externalities were less important than they are now. Market integration also brings side-benefits in the form of greater trust as it raises the opportunity cost of conflicts.
For RPGs, it is difficult to estimate the spillover benefits. It is also difficult to get the necessary collective action across countries to ensure their supply of RPGs. This survey recognizes the need to give greater attention to the provision of RPGs in future assessments of progress at integration across the continent.
14
Table 1 Regional Organizations in Africa* AU-recognized Regional Economic
Communities (RECs)
River and lake organizations
Arab Maghreb Union (AMU) [5] Niger Basin Authority [ 9 ] Common Market for Eastern and
Southern Africa (COMESA) [19]
Integrated Development Authority of the Liptako-Gourma Region[ 3 ]
Community of Sahel-Saharan States
(CEN-SAD) [2] Lake Chad Basin Commission [ 6 ]
East African Community (EAC) [6] International Congo-Ubangui-Sangha Commission[6]
Economic Community of Central African
States(ECCAS) [11] Limpopo Water Course Commission [4] Economic Community of West African
States(ECOWAS) [15] Lake Tanganyika Authority [ 4 ] Intergovernmental Authority on
Development (IGAD) [7] Lake Victoria Basin Commission [ 5 ] Southern African Development
Community (SADC) [16] Nile Basin Initiative [ 10 ]
Other economic organizations Permanent Okavango River Basin Water
Commission [ 3 ] Central African Economic and Monetary
Union (CEMAC) [ 6 ]
Organization for the Management of the Gambia Rive[ 4 ]
Economic Community of the Great Lakes Countries (CEPLG) [ 3 ]
Organization for the Development of the Senegal River [ 4 ]
Gulf of Guinea Commission (GGC) [ 8 ] Orange-Senqu River Commission [ 4 ] Indian Ocean Commission (IOC) [ 4 ] Tripartite Permanent Technical Commission
[3]
Mano River Union (MRU) [ 4 ] Volta Basin Authority [ 6 ] Southern African Customs Union (SACU)
[5 ] Zambezi Watercourse Commission [ 8 ]
West African Economic and Monetary
Union (WAEMU) [ 8 ] Peace and security organizations
Energy-based organizations Eastern Africa Standby Force [ 10 ]
Maghreb Electricity Committee [ 5 ] International Conference of the Great Lakes Region [ 12 ]
Eastern Africa Power Pool [ 10 ] G5 Sahel [ 5 ] West African Power Pool [ 14 ]
Environmental organizations
Central African Power Pool [ 10 ] Central African Forest Commission [ 10 ] Southern African Power Pool [ 14 ]
15 This survey has three objectives: take stock and understand the extent of progress at market integration; summarize or provide new quantitative evidence wherever possible; and
discuss challenges ahead. In the short term, the challenge is to complete negotiations for Phase I of the AfCFTA (tariff schedules, convergence in rules of origin across RECs, set up a workable dispute settlement mechanism) and take advantage of the opportunity offered by the Trade Facilitation Agreement (TFA). In the longer term, the challenge is to make
progress at the provision of RPGs.
The emphasis is on measurable achievements.1 Wherever possible, the paper compares
performance with selected ‘comparable’ Regional Trade Agreements (RTAs) here represented by ANDEAN, ASEAN and MERCOSUR.2
1.2 The three phases of African Integration: from the Lagos plan of Action to the AfCFTA A first impulse took place under the Lagos plan of action (in 1980), an initiative of the
Organization of Africa Unity (OAU). Vagueness and a multitude of objectives throughout the different phases of negotiations, helped States gloss over the issues that divided them. The skewed distribution of benefits that would have resulted from the great disparity
characteristics and interests among members would have required large compensation from the gainers to the losers. Absent central funding raised by less distortionary means, funds were either obtained by distortionary taxes negating any efficiency gains from
eliminating protection among partners, or trade barriers were not removed.3 So, during this
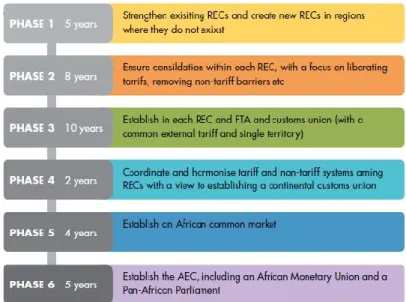
first phase, with the exception of integration in the Franc zone in CEMAC and UEMOA, implementation never reached the Free Trade Area status, let alone deeper integration. The Abuja Treaty (operational in 1994) created the Africa Economic Community (AEC). It marked the beginning of the second phase when regional cooperation started in earnest. Eight RECs would set out the path for the creation of the AEC by 2028 (see list in table 1 and membership in figure 1). A Free Trade Area (FTA) would be first established, followed by a customs union, a common market, and a monetary union following a ‘variable geometry’ whereby integration would be at different speeds across RECs following a ‘Minimum Integration Program’ along six stages for the eight RECs but also through the other more specialized organizations. Abolition of barriers to free trade between the various RECs was only to take place at stage 4 when customs unions would be fully operational.
And now, since the launch of the African Continental Free Trade Area (AfCFTA) in March 2018 with entry into force on May 30, 2019, a third phase is under way. This FTA at the
1 Nine UNECA reports, the 2019 AfDB’s Africa Economic Outlook, and the regularly updated Doing Business
reports of the World Bank, all monitor progress. To avoid repetition, metrics presented here are mostly complementary to those presented in those reports.
2 These are very imperfect comparators as ASEAN had two high-income members, Brunei and Singapore, and
the average per capita income of comparators is close to ten times that of the average African REC.
3 For example, in West Africa preferential customs duties (e.g. the ‘Taxe de coopération régionale’ applicable
to partners’ industrial products were tailored to the ‘protection needs’ of the least advantaged partners. In Europe, until Brexit, France delayed progress towards deeper integration when it opposed the planned move in the Treaty of Rome from unanimity to majority voting in the European Council fearing that it would have to adopt policies it would oppose. The conflict over sovereignty was also apparent when several countries opted out of the 2007 Lisbon Treaty which further strengthens EU institutions and inches towards qualified majority voting.
16 continental level was envisaged since the start of the process, but only after FTA status had first been achieved at the REC level (i.e. at the end of Phase III of the Abuja Roadmap in Figure 2).
Figure 2 The Abuja Roadmap: 1994-2028
This third phase coincides with the launch of its 50-year vision on the 50th year anniversary of the OAU, called ‘Agenda 2063’ (AU, 2015). Titled “The Africa We Want”, the vision calls for “a prosperous Africa based on inclusive growth and sustainable development” implying that fast-tracking a Continental FTA should be built around the post-2015 development agenda. With SDGs occupying center stage on the global policy coordination front, African integration is also to take into account the environmental footprint of industrialization. If anything, rather than concentrating on a narrower range of objectives, in its deeper reach, the AfCFTA recognizes the multidimensionality of integration.
An ambitious seven-cluster action plan4 for “Boosting Intra-African Trade (BIAT)” preceded
the launch of Vision-2063. By adopting the BIAT plan at the same Summit as the AfCFTA, the leaders had recognized that trade integration alone will not solve Africa’s development challenges. The BIAT Action Plan references and incorporates the Action Plan for
Accelerated Industrial Development of Africa (AIDA) and the Programme for Infrastructure Development in Africa (PIDA). Thus, African leaders envisage that the AfCFTA would be implemented together with the BIAT, AIDA and the PIDA. The AfCFTA recognizes that a successful integration extends beyond market integration to include RPGs. RPGs are not supplied by the market. They require collective action, often beyond the state level. Much
4 The seven priority clusters are: trade policy, trade facilitation, productive capacity, trade-related
17 has been written on the architecture and the two envisaged phases of the AfCFTA (see summary in annex) but assessments have concentrated on describing objectives rather than on achievements so far.
The expression ‘developmental regionalism’ encapsulates this expanding scope of regional integration shown in figure 2. UNCTAD (2013) defines developmental regionalism as
“cooperation among countries in a broader range than just trade facilitation, to include—for example—investment, research and development, as well as policies aimed at regional infrastructure provision, such as the building of better networks of roads and railway”. This approach that characterizes the ‘Agenda 2063’ is an extension of the linear model of
regional integration first envisaged in the Abuja Treaty. The roadmap towards an AEC scheduled for 2028 includes an African Monetary Union and a Pan-African Parliament. The roadmap in figure 2 still emphasizes the linear model, first within each REC until stage 4 (in 2019) when harmonization of tariff and non-tariff systems is supposed to take place across RECs.5
This roadmap is certainly ambitious if one recalls the long and tortuous path at European integration over a fifty-year period. At the same time, it recognizes that the politics of economic integration cannot be left aside. Nonetheless, in an environment of still weak governance and weak institutions at the country level, one can hope that regionalism will provide an anchor for good policies if there is sufficient political commitment at the country level.
However, as mentioned above, African countries are patchworks of ethnic groups where the fragmentation of civil society hampers the emergence of organized counter-groups,
exposing policy-making to powerful lobbies from very narrow special-interest groups whose influence would likely be diluted in a larger community.6 Developmental integration
emphasizes the interdependence of benefits, though it does not recognize that, to be successful, sufficient delegation of authority to a supra-national level is needed. This survey recognizes these tensions that detract from applying the principle of subsidiarity which is necessary for regional cooperation to help move forward regional integration.
1.3. Outline
Section 2 discusses the dimensions of the AfCFTA agenda. It identifies a trilemma implied by the ambitious objectives among highly diverse economies. The example of the negotiations for the TFTA is used to illustrate difficulties implied by diversity in the context of
negotiations for a large group (28) of countries. The specter of capability traps implied by the ambitious agenda in a setting of limited implementation capabilities is raised.
Section 3 takes stock of the policy measures actually taken (as opposed to commitments) to integrate markets distinguishing between ‘shallow’ (goods market only) and ‘deep’ (other markets, behind-the-border) measures. The section shows an uneven progress at
implementation across RECs. The resulting disparity in starting point across the RECs
5 See UNECA (2017, figure 2.2).
6 Melo, Panagariya and Rodrik (1992) present a model in which the strength of lobbying activities (that take
place within countries) is diluted through regional integration where there is delegation of authority to a supra-national level.
18 increases the challenge for implementing the AfCFTA agenda. This is recognized in the variable geometry approach.
Section 4 examines outcomes on market integration so far. It looks for changes in trade patterns around the time of implementing the RECs, and of the extent of regionalization of trade in new manufactured products. Measures of progress at financial integration and labor market integration are discussed. In goods markets, the next step at integration beyond a FTA involves adopting a common external tariff (CET). The experiences of EAC and ECOWAS are presented to show that the outcome is detrimental to the poor in Rwanda and Liberia, two small partners in their respective Customs Union.
Intra-African trade is still low, leading observers relying on patterns of bilateral trade suggested by the gravity model to summarize intra-African trade by a ‘proximity gap’, another way of saying that, controlling as best possible over a large number of countries, trade among African countries should be more intense. Section 5 turns to evidence on these trade outcomes reviewed in section 4. Model-based calculations of trade costs show that these costs have fallen over the last two decades, but not faster than elsewhere.
Correlations suggest that, having controlled for distance and other bilateral characteristics like common border and common language, high bilateral trade costs are associated with large gaps in indicators of institutional quality. Controlling for bilateral and time-varying factors affecting bilateral trade, 50-year panel estimates of the intensity of bilateral trade in manufactures show that membership to the WTO and to REC are associated with greater intensity of bilateral trade. For the development of regional value chains, estimates of the intensity of bilateral trade in parts and components are positively related to measures of ‘deep integration’ an indication of the importance of tackling ‘behind-the-border’ measures that affect trade.
Section 6 wraps up the evidence on market outcomes. It complements the widely used Africa Regional Integration index that gives a comprehensive dashboard of where
integration stands, but that mixes outcomes with policy measures with two other indicators. The first is a micro-level scorecard that tallies implementation of (and backtracking on) commitments at integration. Such a scorecard was built for the EAC and applied for 2014 and 2016. It checks whether EAC customs laws which prevent member states from introducing any new restrictions on the provision of goods, capital and services, are respected.7 Applying such a scorecard at other RECs would help greatly the extent of
progress at policy implementation. The second, is an outcome indicator based on changes in light-intensity along all major cross-border African roads. Evolution of this index of
luminosity suggests that the thickness of African borders has, indeed, fallen over the period 2000-13.
The fall in the costs of moving goods, people, and ideas has resulted in the unbundling of economies into Value Chains at the global and regional levels. This represents an
opportunity for African countries to increase their participation in global trade without having to produce a complete product in order to enter a new product line. Section 7 gives estimates of the relatively low participation by the RECs in Global Value Chains (GVCs) over
19 the period 1990-2015, confirming that participation has been mostly on downstream side (i.e. value-added exports enter mostly as inputs into exports of importing countries). Two areas for reducing costs are singled out for attention: adopting simple rules of origin (detains in annex A3) and ‘taking seriously’ the Trade Facilitation Agreement (TFA). New estimates of the potential reduction in times at the border suggest much room for improvement.
Section 8 turns to the challenges of providing RPGs. These are pervasive covering many inter-related functions (economic cooperation and integration, human and social
development, natural resources and the environment, cross-border infrastructure, Peace and Security, Governance).8 Because this primer is mostly about economic integration, we
only cover evidence of the supply of RPGs in two areas: peace and security and cross-border infrastructure. For both, the evidence shows that provision of these RPGs is conducive to regional integration.
Section 9 concludes.
The annex gives details on the AfCFTA in the broader landscape of African integration and two challenges facing a successful completing of phase I negotiations: a workable dispute settlement mechanism and ‘business friendly’ but not ‘business owned’ rules of origin. Because successful provision of RPGs rests on the delegation of authority to supra-national levels, the annex mentions two examples of delegation of authority: the peer review mechanism and the standby force.
20
2. Implementation challenges
2.1 The 2016 Agenda: an African integration trilemma9
The AfCFTA entered into force on May 30 2019, with the important arrival of Nigeria in early July.10 If all signatories fulfil the domestic requirements for certification, AfCFTA will have
the largest membership of a free trade area in the world since the launch of the GATT (now the World Trade Organization, WTO) 70 years ago. If all African countries have joined the free trade area by 2030, the market size would include 1.7 billion people with an estimated US$6.7 trillion of cumulative consumer and business spending. The incompatibility of three competing objectives in the AU’s Agenda 2063 presents a challenge. The three objectives are:
• African solidarity (to accommodate all countries).
• Large markets (no policy-imposed impediments to trade to reap economies of scale).
• Deep integration (to reap all the benefits of integration).
Typically, membership in each of the eight regional economic communities (RECs), through which integration is to continue includes resource-rich and resource-poor countries, coastal and landlocked countries, and large and small countries with differing population densities. As mentioned in the introduction, African countries are also highly diverse along multiple dimensions (ethno-linguistic, religious and biological).
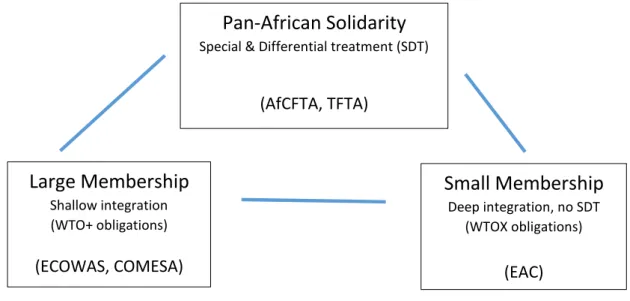
These diversities point to an ‘integration trilemma’ facing the 2063 agenda of integration. This trilemma is shown in Figure 3, where for each objective, further distance from the vertex indicates less achievement. Figure 3 suggests that even if integration were to progress smoothly within each REC, Africa cannot be at all three vertices simultaneously. Solidarity requires Special and Differential Treatment (SDT) for least developed countries (LDCs) and financial resources (which are in short supply) to compensate for integration costs. Solidarity requires trust, which falls as membership size increases. During the AfCFTA negotiations, South Africa strongly opposed financial compensation (Parshotam, 2018). The compromise is that SDT is to be built into the Treaty on a case-by-case basis and LDCs have an extended implementation period.
SDT accommodates this diversity but at the cost of market fragmentation. Thus, the Tripartite Free Trade Area (TFTA) among the Common Market for East and South Africa (COMESA), the Economic Community of West African States (ECOWAS) and the Southern
9 This section draws on
https://theforum.erf.org.eg/2019/01/28/african-continental-free-trade-area-integration-trilemma/.
10 As of mid-July 2019, the AfCFTA has collected 52 signatories (Benin and Eritrea had not signed), with 26
signatories having deposited their instruments of ratification. A three-phase sequential protocol (right of entry and abolition of visa requirements; rights of residence; right of establishment) launched in 2018, has collected 30 signatures. South African and North African countries are reluctant to enter phase I unless number of preconditions are met.
21 African Development Community (SADC) or the AfCFTA can achieve solidarity but at the expense of a continental market and deep integration.
Fully reaping economies of scale requires large membership (COMESA, ECOWAS) and low trade barriers. This precludes SDT for the LDCs, which segment markets by raising trade costs and effectively limits the size of the market.
Deep integration as in the case of the EAC results in the integration of financial markets and the mobility of people. Deep integration requires trust. Trust is more easily achieved in a small membership setting (such as the East African Community). Because of the lack of trust needed to delegate authority to supranational institutions, embracing diversity to satisfy political objectives impedes deep integration.
Figure 3 The African Integration Trilemma
African diversity also points to an implementation conundrum. On the one hand, because of diversities – such as between coastal and landlocked countries – potential gains from closer economic integration are large. On the other hand, realising these gains requires financial resources necessary to compensate countries with large differences in expected gains from closer integration.
The wasteful Common Agricultural Policy (CAP) amounting to 1% of European Union GDP has often been explained as a political compromise between France and Germany whereby German manufacturers gained access to the French market while German taxpayers helped to subsidise French farmers. In the African context, the AU could only finance 44% of its budget from member States contributions. Reaching financial viability via a 0.2% levy on all eligible goods imported to the continent from outside could be controversial under current WTO law (Aria 8, UNECA, 2017). In any case, political compromises will be needed for the AfCFTA to move ahead.
Pan-African Solidarity
Special & Differential treatment (SDT)
(AfCFTA, TFTA)
Small Membership
Deep integration, no SDT (WTOX obligations) (EAC)Large Membership
Shallow integration (WTO+ obligations) (ECOWAS, COMESA)22 Deep integration as envisaged under the AfCFTA calls for some delegation of authority to a supra-national level. The needed trust is difficult to build under any circumstance, but particularly so under Africa’s landscape of great diversity. And the establishment of supranational entities rests on implementation capabilities, also in short supply across Africa.
Negotiations on ‘technicalities’ are still besieging Phase I of the AfCFTA where negotiations follow the principle of the ‘acquis’ (see annex). The acquis, whereby anything agreed upon under the RECs, cannot be undone until there is full agreement by all participants, will also likely prevail during Phase II negotiations of the AfCFTA. These technicalities include agreement on a common set of rules of origin, on a dispute settlement mechanism, and agreement on trade remedies (i.e. on conditions for the use of contingent protection). 2.2 Market size and the provision of Public Goods
Figure 4 compares the market size of each REC with that of France. Suppose that each REC had no trade barriers across members. Then only CEN-SAD, the largest REC, would have a market size greater than France’s. However, in 2016, ECOWAS and CEN-SAD are the two RECs where average applied intra-REC tariffs are barely below corresponding MFN averages (see AEO 2019 table 3.1). This means that tariff protection still segments intra-REC markets. Among the RECs, only the EAC and ECOWAS (see figure 5 below) have zero bilateral tariffs. Assuming these data are accurate – and omitting exclusions and from the CET – policy barriers still segment markets within the RECs. With such small markets, economies of scale remain unexploited in many markets.
Small markets also hamper the provision of public goods. Suppose that in each country the only objective of the government is to provide a non-rival national public good (health, infrastructure…) through a tax levied on its citizens. The population has heterogeneous preferences. People cannot cross borders. In this setting there is a trade-off between larger markets that lower the cost of producing the public goods and raise income, and the costs of accommodating heterogeneity in large populations. By reducing trade costs, international economic integration, say along the paths set out by the RECs, increases the number of economically viable countries as the size of the market matters less for productivity and hence as a determinant of country size in providing the national public goods. 11
It is hard to escape the conclusion that, across Africa, markets are too small in all but a handful of countries, so there is no alternative to relentlessly pursuing economic integration, the objective of the RECs and African Union even if it is at the expense of accommodating heterogeneity in preferences.
11 This trade-off is explored formally in Alesina and Spolaore (2003). Human capital externalities on total factor
productivity in growth models find support in the data (Ades and Glasser, 1999). Larger countries (measured by population size) also rely more heavily on the more efficient forms of taxation (income tax) relative to the less efficient ones (taxation at the border where the tax base is smaller requiring a higher tax rate to collect the same government revenue). See Easterly and Rebelo (1993).
23 Figure 4: Market size across African RECs (GNI 2018 at PPP)
Notes: For each REC, the three largest countries in terms of PPP GNI are represented individually. Smaller countries are lumped a residual blue category. Below, the list of
members in each REC by descending order of GDP with countries under $50 billion in italics. For reference, the canton of Bern in Switzerland (1 million) has a PPP GDP of 58 billion.
CEN-SAD : Egypt, Nigeria, Morocco, Sudan, Kenya, Tunisia, Ghana, Libya, Côte d'Ivoire, Senegal, Mali, Burkina Faso, Guinea, Chad, Benin, Niger, Mauritania, Togo, Sierra
Leone, Liberia, Cabo Verde, CAR, Gambia, Guinea-Bissau, Comoros, Sao Tome and Principe, Djibouti, Eritrea, Somalia.
COMESA : Egypt, Ethiopia, Sudan, Kenya, Libya, Uganda, DR Congo, Zambia, Zimbabwe, Madagascar, Mauritius, Rwanda, Malawi, Eswatini, Burundi, Seychelles, Comoros,
Djibouti, Eritrea.
ECOWAS : Nigeria, Ghana, Côte d'Ivoire, Senegal, Mali, Burkina Faso, Guinea, Benin, Niger, Togo, Sierra Leone, Liberia, Cabo Verde, Gambia, Guinea-Bissau.
SADC: South Africa, Angola, Tanzania, DR Congo, Zambia, Zimbabwe, Madagascar, Botswana, Mozambique, Mauritius, Namibia, Malawi, Eswatini, Lesotho, Seychelles. UMA: Algeria, Morocco, Tunisia, Libya, Mauritania.
IGAD: Ethiopia, Sudan, Kenya, Uganda, Djibouti, Eritrea, Somalia, South Sudan.
ECCAS: Angola, Cameroon, DR Congo, Gabon, Equatorial Guinea, Chad, Congo, Burundi, CAR, Sao Tome and Principe EAC: Kenya, Tanzania, Uganda, Rwanda, Burundi
24 In contrast to the hypothetical situation above, African countries are diverse along the characteristics needed to deliver public goods successfully. On the trade side, diversity is a source of gains from trade, but it also sets up conflicts of interest that must be managed. Successful industrialization depends on market integration but the realities of the African landscape complicate this quest to integrate economically. Below are factors to take into account before reviewing progress to date and challenges ahead.
2.3 Reconciling wide-ranging objectives: the case of the Tripartite FTA
Integrating in a large membership exacerbates these differences in preferences. As examples, consider the following objectives taken from Treaties (see Melo and Tsikata (2015)). Harmonizing regulations and policies features among the objectives of the AMU. For ECOWAS with its very heterogeneous membership (11 of 15 members are LDCs eligible for EBA and AGOA preferences12 from the EU and US), the Treaty calls for the establishment
of a West African parliament, an economic and social council, and an ECOWAS court of justice to enforce community decisions. SACU calls for expanding the development of their least developed members. As recognized by UNECA in its yearly progress reports, in spite of accepting that integration would have to take place at different speeds through variable geometry, progress has been slow. UNECA (2012: 13) notes: ‘…despite current initiatives, results remain mixed. Whereas certain RECs have achieved tangible outcomes… others have had relatively disappointing results’.
Moving ahead under the AfCFTA will require compromises to achieve a minimum of common objectives. Difficulties in doing so are illustrated in the long-lasting, and still ongoing, negotiations for the Tripartite FTA (TFTA) involving COMESA, the EAC and SADC. The protracted TFTA negotiations illustrate the difficulties encountered during the AfCFTA negotiations. The negotiations principles of the TFTA follow a ‘variable geometry’ under the ‘acquis’ (that is, nothing agreed by the COMESA, EAC and SADC free trade agreements, FTAs, can be undone).
Instead of merging the three FTAs into one, the TFTA has evolved into a new FTA encompassing the three existing RECs. These developments raise the question of how, under the necessity of preserving the acquis to maximise membership by accommodating diverging interests, the AfCFTA, will be able to overcome the heterogeneity of interests across RECs.
In terms of Figure 3, moving towards the top vertex is through ‘shallow’ integration at the sacrifice of economic efficiency. It is also unlikely that the brake on integration caused by the negotiation principles in the TFTA will reduce heterogeneity of preferences across members. A fortiori, this will be the outcome of the negotiations under the AfCFTA.
12 Sorgho and Tharakan (2019) assess the impact of these unilateral concessions (EBA and AGOA) on the
exports of African beneficiary countries. They confirm that a country becomes eligible for both preferences only when it meets certain conditions, defined by their donors, such as political stability and economic
regulation (for AGOA), and freedom of expression and human development (for EBA). Their results show that both AGOA and EBA policies have had a positive impact on African beneficiary countries' exports towards unilateral preference providers.
25 The TFTA, which was initiated in 2008 and signed in 2015, was intended to reconcile the challenge of overlapping REC membership.13 This overlap has traditionally permitted
governments to cherry-pick which commitments they uphold. The TFTA objectives are: • Removing tariffs and non-tariff barriers, and implementing trade facilitation measures to include a harmonisation of rules of origin.
• Applying the subsidiarity principle to infrastructure to improve the transport network.
• Fostering industrial development.
But to keep momentum going and to accommodate the diversity of interests among partners, negotiations to set up a ‘single undertaking’ to establish a proper FTA veered towards a ‘variable geometry’ under the principle of flexibility to allow the co-existence of different trading arrangements.
‘[T]he principle of flexibility … allows progression in cooperation among
Member/Partner States in a variety of areas at different speeds. The TFTA will allow the co-existence of different trading arrangements which have been applied within COMESA, EAC, and SADC member states and any trading arrangements that may be reached during the negotiations. The principles of variable geometry, reciprocity and acquis are complementary’ (Erasmus, 2013).
This means that the negotiations principle of a single undertaking (in the sense that all must be agreed in a single go) where ‘nothing is agreed until everything is agreed’ no longer made sense since the result would be a new FTA. This implies that the parties probably did not agree to a prior agreement about the agreement.
Not surprisingly, under the variable geometry with the acquis, the three blocs reached a common position on the proportion of tariff lines to be liberalised, but failed to agree on the common external tariff to be applied on sensitive products (maize, cement, sugar, second-hand clothes, spirits, plastics, electronic equipment, etc.). Other technical difficulties besieged the completion of Phase I on non-tariff barriers (article 10 and annex 3), rules of origin (article 12 and annex 4), trade remedies (articles 16-20 and annex 2), and dispute settlement (article 10 and annex 10) – see Luke and Mabuza (2015).
Despite agreeing that the three RECs would work towards merging into a single REC, this did not happen. Instead, the TFTA evolved into a new FTA encompassing the three existing RECs because it is based on preserving the acquis, a fear voiced by Erasmus. The expression of these disagreements had greater intensity because the negotiations started from the acquis, that is the point reached by each of the COMESA, EAC and SADC negotiations. Phase II of the TFTA negotiations covering competition policy, intellectual property rights and investment movement of business persons are still on the table because of difficulties encountered with the acquis and variable geometry (see annex).
13 Economically, the overlap of RTAs (such as RECs) can led to a negative trade effect between members
26 2.4 Capability traps and Political economy considerations
This ‘big development’ agenda across RECs, recalls the European Union (EU) integration model from which it is inspired. In the European integration model, the bet was that creating institutional bodies focusing on consensus decision-making would lead to a reduction in ‘heterogeneity costs’ across the different European populations as envisaged by the functionalist approach to European integration (Spolaore, 2015)14. This integration
process over a 50-year period involved the creation of 13 institutions (and an institution regrouping four inter-institutional bodies). This building of institutions rested on a high implementation capability. Among the RECs, ECOWAS has six institutions, ten specialized agencies, and two private sector organizations, COMESA has 11 institutions, and the EAC, which has gone furthest in terms of integration, has 8 institutions.
Pritchett et al. (2013) criticize this ‘big development’ agenda for encouraging progress through importing standard responses to predetermined problems. This approach, which they call ‘isomorphic mimicry’, is a technique of failure, in this case the adoption of the EU institutions. This camouflages a persistent lack of capability that perpetrates a mismatch between expectations and the actual capacity of prevailing administrative systems as shown by the COMESA report below.
Melo et al. (2018) cite a report of the 2014 meeting of the Council of Ministers of COMESA that took stock of progress in implementing the Customs Union adopted in 2009. The report illustrates implementation difficulties. Taking a tally of the 217 decisions reported in the Common Market gazette from 2009 to 2012, the report notes that 13 per cent of the decisions were not addressed to any party. Regarding the signing and ratification of
COMESA instruments that were to be carried out from 2009 to 2012, 75 per cent (of the 12 instruments) had been signed by the majority but only five instruments had been ratified, and only nine of 19 members had signed the COMESA Treaty (COMESA, 2014: Tables 1 and 2). Likewise, the report notes little progress in enacting the key Common Market legislation (Common Tariff Nomenclature, Common External Tariff and Common Market Customs Management Regulations). 15
Perhaps striving for these ambitious targets creates more pressure for change than would less ambitious targets. In the case of the AfCFTA, an important implementation issue is
14 Spolaore (2015) describes how to move towards a federation of States, the European States created
supra-national institutions (the EC, the Parliament, Court of Justice) and intergovernmental institutions (Council of Ministers and the European Council). Integration would be through a chain reaction. Integration would move forward by transferring specific functions to the supranational institutions. In the case of European integration, the theory of functionalism reflected the view that deeper integration towards political integration would be pushed by elites and interest groups that transcended national borders rather than by the people. In the road toward the Euro, at each step--which was viewed as irreversible-- a pre-existing contradiction would be solved. The path towards the federation of States creation of the Euro was then part of a chain reaction towards the Federation of States. Through cooperation, people’s preferences would converge endogenously.
15 Malawi reported that adopting the CET would result in a large loss of tax revenue (trade taxes account for 35
per cent of tax revenue). Other states with more than 50 per cent of tariff lines at zero rate, some of which are bound at that level at the World Trade Organization (WTO), were concerned about the possibility of eventual negotiations at the WTO for adopting the envisaged CET.
27 whether or not it is an example of premature load bearing that Pritchett et al. (2013) qualify as ‘asking too much of too little too soon too often’ (Pritchett et al., 2013, p.37).
A more optimistic view of the AfCFTA (and of regional integration) sees implementation as possible if political economy conditions are recognized and translated into a less ambitious agenda. First, the tension between form and function, often noted in evaluation reports, is not reflected in the look-alikes of best-practice models reflected in the structure of the Treaties. As noted in Byiers et al. (2015), the regional public institutions (regional courts and parliaments) are mistaken for the stated institutional functions (budget management
accountability, transparency, conflict mediation). This results in the gap between policy decisions and implementation. Stated succinctly, what you see is not what you get. These tensions between form and function result in incomplete transposition of regional
commitments to national and regulatory texts and other practices, legitimate and illegitimate, that create de facto barriers to integration.
Since regional integration is driven by groups and coalitions of actors, this must be taken into account. In the case of the EU, the functionalist model progressed from the top-down until it was stalled when the Dutch and the French rejected the European Constitution in their national referenda. In Africa, it is the leaders at the highest level that count the most. The considerable weight of the big 3 (or 4) could unblock stalemates and overcome
coordination failures in regional collective action. However, in reality, these are the most protectionist countries on the continent so that in practice small countries can carry more than their weight in resolving coordination failures. But to do so, trade negotiators should have greater stake/influence up-front including through more consultations prior to meetings at the Heads of State level. For example, for those trade negotiators with experience in negotiations, their experience is usually for trade in goods, and not for negotiations in the “new” issues not covered in the multilateral negotiations.16 This
probably helps explain their observed low enforceability. The expertise required to make progress on the WTO-X issues (see table 7 below) is held by the regulators and the institutions they belong to. But these regulators are not in the trade ministries that are in charge of implementing the agenda. A fortiori, experts on the technicalities besieging negotiations on RPGs are not part of the negotiating teams in the RECs.
16 These new issues cover behind-the-border measures (capital and labor regulations, domestic trade-related
regulations, other regulation) often referred to as “WTO-X” measures. figure 3.5 in AEO2019 shows that coverage of WTO-X measures are as high -or higher- across the RECs than in other South-South RTAs, but that deemed legal enforceability is lower.
28
3. Policy Measures to foster market Integration: Progress so far
Markets are integrated when trade costs are low, that is when arbitrage (buying in locations where prices are low and selling in locations where prices are high) erases differences in prices (i.e. nothing is left on the table). Trade costs are high when the geographical landscape is unfavorable and when hard infrastructure (e.g. roads and railways) are poor and when soft infrastructure (e.g. logistics markets) are poor. Trade costs are also high when governments put up barriers and when informal rent-extraction takes place. Here we look for evidence of reductions in policy-imposed trade barriers, the main objective of the Phase I of integration along the Abuja road map.17
3.1 Shallow integration: Reduction in tariffs and non-tariff barriers to trade
Three observable changes in policies can accelerate integration. Under ‘shallow’ integration: (i) a reduction in tariffs between members and a reduction in non-tariff barriers (NTBs) that result from policies and from non-policy induced rent-extortion will ease arbitrage. A third channel associated with ‘deep’ integration includes the two components of ‘trade
facilitation’: a ‘hard component’ related to tangible infrastructure like ports, roads, highways and telecommunications; and a ‘soft’ component related to transparency,
customs management, the business environment and other intangible institutional aspects that affect the ease of trading. This third channel includes the WTO-X measures—reduction of barriers in capital and labor services, harmonization and streamlining of behind-the-border measures and the provision of RPGs belong to this category. To better appreciate progress and challenges ahead, we benchmark against three other PTAs, all among (mostly) developing countries (number of members included in each PTA in parenthesis): ANDEAN (5), ASEAN (10), MERCOSUR (4).
Tariffs. Traditionally, and certainly for integration along the RECs, the first stage of integration has always been eliminating tariffs on ‘substantially all trade’, where
substantially is left purposely vague, at least at the WTO. A first exercise then is to compare average applied tariffs at the MFN and at the REC level and then with comparators. This comparison is carried out in two steps. A first step involves calculating for each country its average applied MFN tariff level from HS6 tariff data, then to compare it with the
corresponding applied bilateral average across REC members. The second step takes
17 Two examples illustrate possible sources of market segmentation. In the case of trade in homogenous
products involving little transformation, ethnicity and hence trust, can be an important factor. For agricultural products, using high-frequency data on cowpea and millet prices traded between Niger and Nigeria, Aker et al. (2014) analyze price dispersion between locations on opposite sides of national borders. They find that the extra cost across the national border is much smaller, and in some cases insignificant, when markets on either side of the border share the same ethnicity. Lack of information can also impede arbitrage. In a study of fish markets across the State of Kerala in India, Jensen (2007) showed that the advent of mobile telephony enabled fishermen to arbitrage price differences across markets increasing their profits by 8 percent on average as a result of mobile telephony.
29 averages across all REC members. Thus, in the case of SADC, the average applied tariff to members is 1% while the corresponding average MFN tariff is 9%.
Figure 5 displays the dispersion between applied MFN tariffs and applied bilateral tariffs of two Customs Unions (CUs),ECOWAS and EAC and two FTAs, SADC and COMESA For the sake of readability, MFN tariffs above 40% are not included in the figures although the
percentage of tariffs in that category are included under the scatters. Under full intra-REC free trade, all points on the scatter would be bunched on the horizontal axis. This is the case for ECOWAS and the EAC. Note, however, that exceptions to the Common External Tariff (CET) and exclusions are not plotted. With little tariff reduction on intra-regional trade, most points would lie on the 450 line. While this is never the case, COMESA and SADC have a large
share of positive applied bilateral tariffs.
Three patterns stand out. First for the two CUs, subject to the exemptions and exclusions not shown in figure 5, the scatter plot suggests that intra-REC trade is tariff free. Second, for the two FTAs little reduction in applied bilateral tariffs has taken place for high MFN tariffs. Third, difficulties in applying tariff-free intra-REC trade comes out from the scatter. The bunching of tariffs on the horizontal line only holds for MFN tariffs under 5%. And for COMESA, there are quite a few points on the 450 line even for low MFN tariffs. In the
absence of contingent-protection measures and dispute settlement rules, the objective of reaching free trade at the continental level is still a challenge. The AU will need to set up institutions to monitor progress towards reaching free trade status. This is always difficult to do, but especially so among low-income countries where implementation capabilities are weak.18
18 In interpreting these comparisons, recall that indicators of capability of implementation are much higher in
the comparator group. First, the average per capita income of the comparator group is over ten-fold that of the African RECs. Second, comparators have more alternatives to border taxes as sources of government revenue. Third, indicators of trust (e.g. the Ethno-Linguistic Fractionalization (ELF) index where higher value indicates more fractionalization) are more favorable among the comparators. Average (simple) per capita income in parenthesis and coefficient of variation in squiggles {…} and ELF index in brackets. ECOWAS ($961) {0.88} [0.77]; ASEAN ($10, 508) {1.55} [0.60]; MERCOSUR ($9154) {0.43} [0.23]; EAC ($630) {0.51} [0.56]. Source (Melo et al. 2018: Table 1).