HAL Id: hal-02309468
https://hal.archives-ouvertes.fr/hal-02309468
Submitted on 9 Oct 2019HAL is a multi-disciplinary open access archive for the deposit and dissemination of sci-entific research documents, whether they are pub-lished or not. The documents may come from teaching and research institutions in France or abroad, or from public or private research centers.
L’archive ouverte pluridisciplinaire HAL, est destinée au dépôt et à la diffusion de documents scientifiques de niveau recherche, publiés ou non, émanant des établissements d’enseignement et de recherche français ou étrangers, des laboratoires publics ou privés.
Can Arginine Inhibit Insulin Aggregation? A Combined
Protein Crystallography, Capillary Electrophoresis, and
Molecular Simulation Study
Kryštof Březina, Elise Duboue-Dijon, Vladimír Palivec, Jiří Jiráček, Tomáš
Křížek, Cristina Viola, Timothy Ganderton, Andrzej Brzozowski, Pavel
Jungwirth
To cite this version:
Kryštof Březina, Elise Duboue-Dijon, Vladimír Palivec, Jiří Jiráček, Tomáš Křížek, et al.. Can Argi-nine Inhibit Insulin Aggregation? A Combined Protein Crystallography, Capillary Electrophoresis, and Molecular Simulation Study. Journal of Physical Chemistry B, American Chemical Society, 2018, 122 (44), pp.10069-10076. �10.1021/acs.jpcb.8b06557�. �hal-02309468�
Can Arginine inhibit Insulin Aggregation? A Combined Protein
Crystallography, Capillary Electrophoresis, and Molecular Simulation Study
Kryštof Březina,1 Elise Duboué-Dijon,1 Vladimír Palivec,1 Jiří Jiráček,1 Tomáš Křížek,2 Cristina M. Viola,3 Timothy R. Ganderton,3 Andrzej M. Brzozowski,3* and Pavel Jungwirth1*
1Institute of Organic Chemistry and Biochemistry, Czech Academy of Sciences, Flemingovo nám. 542/2, 160 00 Prague, Czech Republic,
2Charles University, Faculty of Science, Department of Analytical Chemistry, Albertov 2030, 12840 Prague 2, Czech Republic.
3York Structural Biology Laboratory, Department of Chemistry, The University of York, Heslington, York YO10 5DD, United Kingdom
*Corresponding authors: marek.brzozowski@york.ac.uk (MB) and pavel.jungwirth@uochb.cas.cz (PJ)
Abstract
The oligomeric state of the storage form of human insulin in pancreas, which may be affected by several endogenous components of cells storage granules such as arginine, is not known. Here, the effect of arginine on insulin oligomerisation is investigated independently by protein crystallography, molecular dynamics simulations and capillary electrophoresis. The combined results point to a strong effect of ionic strength on insulin assembly. Molecular simulations and electrophoretic measurements at low/mM salt concentrations show no significant effect of arginine on insulin aggregation. In contrast, crystallographic data at high/molar ionic strength indicate inhibition of insulin hexamerization by arginine due to its binding at site relevant for intermolecular contacts, which was also observed in MD simulations. Our results thus bracket the in vivo situation in pancreatic cells storage granules, where the ionic strength is estimated to be in the hundreds of millimolar to sub-molar range. The present findings add to molecular understanding of in vivo insulin oligomerization and storage, with additional implications for insulin stability in arginine-rich injections.
Introduction
Human insulin is a hormone behind control of blood glucose levels, lipid metabolism, and life span, being also delivered exogenously to patients with diabetes.1 Mature human insulin is a 51-amino acid protein consisting of two disulfide-linked chains: A1-A21 and B1-B30, which triggers cellular responses by binding as a monomer to the (αβ)2 hetero-dimer tyrosine-kinase type insulin receptor (IR). In vivo, insulin is synthesized first as a single chain (pre)proinsulin. Its mature two-chain form is formed by excision of the C-peptide from proinsulin at two-arginine rich sites,
and it is maintained in the storage granules of pancreatic β-cells, which release the hormone to the bloodstream in response to elevated blood glucose levels.
In the pancreatic secretory granules, insulin is stored at mildly acidic pH in the presence of high concentrations of zinc and other ions and ligands.2 It has been suggested that proinsulin assembles in the Zn2+-containing granules into soluble hexamers, which aggregate, precipitate or even crystallize, upon excision of the C-peptide.3–6 Thus, an aggregated crystalline, or amorphous, hormone material is likely the stored form of the hormone in the granules.3,7,8 The formation of aggregating hexamers is supposed to play a role in protecting the insulin from degradation, while the existence of the initial proinsulin form ensures proper folding of the hormone and prevents its fibrillation.9–12 Although the sequence of events for insulin oligomerization and aggregation is not fully established yet, the path connecting monomeric insulin with its hexameric form goes likely through a dimeric intermediate.9,13
Over 200 crystal/NMR insulin structures are deposited the Protein Data Bank (PDB), which include mostly dimers and hexamers of this hormone. Remarkably, the native monomeric form of the hormone has eluded crystallization efforts except for a case where concentrated acetic acid was employed,14 while mutants of insulin yielded several monomeric crystalline forms.15,16 The in vitro insulin hexamer is an allosteric protein, which exhibits ligand-mediated interconversion between different conformational states referred to as T6, T3Rf3, and R6. These states differ by the conformation of the B1-B8 residues of the B-chain, where T correspond to its fully extended form, and Rf/R to a helical conformation which contributes to the long B1-19 helix.9 These insulin allosteric forms exhibit different physical properties such as dissolution rate that is particularly relevant for diabetes treatment.17,18 While the addition of Zn2+ to insulin in the absence of other ligands initiates formation of the hexameric T6 form, smaller phenolic-like cyclic
compounds such as meta-cresol that is used in clinical formulations of insulin can stabilize the B1-B19 helix in a fully helical R6 conformation.9,19,20
We have been interested in the impact of granule-endogenous ligands on insulin conformation and it quaternary states. Our previous work focused on such a role of neurotransmitters such as serotonin and dopamine, which are involved in the exocytosis of the storage granules and may affect insulin aggregation. We provided the first crystallographic evidence that arginine binds to T3Rf3 insulin hexamers forming a ternary complex with serotonin and insulin. There, arginine penetrated the insulin T3Rf3 hexamer filling the voids around Zn2+ and HisB10.21 Arginine is a biogenic molecule that may be abundant in the granules upon processing of proinsulin at its two arginine-rich sites.22 Its presence in insulin solution is also of a clinical relevance as small arginine-rich protamines are employed in some injection formulations of this hormone.23,24 Arginine is also known as a potent stimulator of insulin secretion from pancreas.25,26
Here, we investigate further in vivo allostery of insulin oligomers by studying the sole impact of arginine on the formation of insulin hexamers and its binding to different oligomeric forms of this hormone by a combination of molecular dynamics (MD) simulations, capillary electrophoresis, and X-ray crystallography.
Methods
Experimental details
Crystallographic experiments
Crystallizations of insulin at 5-10 mg/mL in 10 mM HCl were performed in in-house crystallization screens that consisted of known crystal growth condition of this hormone. All
of arginine of 25, 50, 75 and 100 mM. No-arginine controls have also been carried out. All trials were done at 203K. Resulting crystals obtained at 0.6 M Na2SO4, 0.3 M Tris/HCl pH 8.2, 0.6 mM Zn2+ acetate, were flash-cooled directly in liquid N2. X-ray data were collected at Diamond Light, Didcot, UK and processed by xia.27
The structure was solved by Molecular Replacement28,29 using the structure of B1-B6 truncated insulin monomer (PDB ID 1mso) as the model. Model building and refinement were performed by COOT30 and the CCP4 suite of programs.31 Details of X-ray data collection, and refinement statistics are in Table S3 in the Supporting Information. Figures were made using CCP4mg.32
Capillary electrophoresis
Chemicals
Human insulin, recombinant, expressed in yeast (Sigma, USA), L-arginine (>98 %, Sigma, USA), sodium hydroxide (p.a., Penta, Czech Republic), 4-(2-hydroxyethyl)-1-piperazineethanesulfonic acid (HEPES) (≥ 99.5 %, Carl Roth, Germany), and zinc nitrate hexahydrate (p. a., Lachema, Czech Republic) were used as purchased. Deionized water obtained by a water purification system (Premier MFG’D, USA) was used to prepare all aqueous solutions.
Electrophoretic conditions
Capillary electrophoresis experiments were carried out on an Agilent 1600 CE instrument (Agilent Technologies, Germany) using unmodified fused-silica capillaries (Polymicro Technologies, USA), of 50 μm I.D., 375 μm O.D., 35.0 cm total length, and 26.5 cm effective length. Prior to the first measurement of the day, the capillary was activated by rinsing with 1 M NaOH for 10 min,
was flushed for 2 min with background electrolyte. The samples were introduced with a pressure of 5 kPa for 5 s. The diode array UV detector was operated at 200 nm wavelength. The temperature of the capillary cassette was maintained at 25 °C. The separation voltage was set to 25 kV, inducing an electric current of approximately 6 μA.
Background electrolyte and sample solutions
Background electrolyte solutions were prepared as follows. First, a 10 mM HEPES solution was prepared and its pH was adjusted to 7.5 with 1 M NaOH. Zinc nitrate and/or arginine were added to the buffer as 0.1 M aqueous solutions. Insulin was dissolved in water to obtain a 1 mg mL-1 stock solution. From this solution, each sample was prepared by mixing appropriate amounts of the insulin stock solution, of an aqueous solution of thiourea (1 mg mL-1) as electroosmotic flow marker, and of the background electrolyte. The insulin concentration in all the samples was of 8.6 μmol L-1, and the ionic strength was in the range 5.2 - 5.7 mM, depending on the arginine and zinc concentrations.
Computational details
Arginine force field
The Amber force field for arginine was generated using the antechamber33 module. Partial atomic charges were determined using the Gaussian09 software34 at the HF/6-31+G* level of theory using the RESP35 method, after geometry optimization of the molecule at the same level of theory. Full description of the employed arginine force field is provided in the Supplementary Information.
We performed force field MD simulations of the insulin dimer under different physicochemical conditions, which are summarized in Table 1. The insulin dimer was simulated in the presence of arginine at both low (System II) and high ionic strength (1.5 mol L-1, system III). To assess the stability of the experimentally observed binding site of arginine, we also performed simulations at minimal ionic strength conditions of the crystallographic complex obtained in this work, which consists of an insulin dimer with one arginine in each of its monomers (System I). Since a crystallographic complex of the insulin hexamer exhibiting insulin-bound arginine molecules was previously obtained in the presence of arginine and serotonin,21 we also explored the stability of the arginine binding site within the insulin hexamer. To this end, we performed simulations at minimal ionic strength conditions (i.e., only compensation of the protein charge) starting from the crystallographic structure (PDB 5MT9), after removal of the crystallographic serotonin molecules (system V). System No. Insulin Form Number of Arginine Na+ ions Cl⁻ ions Box Vectors* (Å) No. of water molecules Sim. Time (ns) I Dimer 2 2 0 7.84 7.84 7.84 8 030 20 II Dimer 24 0 20 11.60 11.60 11.60 50 239 2000 III Dimer 24 797 817 11.60 11.60 11.60 50 239 2000 IV Dimer 1 3 0 6.52 6.32 11.92 15 929 --- V Hexamer 3 5 0 7.49 7.49 7.49 12 164 100
To mimic a neutral pH, histidine residues were singly protonated in the δ-nitrogen sites in all cases. In systems II and III, the structure of the insulin dimer was taken from the first two monomers of the T6 hexamer structure (PDB ID 1OS3) and 24 arginine molecules were randomly added using the antechamber utility of Amber33. The system was then explicitly solvated, before addition of the counterions (Na+ and Cl-). System IV was prepared by extracting a representative structure (protein with an arginine molecule bound to the Glu B13 binding site) from the trajectory of system II. This structure was subsequently solvated, and ions added as previously. In systems I and V, the protein structure together with the ligands were taken from the X-ray structures and the missing C-terminal threonine B30 residues were added using the antechamber utility.
All simulations were performed with the Gromacs 2016.4 software.36 The SPC/E model was used for water molecules.37 As the standard force fields are known to overestimate the interaction between ions and charged protein groups,38 we described the ions using the Electronic Continuum Correction (ECC).39–41 This is a mean field approach that implicitly accounts for the fast electronic polarization, absent in classical force fields, by a dielectric continuum. This approach is equivalent to scaling the ionic charges by the factor of (εel)⁻1/2, where εel is the fast electronic part of the dielectric constant of water (1.78). Previously developed ECC force fields were used for the Na+ (Ref.42) and Cl- (Ref.43) ions (see SI, Table S2). Consistently, the protein was described using an ECC, scaled charge version, of the AMBER99SB-ILDN force field.38,44 For comparison, we provide in the Supplementary Information the results obtained with the standard (full charge) force field, which lead to the same conclusions.
The systems were first equilibrated using the steepest descend method with a force tolerance threshold of 100 kJ mol⁻1 nm⁻1. The equilibration was continued by rising the temperature up to 300 K within a 100 ps long run in the NVT ensemble using a Berendsen
thermostat45 a time constant of 0.1 ps. This was followed by equilibration in the NpT ensemble for 100 ps using a Parinello-Rahman barostat46 (1 bar) with a 2 ps time constant. During this equilibration sequence, the backbone of the protein was constrained with harmonic restraints using a force constant of 100 kJ mol⁻1 nm⁻2 to retain its initial position for systems II and III. A similar approach was employed in the case of systems I and V, but the arginine and zinc ions (in system V) were additionally restrained using a harmonic force constant of 500 kJ‧mol⁻1‧nm⁻2 to preserve their binding mode during the equilibration procedure.The production runs were then carried out in the NpT ensemble as previously described and without any constraints on the protein (except for system V, were the zinc-histidine distance was restrained even during the production run). We used a 2 fs integration time step and the LINCS algorithm47 to constrain hydrogen-containing bonds. Long-range electrostatic interactions were accounted for by the Particle Mesh Ewald method48,49 with 9 Å cutoff.
Free energy calculations
Calculations of the binding free energy of arginine to the insulin dimer binding sites were performed using the umbrella sampling50 method. A starting configuration of the protein together with the ligand in the studied binding site was extracted from a previous MD simulation and solvated into a rectangular box prolonged in the z-direction (System IV). Starting configurations for the different umbrella sampling windows were generated by pulling the arginine into the bulk in the direction of the z vector using steered molecular dynamics51, with moving harmonic restraints on the arginine with a force constant of 150 kJ mol⁻1nm⁻2, and static harmonic restraints on the protein with a force constant of 150 kJ mol⁻1nm⁻2. The free energy profile along the distance between the center of mass (COM) of arginine and COM of the B13 glutamate carboxylic groups was obtained using 60 roughly equidistant windows distributed between 2 and 50 Å. The
windows between 2 and 10 Å were sampled for 100 ns. The rest of the windows was sampled for 20 ns. The simulation windows were combined and unbiased using the weighted histogram analysis method52 (WHAM) to yield a free energy profile along the distance coordinate, which was corrected by adding the standard entropic term RTln(4πr2).53
Results and Discussion
X-ray Crystallography
Crystallization conditions consisting of 0.6 M Na2SO4, 0.3 M Tris pH 8.2, 0.6 mM Zn Acetate, and 75-100 mM arginine yielded a typical insulin dimer crystal form (one insulin molecule/asymmetric unit), with each monomer of the dimer in a complex with one arginine residue. Although the electron density maps show some semi-continuous features on the surface of the dimer, only one Arg/monomer was modeled and refined (Figure 1). However, the initial electron density for this Arg ligand does not fully cover this amino acid, and refined 2wFo-DFc map is not entirely unambiguous, indicating its possible alternative conformation (Figure 2). Nevertheless, the arginine molecule is shown here in only one orientation that fits the most optimum network of ligand:insulin hydrogen bonds (Figure 2). Control crystallizations at pH > 7.5 without the arginine gave typical T3Rf3 hexamer insulin crystals. Crystallizations with arginine at pH 5.5, similar to the pH in the storage granules, gave also insulin T3Rf3 hexamers without any bound arginine.
Figure 1. Crystal structure of insulin dimer in complex with arginine. B- and A-chains are in
white and coral respectively; C-, N- and O-atoms in arginines are in green blue and red, respectively.
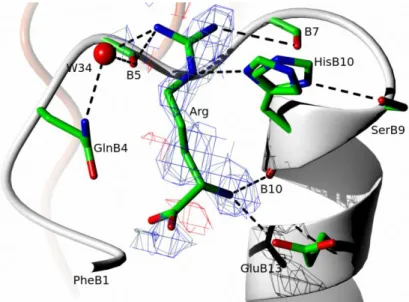
Figure 2. Network of H-bonds (dashed lines) at the arginine binding site. The 2wFo-DFc
electron density map in blue mesh is contoured at 1 level; chains/atoms color coding as in Figure 1. The side chain of HisB10 is modelled in two alternative conformation according to its corresponding electron density.
In the crystal dimer form at pH 8.2, arginine occupies a shallow insulin cavity between the T-state N-terminus of the B-chain and its B9-B19-helix, being involved in a network of hydrogen bonds (Figure 2, Figure 3). Here, the N atom of arginine is hydrogen bonded (2.37 Å) to N1
atom of HisB10, although a broader electron density of this side chain indicates its alternative conformations, and possible involvement in hydrogen bond (3.05 Å) with O of serine B9. The half-occupancies of the HisB10 side chain reflect likely the mobility of the ligand, which is also outlined by patchy, and partial in some places, electron density. The other arginine interaction that may impact assembly of insulin hexamer is between its free-NH3+ group and carboxyl moiety of GluB13. It appears, that the crystal-observed arginine:insulin binding results more from ligand-shape - hormone-surface fitting and hydrogen bond network that engage guanidine group of the arginine, rather than electrostatic surface attractions (Figure 3).
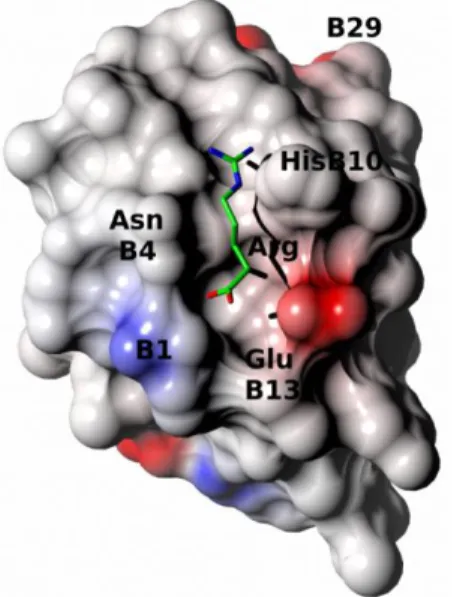
Figure 3. The arginine binding site at the insulin monomer electrostatic surface. Arginine
color coding and depiction as in Figure 1.
The arginine also seems to have some ‘natural affinity’ for insulin surface, as there is plenty of tubular, but low level, electron density network on this insulin dimer, which may indicate highly dynamic and weak multi-ligand:insulin associations. Such phenomenon has also been observed in insulin:spermine-like rich environment, which may contain many arginine molecules as well.23 HisB10 and its protonation state thus emerges as a potential key factor in arginine binding, as the
likely protonation of HisB10 N1 atom at pH 5.5 did not yield any crystalline arginine:insulin complexes.
Consequent investigations of the insulin – arginine interactions
MD simulations at low ionic strength. The atomistic details of arginine binding to the
insulin dimer were studied by low-ionic strength molecular dynamics simulations, starting from the Arg:insulin dimer crystal structure determined here by X-ray crystallography. Within 2 ns, the arginine ligands left their proposed crystallographic binding site and moved into the bulk solution (see Supplementary Information). This suggests that the crystal-observed binding site is not stable at the low ionic strength conditions of the simulation.
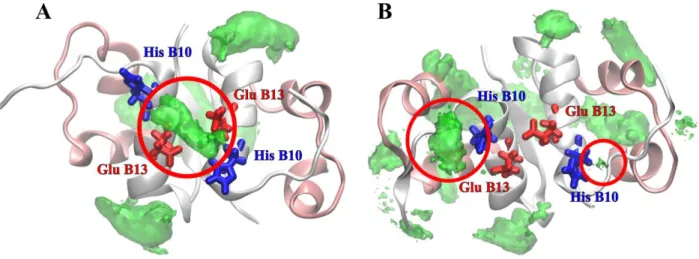
Possible arginine-insulin dimer interactions were investigated further by running MD simulations of the insulin dimer in the presence of arginine molecules in solution (See Methods, system II). Spatial distribution maps of arginine around the insulin dimer obtained from simulations performed at low ionic strength (system II) and at high ionic strength (system III) are depicted on panels A and B, respectively, in Figure 4. The binding sites discussed in the text are circled. The spatial distribution maps of arginine around the insulin dimer (Figure 4A) indicate that at low ionic strength, arginine molecules do not show any affinity to the crystallographic binding site. Rather, a high arginine density is found next to the pair of GluB13 side chains coming from each monomer (red circle in Figure 4A). Arginine also interacts with several negatively charged (glutamates A4, A17 and B21) or aromatic (phenylalanines B25) residues, but these interactions are unlikely to affect the insulin hexamerization process, as these residues are exposed on the surface of the hexamer.
Figure 4.Spatial distribution maps of arginine around the insulin dimer obtained from simulations performed at low ionic strength (system II) and at high ionic strength (system III) are depicted on panels A and B, respectively. In panel A, the arginine distribution at the B13 glutamate region is circled in red. The glutamate residues are colored red and the Zn2+ binding HisB10 are in blue. In panel B, the binding interaction in the GluB13 region is missing. However, the crystallographic binding sites (one for each monomer, circled in red) is captured here (compare with Figure 1). Chain color coding as in Figure 1.
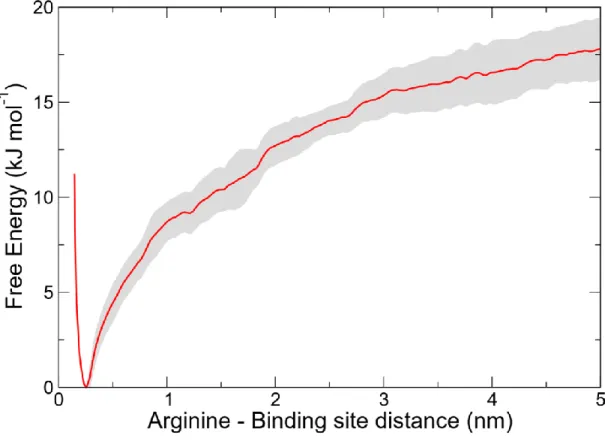
It seems then that GluB13 emerges as a residue that may impact hexamer formation. The general importance of GluB13 for hexamer stability is well known, as it occupies the central cavity, forming there a Ca2+ binding site consisting of six circularly arranged glutamate side chains contributed by each insulin monomer.54,55 We computed the free energy of arginine GluB13 pairing as G = −17.8±1.7 kJ mol−1 (Figure 5). To assess whether such binding mode could affect the hexamerization process, we compared it to the G change associated with the hexamerization. Previous ITC calorimetry measurements found the overall free energy change associated with the hexamerization process, i.e., bringing together three insulin dimers and binding of two Zn2+, to be around G= −109 kJ mol⁻1.56 For a putative hexamerization in the presence of arginine, three arginine molecules (one from each dimer) must be displaced, which would correspond to a 55 kJ mol−1 free energy cost, which is small enough to maintain the overall negative G of the
hexamerization in presence of arginine. Therefore, the arginine – GluB13 interaction does not appear to be strong enough to prevent the formation of insulin hexamers.
Figure 5. Free energy profile for the arginine binding to B13 glutamate pair.
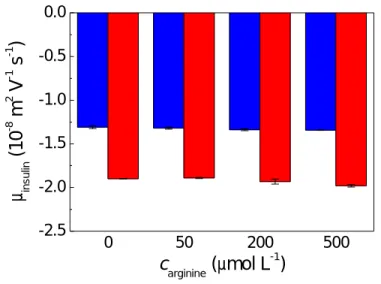
Capillary electrophoresis experiments. The effect of arginine on the hexamerization
process was investigated further by capillary electrophoresis, performed at low ~ 5.5 mM ionic strength. We have shown in a previous study38that the formation of insulin hexamers upon addition ofn gives rise to a very characteristic increase - in absolute value - of insulin electrophoretic mobility. Analogous experiments were thus repeated here in the presence of arginine and the same trend in the insulin mobility increase was observed. The magnitude of the change in the electrophoretic mobility remains constant over a wide spectrum of arginine concentrations (Figure
6). Hence, these results agree with the MD simulations, and suggest that arginine does not inhibit
insulin hexamerization at low ionic strength.
.
Figure 6. Electrophoretic mobilities of insulin (cins = 8.6 μmol L−1) in the absence (blue) and
presence (red) of 20 μmol L−1 zinc nitrate measured at varying arginine concentrations.
MD simulations at high ionic strength. There is a seeming discrepancy between the high
ionic strength crystallographic experiments, which suggest that arginine binding to the insulin dimer prevents the formation of the hormone hexamer on the one side, and the low ionic strength electrophoresis and MD simulations on the other side, which find the experimental binding site to be unstable and suggest that the insulin-arginine interaction is not strong enough to inhibit hexamerization. To further investigate the cause of these apparent differences, we performed MD simulations at high ionic strength (see Methods, system III), chosen to mimic the conditions employed in the crystallographic experiments. In contrast to the previous MD simulations performed at low ionic strength, the obtained spatial distribution map (Figure 4B) now shows significant binding of arginine to the site located in the B1-B8 loop (red circles in Figure 4B), with specific hydrogen bonding to the backbone carbonyl oxygen atom of HisB5, hydrogen
0 50 200 500 -2.5 -2.0 -1.5 -1.0 -0.5 0.0 m ins u lin ( 1 0 -8 m 2 V -1 s -1 ) carginine (mmol L-1)
bonding of the α-amino group of the arginine to the GluB13 residue, and additional π-π stacking interaction with the HisB10. This reflects the arginine binding mode identified in the crystallographic experiments (see Figure 2). In addition, the obtained trajectory shows high mobility of the arginine molecule in the binding site, that confirms poor electron density for this ligand in the crystal structure. These simulations revealed also other less specific, and short-lived, binding interactions such as hydrogen bonding of the arginine guanidinium group to the HisB10/HisB5 imidazole rings, and arginine – histidine stacking interactions.
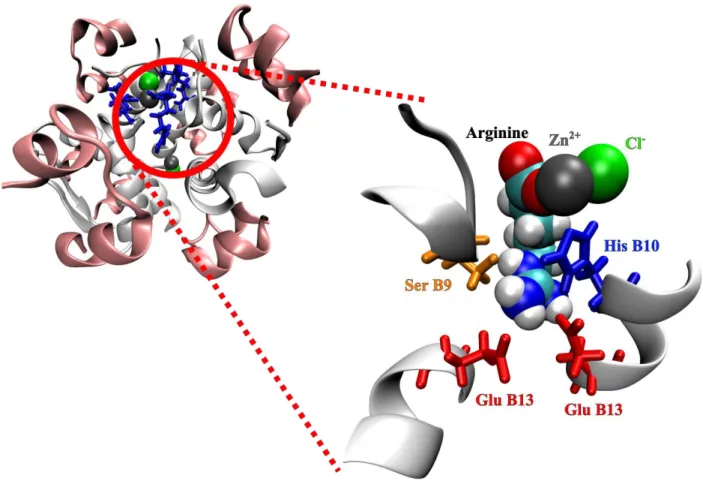
MD simulations of arginine binding to the insulin hexamer. Since MD simulations as
well as capillary electrophoresis and previous crystallographic experiments21 indicated that insulin hexamerization appears to be possible in the presence of arginine at least at low ionic strength, we also probed the arginine binding to the insulin hexamer using MD simulations. Firstly, we assessed the stability of the crystallographic binding site for arginine in a T3Rf3 hexamer:serotonin:arginine complex.21 When simulations of the insulin hexamer at low ionic strength were started with arginine in its experimental binding site (Methods, system V),the arginine molecule remained in the crystallographic binding sites for the entire course of the 20 ns simulations (see Supplementary Information). Arginine binds to a rather specific cavity at the surface of the hexamer, which is created by several amino acid side-chains (Figure 7). Its bottom is formed by the B13 glutamate pair, to which the arginine binds via its positively charged guanidinium group. The guanidinium position is further stabilized by a π-π stacking interaction with the B10 histidine and a hydrogen bonding to the B9 serine oxygen atom. On top of this, the carboxylate group of the arginine is coordinating the zinc ion cofactor of the hexamer. Therefore this arginine binding mode
corresponds to the starting crystallographic structure,21 since the structure remained stable, and did not evolve significantly during the course of the simulation.
Figure 7. Snapshot from MD simulations showing arginine bound to the insulin hexamer. The
binding is mediated through the existence of a cavity (zoom in) cornered by the Ser B9 (orange), His B10 (blue) and Glu B13 (red) residues and the Zn2+ cofactor (gray) at the top.
Conclusions
The possible scenario of arginine-insulin binding that emerges from our crystallographic, MD simulation, and capillary electrophoresis studies can be summarized as follows: (i) At high – ~molar – ionic strength there is good agreement between arginine binding observed in the MD simulations and the crystal structure. Here, arginine binds to the insulin dimer at the shallow site
located in the B1-B8 loop, with specific hydrogen bonding interactions with HisB5, GluB13, and additional interactions with HisB10. (ii) At low – milimolar – ionic strength arginine binds to the insulin dimer at a different site than at the high ionic strength. While binding to GluB13 side chains could, in principle, interfere with insulin-insulin interactions, simulations and electrophoretic measurements indicate that it is not strong enough to prevent insulin hexamerization. (iii) Arginine can bind rather stably to the hexamer on its own, even in the absence of serotonine, in a mode observed in the arginine-serotonin-hexamer complex. (iv) Although the exact conditions in the storage granules in the -cells are not known, the ionic strength may be as high as 0.25-1.0 M.2 Hence our experiments and simulations performed at the high salt conditions may closely reflect the in vivo molecular situation. (v) Insulin granule concentration is estimated to be at ~15 mM2,57 and the pro-insulin cleavage generated arginine may reach 50 mM. This implies that the higher ionic strength may promote arginine:insulin binding at physiologically relevant conditions.
In summary, our findings expand the possible in vivo patterns of insulin oligomerization and storage, being also relevant for the understanding of insulin stability in arginine-rich injections. They also indicate that the quantitative understanding of the in vivo effects of putative insulin allosteric ligands, such as arginine, on aggregation of the hormone need to be scrutinized in detail in granule-mimicking physico-chemical environment.
Acknowledgment
PJ and JJ acknowledge support from the European Regional Development Fund OP RDE (project ChemBioDrug no. CZ.02.1.01/0.0/0.0/16_019/0000729). EDD acknowledges support from the
EMBO and Marie Curie Actions (fellowship ALTF 952-2015). AMB, TRG, CMV work was supported by the Medical Research Council (Grant MR/K000179/1 and MR/R009066/1 to AMB). The project was also supported by the Academy of Sciences of the Czech Republic (Research Project RVO:6138963, support to the Institute of Organic Chemistry and Biochemistry).
References
(1) Cohen, P. The Twentieth Century Struggle to Decipher Insulin Signalling. Nat. Rev. Mol. Cell Biol. 2006, 7, 867–873.
(2) Foster, M. C.; Leapman, R. D.; Li, M. X.; Atwater, I. Elemental Composition of Secretory Granules in Pancreatic Islets of Langerhans. Biophys. J. 1993, 64, 525–532.
(3) Dodson, G.; Steiner, D. The Role of Assembly in Insulin’s Biosynthesis. Curr. Opin. Struct. Biol. 1998, 8, 189–194.
(4) Emdin, S. O.; Dodson, G. G.; Cutfield, J. M.; Cutfield, S. M. Role of Zinc in Insulin Biosynthesis. Some Possible Zinc-Insulin Interactions in the Pancreatic B-Cell. Diabetologia 1980, 19, 174–182.
(5) Kemmler, W.; Steiner, D. F.; Borg, J. Studies on the Conversion of Proinsulin to Insulin. 3. Studies in Vitro with a Crude Secretion Granule Fraction Isolated from Rat Islets of Langerhans. J. Biol. Chem. 1973, 248, 4544–4551.
(6) Carroll, R. J.; Hammer, R. E.; Chan, S. J.; Swift, H. H.; Rubenstein, A. H.; Steiner, D. F. A Mutant Human Proinsulin Is Secreted from Islets of Langerhans in Increased Amounts via an Unregulated Pathway. Proc. Natl. Acad. Sci. U. S. A. 1988, 85, 8943–8947.
from Rat Islets of Langerhans. II. Ultrastructure of the Beta Granule. J. Cell Biol. 1969, 41, 162–166.
(8) Dodson, E. J.; Dodson, G. G.; Hodgkin, D. C.; Reynolds, C. D. Structural Relationships in the Two-Zinc Insulin Hexamer. Can. J. Biochem. 1979, 57, 469–479.
(9) Dunn, M. F. Zinc–Ligand Interactions Modulate Assembly and Stability of the Insulin Hexamer – A Review. BioMetals 2005, 18, 295–303.
(10) Weiss, M. A. Proinsulin and the Genetics of Diabetes Mellitus. J. Biol. Chem. 2009, 284, 19159–19163.
(11) Landreh, M.; Alvelius, G.; Johansson, J.; Jörnvall, H. Insulin, Islet Amyloid Polypeptide and C-Peptide Interactions Evaluated by Mass Spectrometric Analysis. Rapid Commun. Mass Spectrom. 2014, 28, 178–184.
(12) Huang, K.; Dong, J.; Phillips, N. B.; Carey, P. R.; Weiss, M. A. Proinsulin Is Refractory to Protein Fibrillation: Topological Protection of a Precursor Protein from Cross-Beta Assembly. J. Biol. Chem. 2005, 280, 42345–42355.
(13) Lord, R. S.; Gubensek, F.; Rupley, J. A. Insulin Self-Association. Spectrum Changes and Thermodynamics. Biochemistry 1973, 12, 4385–4392.
(14) Zhang, Y.; Whittingham, J. L.; Turkenburg, J. P.; Dodson, E. J.; Brange, J.; Dodson, G. G. Crystallization and Preliminary Crystallographic Investigation of a Low-PH Native Insulin Monomer with Flexible Behaviour. Acta Crystallogr. Sect. D Biol. Crystallogr. 2002, 58, 186–187.
(15) Brange, J.; Dodson, G. G.; Edwards, D. J.; Holden, P. H.; Whittingham, J. L. A Model of Insulin Fibrils Derived from the X-Ray Crystal Structure of a Monomeric Insulin (Despentapeptide Insulin). Proteins Struct. Funct. Genet. 1997, 27, 507–516.
(16) Jiráček, J.; Žáková, L.; Antolíková, E.; Watson, C. J.; Turkenburg, J. P.; Dodson, G. G.; Brzozowski, A. M. Implications for the Active Form of Human Insulin Based on the Structural Convergence of Highly Active Hormone Analogues. Proc. Natl. Acad. Sci. U. S. A. 2010, 107, 1966–1970.
(17) Kaarsholm, N. C.; Ko, H. C.; Dunn, M. F. Comparison of Solution Structural Flexibility and Zinc Binding Domains for Insulin, Proinsulin, and Miniproinsulin. Biochemistry 1989, 28, 4427–4435.
(18) Brader, M. L.; Dunn, M. F. Insulin Hexamers: New Conformations and Applications. Trends Biochem. Sci. 1991, 16, 341–345.
(19) Rahuel-Clermont, S.; C. A. French; Kaarsholm, N. C.; Dunn, M. F. Mechanisms of Stabilization of the Insulin Hexamer through Allosteric Ligand Interactions. Biochemistry
1997, 36, 5837–5845.
(20) Berchtold, H.; Hilgenfeld, R. Binding of Phenol to R6 Insulin Hexamers. Biopolymers 1999, 51, 165–172.
(21) Palivec, V.; Viola, C. M.; Kozak, M.; Ganderton, T. R.; Křížková, K.; Turkenburg, J. P.; Halušková, P.; Žáková, L.; Jiráček, J.; Jungwirth, P.; et al. Computational and Structural Evidence for Neurotransmitter-Mediated Modulation of the Oligomeric States of Human Insulin in Storage Granules. J. Biol. Chem. 2017, 292, 8342–8355.
(22) Davidson, H. W. (Pro)Insulin Processing. Cell Biochem. Biophys. 2004, 40, 143–157. (23) Norrman, M.; Hubálek, F.; Schluckebier, G. Structural Characterization of Insulin NPH
Formulations. Eur. J. Pharm. Sci. 2007, 30, 414–423.
(24) Hagedorn, H. C.; Jensen, B. N.; Krarup, N. B.; Wodstrup, I. Protamine Insulinate. J. Am. Med. Assoc. 1936, 106, 177.
(25) Leiss, V.; Flockerzie, K.; Novakovic, A.; Rath, M.; Schönsiegel, A.; Birnbaumer, L.; Schürmann, A.; Harteneck, C.; Nürnberg, B. Insulin Secretion Stimulated by l -Arginine and Its Metabolite l -Ornithine Depends on Gα I2. Am. J. Physiol. Metab. 2014, 307, E800– E812.
(26) Thams, P.; Capito, K. L-Arginine Stimulation of Glucose-Induced Insulin Secretion through Membrane Depolarization and Independent of Nitric Oxide. Eur. J. Endocrinol. 1999, 140, 87–93.
(27) Winter, G. Xia2: An Expert System for Macromolecular Crystallography Data Reduction. J. Appl. Crystallogr. 2010, 43, 186–190.
(28) Storoni, L. C.; McCoy, A. J.; Read, R. J. Likelihood-Enhanced Fast Rotation Functions. Acta Crystallogr. Sect. D Biol. Crystallogr. 2004, 60, 432–438.
(29) Vagin, A.; Teplyakov, A. Molecular Replacement with MOLREP. Acta Crystallogr. Sect. D Biol. Crystallogr. 2010, 66, 22–25.
(30) Emsley, P.; Cowtan, K. Coot: Model-Building Tools for Molecular Graphics. Acta Crystallogr. Sect. D Biol. Crystallogr. 2004, 60, 2126–2132.
(31) Collaborative Computational Project, N. 4. The CCP4 Suite: Programs for Protein Crystallography. Acta Crystallogr. Sect. D Biol. Crystallogr. 1994, 50, 760–763.
(32) McNicholas, S.; Potterton, E.; Wilson, K. S.; Noble, M. E. M. Presenting Your Structures: The CCP4mg Molecular-Graphics Software. Acta Crystallogr. Sect. D Biol. Crystallogr.
2011, 67, 386–394.
(33) Case, D. A.; Cheatham, T. E.; Darden, T.; Gohlke, H.; Luo, R.; Merz, K. M.; Onufriev, A.; Simmerling, C.; Wang, B.; Woods, R. J. The Amber Biomolecular Simulation Programs. J. Comput. Chem. 2005, 26, 1668–1688.
(34) Frisch; Trucks, G.; Schlegel, H.; Scuseria, G.; Robb, M.; Cheeseman, J.; Scalmani, G.; Barone, V.; Mennucci, B.; Petersson, G.; et al. Gaussian 09, Revision B.01. Gaussian 09, Revis. B.01, Gaussian, Inc., Wallingford CT 2009.
(35) Burger, S. K.; Schofield, J.; Ayers, P. W. Quantum Mechanics/Molecular Mechanics Restrained Electrostatic Potential Fitting. J. Phys. Chem. B 2013, 117, 14960–14966. (36) Abraham, M. J.; Murtola, T.; Schulz, R.; Páll, S.; Smith, J. C.; Hess, B.; Lindahl, E.
GROMACS: High Performance Molecular Simulations through Multi-Level Parallelism from Laptops to Supercomputers. SoftwareX 2015, 1, 19–25.
(37) Berendsen, H. J. C.; Grigera, J. R.; Straatsma, T. P. The Missing Term in Effective Pair Potentials. J. Phys. Chem. 1987, 91, 6269–6271.
(38) Duboué-Dijon, E.; Delcroix, P.; Martinez-Seara, H.; Hladílková, J.; Coufal, P.; Křížek, T.; Jungwirth, P. Binding of Divalent Cations to Insulin: Capillary Electrophoresis and Molecular Simulations. J. Phys. Chem. B 2018, doi: 10.1021/acs.jpcb.7b12097.
(39) Leontyev, I.; Stuchebrukhov, A. Polarizable Mean-Field Model of Water for Biological Simulations with AMBER and CHARMM Force Fields. J. Chem. Theory Comput. 2012, 8, 3207–3216.
(40) Leontyev, I.; Stuchebrukhov, A. Polarizable Molecular Interactions in Condensed Phase and Their Equivalent Nonpolarizable Models. J. Chem. Phys. 2014, 141, 014103.
(41) Leontyev, I.; Stuchebrukhov, A. Accounting for Electronic Polarization in Non-Polarizable Force Fields. Phys. Chem. Chem. Phys. 2011, 13, 2613–2626.
(42) Dang, L. X.; Rice, J. E.; Caldwell, J.; Kollman, P. A. Ion Solvation in Polarizable Water: Molecular Dynamics Simulations. J. Am. Chem. Soc. 1991, 113, 2481–2486.
Concentrated Aqueous Solutions Using Neutron Scattering and Molecular Dynamics. Mol. Phys. 2014, 112, 1230–1240.
(44) Lindorff-Larsen, K.; Piana, S.; Palmo, K.; Maragakis, P.; Klepeis, J. L.; Dror, R. O.; Shaw, D. E. Improved Side-Chain Torsion Potentials for the Amber FF99SB Protein Force Field. Proteins Struct. Funct. Bioinforma. 2010, 78, 1950–1958.
(45) Berendsen, H. J. C.; Postma, J. P. M.; van Gunsteren, W. F.; DiNola, A.; Haak, J. R. Molecular Dynamics with Coupling to an External Bath. J. Chem. Phys. 1984, 81, 3684– 3690.
(46) Parrinello, M.; Rahman, A. Polymorphic Transitions in Single Crystals: A New Molecular Dynamics Method. J. Appl. Phys. 1981, 52, 7182–7190.
(47) Hess, B.; Bekker, H.; Berendsen, H. J. C.; Fraaije, J. G. E. M. LINCS: A Linear Constraint Solver for Molecular Simulations. J. Comput. Chem. 1997, 18, 1463–1472.
(48) Ewald, P. P. Die Berechnung Optischer Und Elektrostatischer Gitterpotentiale. Ann. Phys.
1921, 369, 253–287.
(49) Essmann, U.; Perera, L.; Berkowitz, M. L.; Darden, T.; Lee, H.; Pedersen, L. G. A Smooth Particle Mesh Ewald Method. J. Chem. Phys. 1995, 103, 8577–8593.
(50) Torrie, G. M.; Valleau, J. P. Nonphysical Sampling Distributions in Monte Carlo Free-Energy Estimation: Umbrella Sampling. J. Comput. Phys. 1977, 23, 187–199.
(51) Izrailev, S.; Stepaniants, S.; Isralewitz, B.; Kosztin, D.; Lu, H.; Molnar, F.; Wriggers, W.; Schulten, K. Steered Molecular Dynamics; Springer, Berlin, Heidelberg, 1999; pp 39–65. (52) Kumar, S.; Rosenberg, J. M.; Bouzida, D.; Swendsen, R. H.; Kollman, P. A.
Multidimensional Free-Energy Calculations Using the Weighted Histogram Analysis Method. J. Comput. Chem. 1995, 16, 1339–1350.
(53) Pohorille, A.; Chipot, C. Free Energy Calculations : Theory and Applications in Chemistry and Biology; Springer, 2007.
(54) Coffman, F. D.; Dunn, M. F. Insulin-Metal Ion Interactions: The Binding of Divalent Cations to Insulin Hexamers and Tetramers and the Assembly of Insulin Hexamers. Biochemistry 1988, 27, 6179–6187.
(55) Palmieri, R.; Lee, R. W. K.; Dunn, M. F. Proton Fourier Transform NMR Studies of Insulin: Coordination of Calcium to the Glu(B13) Site Drives Hexamer Assembly and Induces a Conformation Change. Biochemistry 1988, 27, 3387–3397.
(56) Carpenter, M. C.; Wilcox, D. E. Thermodynamics of Formation of the Insulin Hexamer: Metal-Stabilized Proton-Coupled Assembly of Quaternary Structure. Biochemistry 2014, 53, 1296–1301.
(57) Suckale, J.; Solimena, M. The Insulin Secretory Granule as a Signaling Hub. Trends Endocrinol. Metab. 2010, 21, 599–609.