Publisher’s version / Version de l'éditeur:
Vous avez des questions? Nous pouvons vous aider. Pour communiquer directement avec un auteur, consultez la première page de la revue dans laquelle son article a été publié afin de trouver ses coordonnées. Si vous n’arrivez Questions? Contact the NRC Publications Archive team at
PublicationsArchive-ArchivesPublications@nrc-cnrc.gc.ca. If you wish to email the authors directly, please see the first page of the publication for their contact information.
https://publications-cnrc.canada.ca/fra/droits
L’accès à ce site Web et l’utilisation de son contenu sont assujettis aux conditions présentées dans le site LISEZ CES CONDITIONS ATTENTIVEMENT AVANT D’UTILISER CE SITE WEB.
Technical Report; no. TR-2011-18, 2011-12
READ THESE TERMS AND CONDITIONS CAREFULLY BEFORE USING THIS WEBSITE.
https://nrc-publications.canada.ca/eng/copyright
NRC Publications Archive Record / Notice des Archives des publications du CNRC :
https://nrc-publications.canada.ca/eng/view/object/?id=a7704f16-1fee-4249-8a99-2c81ecbf5235 https://publications-cnrc.canada.ca/fra/voir/objet/?id=a7704f16-1fee-4249-8a99-2c81ecbf5235
NRC Publications Archive
Archives des publications du CNRC
For the publisher’s version, please access the DOI link below./ Pour consulter la version de l’éditeur, utilisez le lien DOI ci-dessous.
https://doi.org/10.4224/19547520
Access and use of this website and the material on it are subject to the Terms and Conditions set forth at Effect of simulated training upon the performance of ice field navigation in a lifeboat (Phase 2)
Baker, Andrew; Power-Macdonald, Stephanie; Simões Ré, António.; Power, Jonathan; MacKinnon, Scott
DOCUMENTATION PAGE REPORT NUMBER
TR-2011-18
NRC REPORT NUMBER DATE
December 2011 REPORT SECURITY CLASSIFICATION
Unclassified
DISTRIBUTION Unlimited TITLE
Effect of Simulated Training Upon the Performance of Ice Field Navigation in a Lifeboat (Phase 2)
AUTHOR(S)
Andrew Baker1, 2, Stephanie Power-MacDonald1, António Simões Ré1, Jonathan Power1, and Scott MacKinnon2
CORPORATE AUTHOR(S) / PERFORMING AGENCY(S)
1
National Research Council Canada – Institute for Ocean Technology, St. John’s, NL,
2
Memorial University of Newfoundland, St. John’s, NL, Canada PUBLICATION
SPONSORING AGENCY(S) Transport Canada IOT PROJECT NUMBER 42_2438_16
NRC FILE NUMBER KEY WORDS
Simulation, training, TEMPSC, lifeboat, ice, navigation
PAGES xiii, 33, App. 1-17 FIGS. 18 TABLES 18 SUMMARY
This report describes a systematic study aimed at establishing the validation and accreditation of small craft simulator training as pertaining to Totally Enclosed Motor Propelled Survival Craft (TEMPSC) operation in ice. In other words, the study sets out to examine whether simulation based training can be adopted as a valid and reliable surrogate for standard physical lifeboat training.
Full-scale field trials were conducted using a TEMPSC in an ice field at Paddy’s Pond, Newfoundland and Labrador. The objective of the study was to evaluate navigation through the ice field based on variables such as time through course, number of impacts, and nozzle executions. Naïve participants were assigned to groups: group one completed physical training in the classroom and in the TEMPSC in calm water (Standards of Training, Certification, and Watchkeeping, STCW), group two completed the same STCW training complemented by a classroom briefing on ice navigation, and group three completed the classroom briefing on ice navigation along with simulator training (full mission class “S” training simulator). Through a comparison of these groups it was hoped that the simulator-trained participants would perform just as well, or better, than those who underwent the physical training in terms of effectiveness and proficiency in ice field navigation.
Overall, the results of this study suggest that simulator-trained participants were more likely to successfully navigate the TEMPSC through the ice field from waypoint to waypoint in comparison to those who received standard STCW training or the STCW training complemented by an ice briefing. Due to a small sample size, relatively large amounts of variance, and frequently changing environmental conditions, significant differences between the groups may have been masked. As such, further research may be required to conclusively validate small craft simulation training for operation in ice-covered waters.
ADDRESS National Research Council Canada - Institute for Ocean Technology Arctic Avenue, P. O. Box 12093, St. John's, NL, A1B 3T5
National Research Council Conseil national de recherches Canada Canada Institute for Ocean Institut des technologies
Technology océaniques
Effect of Simulated Training Upon the Performance of Ice Field
Navigation in a Lifeboat (Phase 2)
TR-2011-18 Andrew Baker Stephanie Power-MacDonald António Simões Ré Jonathan Power Scott MacKinnon December 2011
ACKNOWLEDGEMENTS
The financial support to the research program by Transport Canada is acknowledged with gratitude.
The authors would like to thank the people at NRC-IOT who contributed to the planning and development of the project, the instrumentation of the lifeboat, as well as the preparation and execution of the field program. Also, we would like to thank our colleagues at Memorial University of Newfoundland (MUN), Virtual Marine Technology, Inc. (VMT), the Marine Institute of Memorial University Offshore Safety and Survival Centre (OSSC), and the Canadian Power and Sail Squadron for their help in the planning and implementation of the project. Lastly, special thanks are offered to those who volunteered their time to participate in the study.
EXECUTIVE SUMMARY
This report describes the second phase of a systematic study aimed at validating and accrediting small craft simulator training as used to provide practical experience piloting Totally Enclosed Motor Propelled Survival Craft (TEMPSC) through ice fields (Phase 1 is detailed by Power-MacDonald et al., 2011). The experiment was designed to examine whether simulation based training can be adopted as a valid and reliable surrogate for standard physical lifeboat training. Both external and internal variables were monitored and collected in order to assess navigational effectiveness and proficiency.
Full-scale field trials were conducted in March 2011 at Paddy’s Pond, Newfoundland and Labrador using a commercially available TEMPSC built in accordance with the regulations put forth by the International Maritime Organization - Safety of Life at Sea (IMO-SOLAS), and later retrofitted as a research craft by NRC-IOT staff. An ice field was created on a frozen fresh water lake by cutting a 70mx50m perimeter into the ice and removing roughly 6/10ths of the ice, leaving an ice concentration of roughly 4/10ths within the test field. During field preparation, the ice was measured to have an average thickness of 12cm of true ice and 31cm of snow ice, with an internal temperature of 0.2°C. As the testing took place over five days, weather conditions were somewhat variable. The average recorded air temperature across the trial days was 0.5°C (range of –3°C to +3°C), and the average recorded wind speed was 27 km/h (min 25km/h, max 31km/h). The perimeter of the ice field was expanded to include marked gates (roughly 3mx6m) located on the north, south, east and west sides (one per side), with the southern gate leading to an entrance/exit channel and eventually a loading dock. The trials were designed to have participants execute various perimeter (clockwise and counter-clockwise), turning (port and starboard side), and unidirectional runs through the course while attempting to navigate through the ice field and move from one gate to the next.
The objective of the study was to provide justification for the validation and accreditation of simulator training as pertaining to novice operation of a TEMPSC in ice. The study involved 18 participants, and was designed to have three participant groups. Prior to testing, group one underwent the Standards of Training, Certification, and Watchkeeping (STCW, a classroom session along with physical lifeboat operation in calm waters), group two completed the same STCW training along with a classroom session on ice navigation, and group three completed the classroom session on ice navigation as well as simulator training using a davit launch full mission class “S” training simulator, approved by Det Norske Veritas and in fulfillment of the STCW Chapter 2 requirements for compliance and competency. The research team postulated that if the group three participants were able to perform as well, or better, than the other two groups, the data would serve to support the validation and accreditation of the simulator training as pertaining to TEMPSC navigation in ice. Operational proficiency and confidence were assessed using numerous performance, physiological, and psychological measures.
There was a clear trend indicating that participants who received their training through simulation were more likely to successfully navigate the TEMPSC from gate to gate;
however, the small dataset made it difficult to determine which of the performance, physiological, and/or psychometric variables were the strongest contributing factors. Looking at the physiological data, there was a significant correlation between time in course and heart rate (r = .533, p < .05), and a relatively strong correlation between path length and heart rate (r = .485, p < .10). These correlations reflect the fact that longer path lengths and trial times were typically the result of more frequent impacts, steering nozzle executions, and difficulties manoeuvring through portions of the course with higher concentrations of ice due to the effects of the wind. Psychometric measures, in the form of an exit questionnaire, showed there was a clear and consistent reporting across all three groups of issues related to the ergonomics of the TEMPSC, as well as the training durations and previous ice field navigational experience. The majority of the feedback highlighted concerns regarding visibility through the bow, starboard, and portside windows, as well as the position and response of the steering wheel. The second common issue was that training durations were seen as being too short, and that previous physical experience manoeuvring through ice would have been beneficial. It is possible that these general TEMPSC design and training issues contributed to the lack of obvious differences between groups seen across many of the performance variables. It was apparent that Group 1 perceived their STCW training to be the most effective, and that Group 3 had the highest perceived proficiency during the ice field testing. Also Group 1 and Group 2 have the highest levels of confidence in their abilities to navigate the TEMPSC through ice-covered waters in the future; however, this could be interpreted as implying that Group 3 may have a more realistic understanding as to the limits increased ice concentrations may have on TEMPSC operations.
A small sample size, relatively large amounts of variance, and continuously changing environmental conditions might have masked significant differences that may exist between the groups. Increasing the number of participants would serve to increase the statistical power and significance of the data, and therefore increase the confidence with which conclusions may be drawn. Further research should be conducted to conclusively validate small craft simulator training as pertaining to TEMPSC operation in ice. This research could be based on the work developed and implemented by NRC-IOT, as both Phase 1 and 2 have successfully established a proof of concept highlighting the benefits of simulation training for small craft operations in ice-covered waters.
TABLE OF CONTENTS PAGE ACKNOWLEDGEMENTS... III EXECUTIVE SUMMARY ... V APPENDICES ... IX LIST OF TABLES ... X LIST OF FIGURES... XI GLOSSARY ... XII 1.0 INTRODUCTION ... 1 2.0 PROJECT OBJECTIVES ... 2
3.0 RECRUITMENT AND TRAINING ... 2
3.1 Phase One Training ... 3
3.1.1 Standard Training, Certification And Watchkeeping (STCW) ... 4
3.1.2 Ice Briefing ... 4
3.1.3 Simulator Training ... 4
4.0 TEST PLAN... 6
5.0 INSTRUMENTATION AND PROTOCOL ... 10
5.1 TEMPSC Instrumentation ... 10
5.2 Participant Instrumentation ... 12
5.3 Protocol... 13
6.0 DATA ACQUISITION ... 13
6.1 Performance Measures... 13
6.1.1 Pass / Fail Determination ... 14
6.2 Heart Rate Measures... 15
6.3 Psychometric Measures... 15
6.4 Data Organization ... 16
6.5 Statistical Analysis ... 16
7.1 Performance Measures... 17
7.1.1 Path Length... 17
7.1.2 Time In Course... 17
7.1.3 Impact Data... 18
7.1.4 Nozzle Executions... 19
7.1.5 Pass / Fail Data... 19
7.2 Heart Rate Measures... 20
7.3 Psychometric Measures... 21
8.0 DISCUSSION ... 22
8.1 Performance Measures... 22
8.2 Heart Rate Measures... 28
8.3 Psychometric Measures... 29
8.4 Limitations... 30
9.0 CONCLUSION ... 30
10.0 RECOMMENDATIONS ... 31
APPENDICES APPENDIX 1 RECRUITMENT POSTER APPENDIX 2 CONSENT FORM
APPENDIX 3 STCW TRAINING NOTES APPENDIX 4 ICE BRIEFING NOTES
APPENDIX 5 VMT SIMULATOR TECHNOLOGY APPENDIX 6 FIELD TRIALS SET-UP DIAGRAM APPENDIX 7 CALIBRATION FILES
APPENDIX 8 EXIT QUESTIONNAIRE
APPENDIX 9 VIDEO LOG
APPENDIX 10 SELECT PHOTOGRAPHS
APPENDIX 11A RUN PLOTS (PARTICIPANTS 1-5) APPENDIX 11B RUN PLOTS (PARTICIPANTS 8-12) APPENDIX 11C RUN PLOTS (PARTICIPANTS 14-18) APPENDIX 11D RUN PLOTS (PARTICIPANTS 19-21) APPENDIX 12 PERFORMANCE MEASURES DATASET APPENDIX 13 PERFORMANCE MEASURES ANOVA
APPENDIX 14 PERFORMANCE MEASURES CORRELATIONS APPENDIX 15 HEART RATE MEASURES DATASET
APPENDIX 16 HEART RATE CORRELATIONS
LIST OF TABLES Table 3.1: Participant anthropometric data.
Table 3.2: An overview of group and training assignments.
Table 4.1: Environmental conditions during testing at Paddy’s Pond, NL. Table 6.1: Overview of TEMPSC operational performance variables.
Table 7.1: Number of participants included in analysis after Day 5 data was excluded. Table 7.2: Mean (standard deviation, SD) path length.
Table 7.3: Mean (SD) time in course. Table 7.4: Mean (SD) number of impacts.
Table 7.5: Mean (SD) severity of all global impacts.
Table 7.6: Mean (SD) severity of maximum global impacts. Table 7.7: Mean (SD) nozzle executions.
Table 7.8: Pass/Fail data by group.
Table 7.9: Mean (SD) baseline and trials heart rate (HR) data by group. Table 7.10: Performance and heart rate measure correlations.
Table 7.11: Frequency table of categorized responses to exit questionnaire Question 1 (What were the challenges you faced during testing?)
Table 7.12: Frequency table of categorized responses to exit questionnaire Question 2 (What would better prepare you to face these challenges?)
Table 7.13: Frequency table of categorized responses to exit questionnaire Question 3 (What would help prepare you better for the ice trials?)
LIST OF FIGURES Figure 3.1: STCW training in St. John’s harbour, NL.
Figure 3.2: Full mission class “S” training simulator, showing a sample classroom setup (left) and a partial view of the interior (right).
Figure 3.3: Training simulator and operator’s station.
Figure 4.1: Paddy’s Pond, NL (47°28’39.96”N, 52°53’17.46”W). Figure 4.2: A template of the ice field layout.
Figure 4.3: The TEMPSC and ice field prior to the commencement of testing. Figure 4.4: Runs A-F of the experimental protocol.
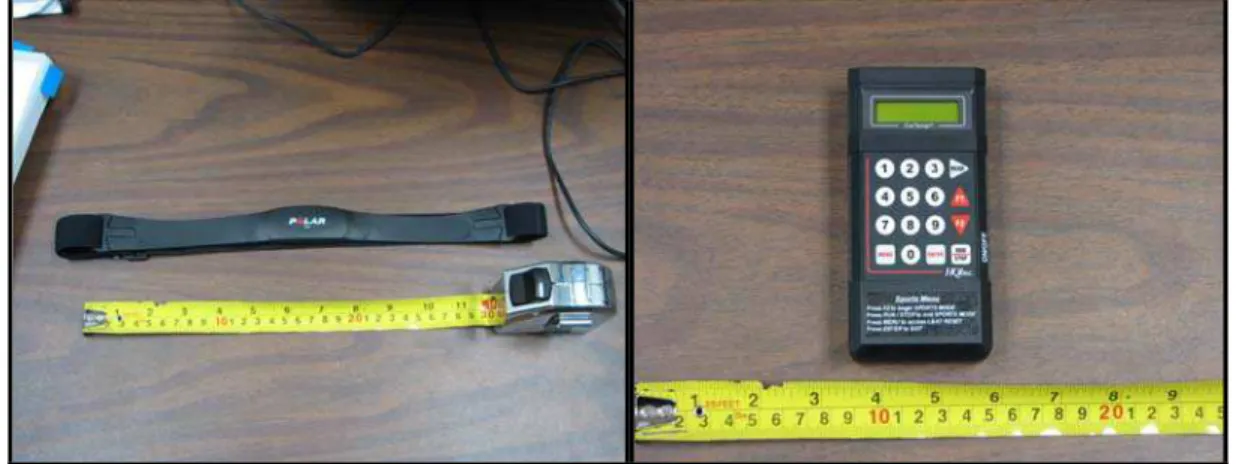
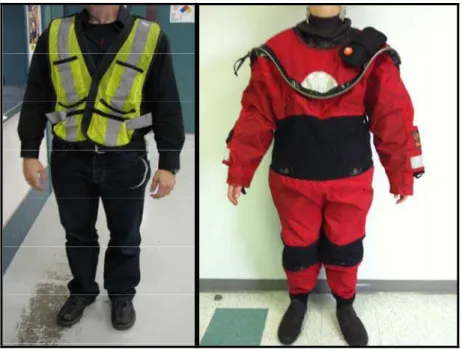
Figure 5.1: An interior view of the on-shore data logging and monitoring trailer. Figure 5.2: PolarTM heart rate monitor (left), and CorTempTM data recorder (right). Figure 5.3: Data logger vest (left), and White’sTM marine abandonment suit (right). Figure 6.1: Example pass (green), fail (red), and perimeter (black) DGPS tracks overlaid on a course template.
Figure 8.1: Pass and fail rates by group. Figure 8.2: Mean (SD) path length. Figure 8.3: Mean (SD) time in course. Figure 8.4: Mean (SD) number of impacts.
Figure 8.5: Mean (SD) severity of all global impacts.
Figure 8.6: Mean (SD) severity of maximum global impacts. Figure 8.7: Mean (SD) nozzle executions.
GLOSSARY
A/D Analog-to-digital
Accel Acceleration
ANOVA Analysis of variance
bpm Beats per minute
C Degrees Celsius
CAPP Canadian Association of Petroleum Producers
CIS Canadian Ice Service
CO Carbon monoxide
CO2 Carbon dioxide
Deg Degrees
DGPS Differential global positioning system EER Escape, evacuation, and rescue
g g-force (acceleration)
GPS Global positioning system
HIC Human Investigations Committee
HR Heart rate
IMO International Maritime Organization
IOT Institute for Ocean Technology
LCD Liquid crystal display
LSA Lifesaving Appliance
MMP Mini Motion Pack
MUN Memorial University of Newfoundland
n Sample size
NL Newfoundland and Labrador
NRC National Research Council of Canada OSSC Offshore Safety and Survival Centre
p p-value, statistical probability
PCOC Pleasure Craft Operator Card PPM Parts per million
r Pearson correlation coefficient
REB Research Ethics Board
RPM Revolutions per minute
Sec Seconds
SD Standard Deviation
SOLAS Safety of Life at Sea
STCW Standards of Training, Certification and Watchkeeping
TC Transport Canada
TEMPSC Totally Enclosed Motor Propelled Survival Craft
TR Technical Report
1.0 INTRODUCTION
Commercial and industrial operations continue to push further north as shipping lanes open up and oil and gas exploration expands. As a result, the safety equipment and regulations that accompany these operations must also adapt to the harsh Arctic environments. It is important to consider the impact of climatic conditions such as cold and snow, as well as the remoteness of the work since search and rescue stations may be located hundreds of miles away. A good example of a safety modification to marine safety equipment in northern waters is the development of Totally Enclosed Motor Propelled Survival Craft (TEMPSC).
Survival crafts were originally designed to be propelled by either oar or sail, and were completely open to the elements, the primary function being the transportation of occupants to safety while awaiting rescue. However, this type of survival craft does not lend itself to the frigid conditions and relative isolation of Arctic waters. Therefore, the need for a totally enclosed survival craft, with a propulsion system capable of travelling greater distances, has become both apparent and crucial.
The shift in the design of lifeboats used in northern waters has necessitated a similar shift in the standards that apply to them. However, as many international maritime regulations are very broad in scope and apply the same rules to safety vessels in the Gulf of Mexico as those in Arctic waters, there remains a pressing need for regulations to become more goal oriented (i.e. performance-based). The Atlantic Canada Offshore Petroleum Industry Escape, Evacuation, and Rescue Guide (2010-0017), developed by the Canadian Association of Petroleum Producers (CAPP) highlights the fact that performance standards are created in order to consider the various circumstances that may be specific to a given installation and its operation. In other words, performance standards must work toward, and adapt to, the changing needs and safety goals of technologies, programs and/or environments. In attempting to implement these performance standards it becomes apparent that there is a need to focus on training, with TEMPSC coxswain training representing a key area in which these types of regulations are required.
Power-MacDonald et al. (2011) have indicated that the international training certification for lifeboat operation, as outlined by The Standard Training, Certification and Watchkeeping (STCW) Convention, does not incorporate instruction on navigation through ice-covered waters, thereby highlighting the need for a move to performance based standards. As many maritime operations move northwards, such as shipping and offshore oil & gas drilling, expectations for personnel to experience harsh environments, in particular those infested with ice are increasing. The Canadian Ice Service (2011) highlights that ice-covered waters can cause ship navigators a variety of issues, such as physical damage, fuel overuse, navigational difficulties, and slowing speed. These issues may be further compounded by the fact that life-saving vessels are used for scenarios that are generally characterized by rapidly escalating situations, as well as adverse weather conditions (Patterson et al, 2011).
In light of this, through changes that will come into effect in 2012, the International Maritime Organization (IMO) has amended the STCW Convention to formally recognize the applicability of simulation training as a substitute for physical training (IMO, June 2010). There remains little opportunity to train in ice conditions as such training can contribute to the risk of harm to the participant. The National Research Council of Canada – Institute for Ocean Technology (NRC-IOT), Memorial University of Newfoundland (MUN), and Virtual Marine Technology, Inc. (VMT) are examining the effectiveness of using virtual lifeboat training through the use of a simulator to help increase the safety of offshore personnel. By using a simulator to train operators in harsh conditions training opportunities can be increased, and the risk to operators, instructors, and equipment can be reduced.
Power-MacDonald et al (2011) carried out the first phase of NRC-IOT’s small craft simulation research in the spring of 2010. During these trials the TEMPSC was operated in a simulated ice field constructed of floating barrels and docks. The results of this work suggest that simulator training may be a valid and reliable means of providing safe and effective training for TEMPSC operation in ice, thereby providing a proof of concept on which future work could be designed. The second phase of the research, detailed in this report, also involved a series of systematic full-scale experiments using a TEMPSC built in accordance with the regulations put forth by the International Maritime Organization – Safety of Life at Sea (IMO-SOLAS) aimed at establishing the validation and accreditation of small craft simulator training; however, this round of trials took place in a real ice field of known concentration. It is intended that through the collection and analysis of performance measures, along with heart rate and psychometric data, navigational proficiency and confidence may be examined in order to facilitate between-group comparisons of simulator and non-simulator training participants.
2.0 PROJECT OBJECTIVES
The purpose of this study was to determine if simulated lifeboat training will provide participants with the ability to navigate through ice, while maintaining a safe training environment. The main objective of the work was to establish the validation and accreditation of small craft simulator training as pertaining to TEMPSC operation in ice. In addition, future work could be done to exclusively analyze both the engineering variables (such as number and severity of impacts) and the environmental variables (such as cabin temperature and carbon dioxide accumulation), providing insight into the structural properties, as well as the safety and habitability, of the vessel.
3.0 RECRUITMENT AND TRAINING
The National Research Council’s Research Ethics Board and the Memorial University Human Investigation Committee approved the study protocol (NRC REB#: 2010-66). All participants gave their written informed consent prior to testing. Training curriculums and protocols were developed through collaboration between team members with backgrounds in seafaring, classroom teaching, and simulation training development. Training took place over two days, with each participant partaking in approximately 14 hours of total training. All participants were provided with transportation to and from the
training sites. Notably, no participant spent more than 30 minutes navigating a lifeboat, simulated or real, during his or her training.
The experiment involved a sample size of 18 participants. The anthropometric measures taken prior to testing (Table 3.1) show a mean age of 23.1 years (SD = 2.40), an average height of 171.8cm (SD = 8.84), and an average weight of 72.1kg (SD = 11.61). Recruitment began in January 2011 and was ongoing until training began in mid February. The recruitment poster and consent form used in the study are included in Appendices 1 and 2, respectively. Participants were given $50.00 CAD for the training portion of the study, and $50.00 CAD for testing. These sums were granted in order to offset any cost incurred by the participants related to travel and/or meals.
Table 3.1: Participant anthropometric data.
n = 18 Age (years) Height (cm) Weight (kg)
Mean 23.1 171.8 72.1
SD 2.40 8.84 11.61
3.1 Phase One Training
Participants were required to have no previous experience in lifeboat operation (i.e. novice operators), and therefore phase one of the training consisted of an eight-hour classroom session in order to achieve a Pleasure Craft Operator Card (PCOC) that introduced the participants to basic sea-faring procedures and regulations. The PCOC training course was delivered by the Canadian Power and Sail Squadron and took place at the NRC-IOT facility in St. John’s, NL in February 2011. Once all participants had successfully completed this training they were licensed to operate small motor propelled vessels (up to 24m in length) within Canada and could move on to the next phase of the training protocol.
3.2 Group Assignments And Phase Two Training
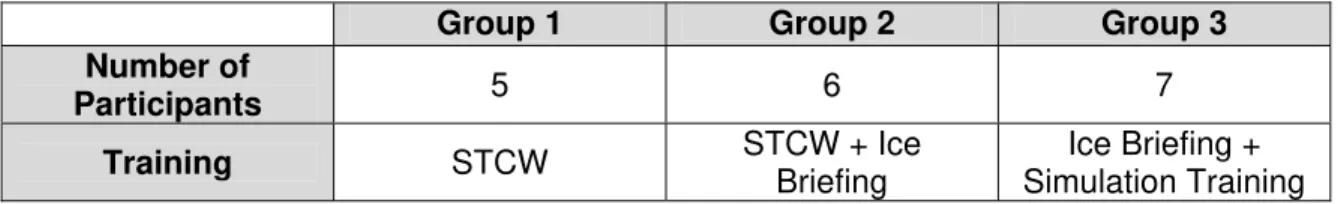
Prior to the second phase of training, the participants were randomly assigned to one of three groups (Table 3.2).
Table 3.2: An overview of group and training assignments.
Group 1 Group 2 Group 3
Number of Participants 5 6 7 Training STCW STCW + Ice Briefing Ice Briefing + Simulation Training
This second round of training, including the STCW, ice briefings, and simulator training provided roughly six hours of training per participant, and took place at the Marine Institute of Memorial University Offshore Safety and Survival Centre (OSSC), St. John’s, NL in March 2011.
3.1.1 Standard Training, Certification And Watchkeeping (STCW)
Groups 1 and 2 underwent the STCW training. An instructor from the Offshore Safety and Survival Centre (OSSC) in St. John’s, NL delivered the material on lifeboat navigation and manoeuvring. This was a three-hour classroom session, complemented with a three-hour session in the lifeboat, giving participants practical experience piloting the lifeboat in calm water conditions in St. John’s harbour (Figure 3.1). The notes presented during the STCW training are included in Appendix 3.
Figure 3.1: STCW training in St. John’s, NL harbour. 3.1.2 Ice Briefing
Groups 2 and 3 received an ice briefing on navigation in ice-covered waters. The ice briefing syllabus was compiled by a research collaborator based on information from the Canadian Ice Services, along with the instructor’s personal and professional experience in ice navigation. The session was three hours in duration, and was conducted in a classroom setting. The notes presented during the ice briefing are included in Appendix 4.
3.1.3 Simulator Training
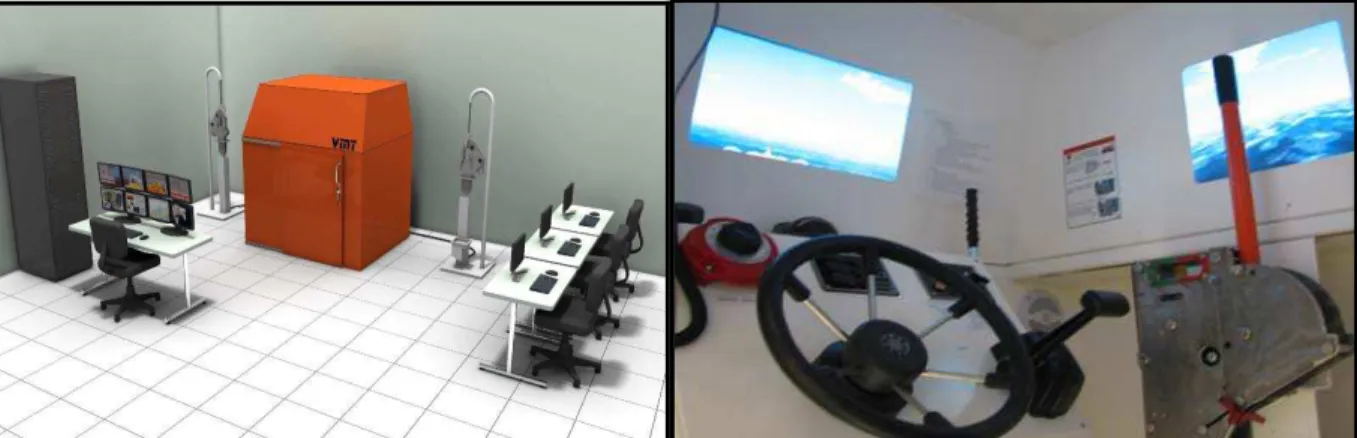
Group 3 completed simulator training using a davit launch full mission class “S” training simulator. The training simulator was developed by Virtual Marine Technology, Inc. (VMT), and was approved by Det Norske Veritas as being in fulfillment of the STCW Chapter 2 requirements for compliance and competency. A poster produced by VMT that outlines the capabilities of their small craft training simulators is included in Appendix 5. Exterior and interior views of the simulator may be seen in Figure 3.2.
Figure 3.2: Full mission class “S” training simulator, showing a sample classroom setup (left) and a partial view of the interior (right).
In terms of the physical and technical specifications of the simulator, it measures 1.98 m high x 1.82 m long x 1.55 m wide, representing a generic davit launch lifeboat with all the operating controls to launch and manoeuvre a lifeboat, including an ignition switch, battery switch, steering wheel, compass, and radio. The instructor’s station is located just outside the simulator and gives the instructor the ability to apply a number of different variables to the training scenario including time of day, visibility, weather, sea state, location, and ice-coverage, as well as to monitor what the participant sees in real-time (Figure 3.3). For the purpose of this study, simulated ice concentrations increased from open water (0/10ths) to 5/10ths. Moreover, when a participant committed an error that would result in significant “virtual” damage to the vessel, the simulation program ended. The visuals for the simulator were presented to the user through four 82 cm LCD screens, consisting of four different views: port, starboard, bow and stern (bow and starboard shown in Figure 3.2). Lastly, the auditory system within the simulator is a 5.1 Dolby Digital™ surround sound system.
4.0 TEST PLAN
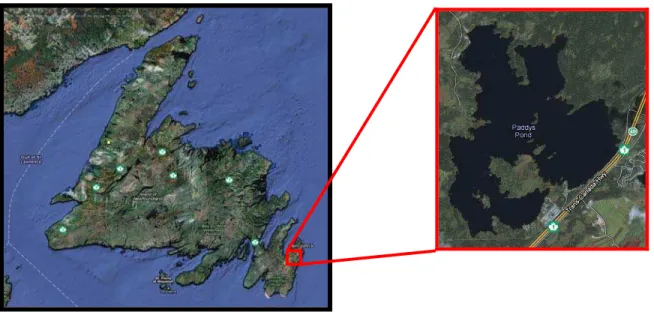
The trials were conducted at Paddy’s Pond (47°28’39.96”N, 52°53’17.46”W), a large freshwater lake outside of St. John’s, NL (Figure 4.1). Participants were provided with transportation to and from the test site. Upon arrival at the location, participants were escorted to a field trials trailer in which they would be kept warm and provided food and beverages. There was also a private room where participants were instrumented before their testing. Also, the trailer shielded the participants from viewing the test field, thereby preventing them from prematurely strategizing their course through the ice field. Appendix 6 contains a conceptual overview of the field trials set-up, including both the ice field and the onshore trailers.
In March 2011, Paddy’s Pond was frozen over with an average thickness of 12cm of true ice, 31cm of snow ice, and an internal ice temperature of 0.2°C. An ice field was created on the south side of the lake by cutting a 70mx50m perimeter into the ice and removing roughly 6/10ths, leaving an approximate ice concentration of 4/10ths within the test field. The testing took place over five days, resulting in variable weather conditions. The average recorded air temperature across the trial days was -0.8°C, and the average recorded wind speed was 18.2 km/h. A full log of the environmental conditions on the days of testing is provided in Table 4.1.
Table 4.1: Environmental conditions during testing at Paddy’s Pond, NL.
Date Time Temp
(C) Humidity (%) Wind Speed (km/h) Wind-chill (C) Weather 0830 -6 81 22 -13 Cloudy 15-Mar-11 1230 -6 68 17 -12 Cloudy 0830 -2 79 19 -7 Clear 16-Mar-11 1230 2 65 22 - Partly Cloudy 0830 3 92 17 - Drizzle 17-Mar-11 1230 5 94 22 - Rain 0830 1 91 11 - Cloudy 18-Mar-11 1230 3 86 17 - Cloudy 0830 -5 80 15 -10 Light Snow 21-Mar-11 1230 -3 74 20 -10 Light Snow
Figure 4.2: A template of the ice field layout.
During all tests there was a member of the field trials crew in the TEMPSC with the participant coxswain. In addition, there were two field crewmembers on the perimeter of the ice field at all times to monitor for safety, as well as to perform ice management tasks. All members of the field trials staff were trained NRC-IOT employees with previous TEMPSC and field trial experience. The field crewmembers and researchers present on site were in constant radio contact in order to facilitate safety feedback and deliver protocol instructions. For all tests the TEMPSC was navigated from the loading dock (shown in orange in Figure 4.2) to the entrance of the course at gate 1 by the field crewmember. Once in position, the participant replaced the crewmember in the coxswain’s chair, and the testing began. Throughout the trials, the participant was given full control of the steering wheel; however, while standing near the coxswain’s chair, the throttle was controlled by the field crewmember. The throttle was governed in order to avoid excessively large collisions with the ice pans and the perimeter of the course,
thereby working to ensure the safety of the participant as well as the TEMPSC. Upon completion of the test protocol, the crewmember once again took full control of the vessel and navigated it back to the loading dock.
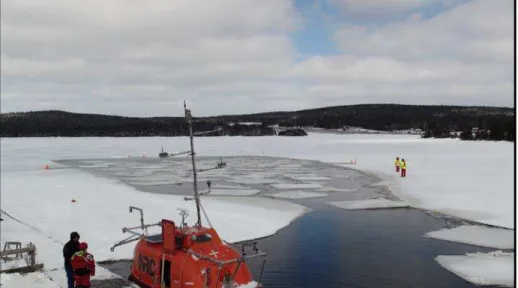
The perimeter of the ice field was expanded to include marked gates (roughly 3mx6m) located on the north (gate 2), south (gate 1), east (gate 4) and west sides (gate 3) of the course, with the southern gate leading to an entrance/exit channel and eventually a loading dock (Figure 4.2). The trials were designed to have participants execute various perimeter (clockwise and counter-clockwise), turning (port and starboard side), and unidirectional runs through the ice field while attempting to move from one gate to the next. Figure 4.3 shows a photograph taken of the ice field prior to the start of a trial. The participant (in red marine abandonment suit) is shown on the loading dock receiving a briefing from a member of the research team (in black), while two field crewmembers (in yellow and orange) can be seen on the far side of the course preparing for the trial.
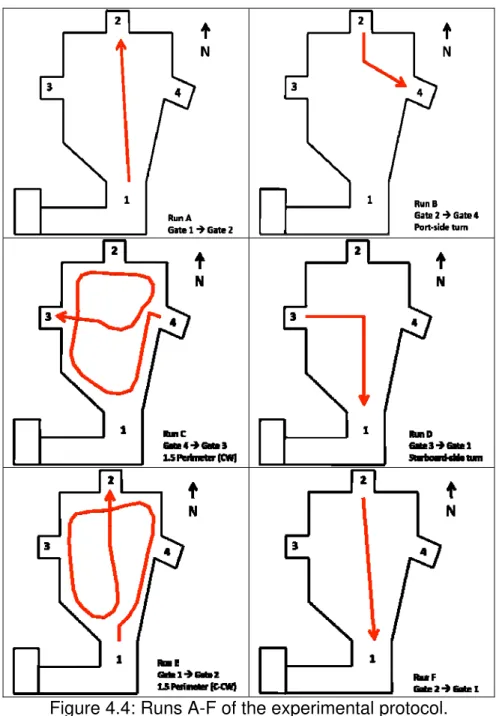
Figure 4.3: The TEMPSC and ice field prior to the commencement of testing. The six trial runs carried out by each participant are shown in Figure 4.4. As may be seen in the figure, runs A and F involve south-north and north-south unidirectional navigation, runs B and D involve portside and starboardside manoeuvring, and run C and E involve clockwise and counter-clockwise navigation of the perimeter of the course. These run paths were designed to cover a wide range of possible navigational scenarios, as well as to maximize the time in course.
Figure 4.4: Runs A-F of the experimental protocol.
Originally, the test protocols included a randomization of run progressions between participants. However, because this would add unnecessary movement through the ice field as participants were moved from gate to gate between runs, thereby compounding the degradation of the ice pans, a standard run progression was set. After moving up from the loading dock and idling at the entrance to the ice field, participants entered the course at gate one and followed a run progression of E – B – C – D – A – F (Figure 4.4). The goal of each run was to successfully navigate the TEMPSC from the start gate to the end gate, with the bow of the vessel cleanly entering the end gate. A given trial began when the research team had announced via radio the data acquisition had
begun. The participant was informed by the crewmember in the TEMPSC that they could begin, and the throttle was engaged. The trial would end once the vessel had either successfully entered the end gate (pass), or had missed the gate and struck the perimeter of the course (fail). Upon the termination of a run, the crewmember once again took control of the lifeboat and executed a 180° turn in order to reset and orient the vessel for its next run. A hard stop was fitted to the TEMPSC throttle that limited the throttle handle to a maximum of half speed. Also, the throttle was only put in reverse in the event that the TEMPSC had become lodged in an ice floe mid-run, at which point the vessel was backed up and further attempts were made to navigate the ice field. 5.0 INSTRUMENTATION AND PROTOCOL
The experimental protocol required independent instrumentation of the TEMPSC and the participants. The instrumentation process was very complex in that it had to facilitate the monitoring of engineering-based, environmental, and physiological (i.e. heart rate) data in real time using sensors located on the interior and exterior of the vessel, as well as on the participants.
5.1 TEMPSC Instrumentation
Trials were conducted using a TEMPSC built in accordance with the requirements put forth by the International Maritime Organization - Safety of Life at Sea (IMO-SOLAS) Convention (IMO 1997) and the International Lifesaving Appliance (LSA) Code (IMO 2003) and rated for 20 occupants. The TEMPSC is 5.2m long, 2.2m wide, and 2.7m high. The vessel has been retrofitted as a research craft, and is instrumented to collect relevant internal and external cabin information via a custom-built data acquisition system. During testing, the TEMPSC was ballasted to the equivalent of a full complement of 20 occupants (100% of the original occupancy). All data, with the exception of heart rate measurements, was logged and monitored remotely in real-time from a data collection trailer located on shore (Figure 5.1 and Appendix 6).
Figure 5.1: An interior view of the on-shore data logging and monitoring trailer. The instrumentation package fitted to the lifeboat consisted of the following components on 128 data acquisition channels:
A dual-receiver, differential global positioning system (DGPS) unit provided position and attitude information, including heading, latitude, longitude and time. Position information was updated at 1 Hz, while heading, pitch and roll were updated at 10 Hz. Three inertial motion measurement systems:
o Inertial motion measurement system: MotionPakTM: a unit made up of 3 accelerometers and 3 rates located on the lifeboat’s centreline between the two sea-chests, houses the live and dummy load dynamometers.
o Min-MotionPakTM: a miniaturized, low-powered inertial motion sensor unit with surface-mounted accelerometers and rates (for measuring angular speed) in the X-Y-Z directions, mounted along the centre line of the lifeboat roughly at midships.
Carbon monoxide (CO) and carbon dioxide (CO2) sensors: monitor gas levels and are
set with alarms configured to sound in the event that levels approach human safety thresholds (9 of each located throughout the interior of the lifeboat).
Temperature and humidity sensors (4): measure the lifeboat’s internal and external ambient temperature (2) and humidity (2) levels.
Light sensors (3): measure light levels inside the lifeboat. Sound sensors (7): measure noise levels inside the lifeboat.
Air flow sensors (4): installed over the lifeboat vent to measure airflow in and out of the lifeboat.
Roll and pitch sensors: measure roll and pitch independently.
Yo-Yo potentiometer and tachometer: instruments to measure nozzle angle and shaft speed.
Anemometer: measures wind speed and direction, mounted on the lifeboat’s mast. Magnetic compass and handheld GPS: instruments used by the coxswain to ascertain
heading.
Data acquisition battery monitor.
Load dynamometer (impact panel): three force transducers with a 10kN range measuring the force along the length of the lifeboat and one measuring the vertical force, along with three force transducers with 50kN range measuring loads across the beam of the lifeboat.
Accelerometers (2): impact accelerometers mounted on the mounting frame of the force dynamometer measuring impacts in the X and Y-axis.
External lifeboat video cameras (6): two looking down on the ice at the lifeboat’s shoulders, one forward mounted looking down at the ice at the bow, one at the stern looking down at the ice, one looking forward at the ice field, and one looking aft at the lifeboat track.
Internal lifeboat video camera (1): mounted above and forward of the coxswain’s chair facing back at the coxswain.
Sea-chest video camera (1): mounted in the portside sea-chest aligned with the three force transducers measuring loads across the beam of the lifeboat and looking through the acrylic impact panel to measure ice thickness.
Additional cameras (2): one rover video camera and one digital camera, both located on shore and operated from an elevated vantage point to allow for viewing of the entire course.
Note: A summary of the instrumentation calibrations used throughout the testing is included in Appendix 7. Also, a selection of photographs taken from each of the cameras used during the testing is included in Appendix 10.
5.2 Participant Instrumentation
Participants were instrumented on site in a heated field trials trailer. First, anthropometric measures were taken, including height and weight. Second, participants were fitted with a PolarTM heart rate monitor strap that fit snugly around their lower chest and communicated wirelessly in real time with the CorTempTM data logger (Figure 5.2). Next, they donned a WhitesTM abandonment suit over which they put on a vest with pockets designed to hold the heart rate data logger (Figure 5.3). Prior to zipping up the suit, and while the participant was in a seated position, a five-minute baseline heart rate was recorded. Once the baseline heart rate data was uploaded to a laptop, the logger was setup to record the trial data and placed in the vest pocket.
Figure 5.3: Data logger vest (left), and WhitesTM marine abandonment suit (right). 5.3 Protocol
Upon the completion of the heart rate logging setup, the marine abandonment suit was zipped up, and the participant was fitted for a safety helmet and lead out of the trailer to the loading dock at the edge of the course. Before entering the TEMPSC, each participant was given a safety briefing by a senior field crewmember or research team member. Finally, the participant entered the lifeboat and the experimental protocol began. Once testing was complete and the participant returned to the field trials trailer, they were helped out of their marine abandonment suit and de-instrumented by a member of the research team, while a second researcher uploaded their complete heart rate dataset. Prior to leaving the test site, participants were asked to fill out an exit questionnaire that was designed to gauge their perceptions of the ice field and their navigational abilities. A copy of the exit questionnaire is provided in Appendix 8.
6.0 DATA ACQUISITION
The experiment set out to examine whether simulation based training can be adopted as a valid and reliable surrogate for standard physical lifeboat training. In an attempt to do so, three different measures were used as testing parameters: navigational/operational performance, physiological response (i.e. heart rate), and questionnaires assessing the perceptions of the participants (i.e. psychometrics).
6.1 Performance Measures
The measurements shown in Table 6.1 were obtained through the data acquisition system instrumented throughout the lifeboat. The measurements were then used to calculate the variables indicated, with each being normalized over time. The variables
were used to derive the following performance measures: path length, time in course, number of impacts, severity of impact, and nozzle executions.
Table 6.1: Overview of TEMPSC operational performance variables. Performance Measure Derived Variables Description
Position and Heading Path length, pass & fail rate Latitude and longitude in the X and Y Cartesian planes
Time Time through course Measured in seconds
Craft accelerations and rates
Number and severity of impacts
In the X (longitudinal), Y (vertical), and Z (transverse) directions
Craft global loads Number and severity of impacts
Derived from force = mass x acceleration (f=ma)
Steering Steering nozzle executions Through steering nozzle executions (o)
Course over ground Path length, pass & fail rate Measured by differential GPS (m/s and m) External lifeboat video Numbers and type of
impacts
Head-on and glancing impacts
6.1.1 Pass / Fail Determination
Each run carried out by the various participants was assigned either a “pass” or a “fail” based on the position of the TEMPSC at the completion of the trial. A “pass” was given if the vessel successfully entered the gate, while a “fail” was determined to have occurred if it missed the gate and struck the perimeter of the course. These determinations were sometimes made difficult due to the wind constantly shifting the ice floes, frequently creating blockages at the gates that prevented entry. In the event that such a blockage occurred, the video data collected during the trials was referenced in order to determine if a given participant had moved the lifeboat as close as possible to the gate and had aligned it adequately to enter the gate if the ice pans blocking their path had not been there. Examples of pass and fail runs (both run B) as shown by their respective DGPS tracks may be seen in Figure 6.1. The DGPS “pass” run is shown in green (clearly moving from gate 2 to 4), the “fail” run is shown in red (leaving gate 2 but striking the east perimeter rather than entering gate 4), and an approximation of the field perimeter as measured during one of the daily field preparations is shown in black. It is noteworthy that the perimeter of the ice field could not be mapped exactly as high concentrations of ice were often blown up against at least one of the edges of the course preventing the TEMPSC from navigating the entire perimeter. For example, the DPGS perimeter track shown in the figure suggests that a significant amount of ice had accumulated near the northeast corner of the course, thereby preventing the lifeboat from closely mapping this region. As such, the DGPS tracks have been overlaid onto a course design template for reference.
Figure 6.1: Example pass (green), fail (red), and perimeter (black) DGPS tracks overlaid on a course template.
6.2 Heart Rate Measures
As stated previously, the heart rate data collected during the was obtained using a PolarTM heart rate monitor and a CorTempTM data logger (Figure 5.2). The heart rate measurements were recorded once every 20 seconds throughout the duration of the trials. The data was organized per participant, with each having a baseline (collected prior to testing) and trial dataset (collected during testing). For each participant, the baseline data was uploaded to a laptop in the field trials trailer upon completion of the five-minute collection, and the trial data was uploaded to the same laptop once the full testing protocol had ended. This information was collected with the intention that, through a comparison with the performance measures (i.e. impact severity, nozzle executions, etc), clear stress-responses would be seen. Consequently, this could provide insight into some of the potential sources of stress that may be experienced by coxswains when navigating a TEMPSC through an ice field. The complete heart rate dataset may be found in Appendix 15.
6.3 Psychometric Measures
The psychometric questionnaires employed in this study were a modified version of the NASA Task Load Index (Perry et al., 2008). The questionnaires sought to obtain the subjective experience of participants through the testing and training periods by examining their confidence and proficiency in ice-covered water navigation, and were administered upon completion of the experimental protocol and the de-instrumentation of the participant. All participants, regardless of group assignment, completed the generic post-training questionnaire. The questionnaire contained both scale and open-ended questions regarding the participant’s experience during the testing period. For the scale questions, each subject identified a scale score between 1-10 (with 1
representing low proficiency or confidence, and 10 representing high proficiency or confidence) for each of the four questions presented. For the three open-ended questions, the responses were analyzed using classic content analysis in order to examine word frequencies in the responses (Hsieh & Shannon, 2005).
6.4 Data Organization
Upon the completion of each test day, data was backed-up and uploaded to a desktop computer off-site at the NRC-IOT offices. Before commencing data analysis the files were organized first into test day, then participant, and then test run.
6.5 Statistical Analysis
Descriptive statistics (i.e. means, standard deviations, and percentages) were employed in the preliminary analysis of the data in order to establish trends. A one-way analysis of variance (ANOVA) was then performed to determine if training influenced navigational success throughout each of the six runs. Two-tailed Pearson (r) correlations were carried out in order to establish if any of the linear relationships between the various performance measures were statistically significant. Similarly, Pearson (r) correlations were also carried out to identify any possible linear relationships between the performance measures and the heart rate data. As was the case with Phase 1 of the project, p < 0.05 will be used to indicate statistical significance, and p < 0.10 will be considered to approach statistical significance. All statistical and graphical data analysis was done using [p1]IGOR™ and SPSS™ statistical software packages, as well as Microsoft Excel™.
7.0 RESULTS
It should be noted that the data collected from Day 5 of the trials was not included in the performance measures calculations. This is because significant warming occurred over the weekend between trial days 4 and 5, reducing the majority of the ice pans to slush and degrading the perimeter of the ice field to the point that it was unsafe to walk on, making it impossible to carry out ice management tasks safely. The full dataset was originally analyzed prior to making the decision to exclude the Day 5 data; however, due to the fact that the TEMPSC was essentially operating in open water and that there were minimal numbers of impacts and nozzle executions, the research team concluded that averaging these values with those of the other trial days would greatly reduce the overall strength of the findings. One participant from each of the three groups completed their trials on Day 5 meaning the same proportionate group representation was included in the calculations and analysis (Table 7.1).
Table 7.1: Number of participants included in analysis after Day 5 data was excluded.
Group 1 Group 2 Group 3
Number of Participants
Tested 5 6 7
Number of Participants
Tested on Day 5 1 1 1
Number of Participants
Included in the Data Analysis 4 5 6
7.1 Performance Measures
Performance measures are presented by group and run using means and standard deviations (SD), with the pass/fail data being shown as a percentage of the total runs completed by the individual groups. The full performance measures dataset, including individual pass and fail ratings by group and run, is included in Appendix 12.
7.1.1 Path Length
The path lengths of each run were determined using the position, heading, and course over ground information collected during the trials (Table 7.2). In the context of this report, path length is defined as the distance travelled while on course during the individual runs.
Table 7.2: Mean (SD) path length. Path Length (m)
Run A B C D E F
Group 1 96.7(8.31) 65.0(19.28) 237.5(15.92) 108.0(29.39) 234.9(14.65) 82.9(4.41) Group 2 90.7(3.92) 65.5(13.43) 200.2(25.77) 98.5(15.47) 235.1(13.57) 88.0(6.53) Group 3 91.7(9.57) 66.3(16.23) 219.8(32.82) 98.8(8.37) 242.4(18.63) 88.5(13.93)
There tended to be a high level of variability within the path length data, with no particular form of training appearing to result in significantly longer or shorter path lengths. This is likely due in large part to the constant shifting of ice pans throughout the course during the testing.
7.1.2 Time In Course
Since the throttle was governed throughout the testing, time in course, rather than speed over course, was selected as a measure of performance (Table 7.3). The times in course of each run were determined using engine data collected during the testing. A given trial was said to have started once the revolutions per minute (rpm) of the engine increased above idling levels, thereby indicating the TEMPSC was moving under power. Similarly, the trial ended when the rpm values returned to a steady state at idling levels.
The commencement and conclusion of runs were also confirmed using positional data and video analysis.
Table 7.3: Mean (SD) time in course. Time in Course (s)
Run A B C D E F
Group 1 123.3(29.55) 104.7(62.34) 278.1(60.11) 146.4(59.95) 292.9(52.47) 98.4(29.33)
Group 2 88.2(9.11) 82.0(21.00) 204.9(23.70) 92.5(21.88) 268.7(14.24) 82.3(14.67)
Group 3 105.3(26.07) 116.9(59.32) 225.6(80.18) 117.4(30.07) 333.0(72.12) 96.1(36.91) There tended to be a high level of variability within the time in course data; however, Group 2 participants consistently spent less time in course than either of the other two groups. Again, the nature of the constantly shifting ice pans throughout the course during the testing likely contributed to the inconsistency of results.
7.1.3 Impact Data
The number and severity of impacts that occurred during each run were determined using the craft accelerations and impact loads collected during the trials (Table 7.4, 7.5, and 7.6).
Table 7.4: Mean (SD) number of impacts. Number of Impacts
Run A B C D E F
Group 1 12.0(4.69) 9.3(2.22) 27.0(5.60) 10.0(4.69) 34.3(5.38) 7.5(2.38)
Group 2 12.4(3.21) 10.2(1.92) 22.4(2.70) 10.8(3.63) 34.0(6.04) 7.0(2.83)
Group 3 10.0(2.19) 9.5(3.39) 20.7(9.58) 10.8(3.31) 27.2(5.56) 7.2(2.64)
Table 7.5: Mean (SD) severity of all global impacts. Severity of All Global Impacts (g)
Run A B C D E F
Group 1 0.26(0.043) 0.25(0.021) 0.19(0.024) 0.23(0.042) 0.21(0.027) 0.25(0.028)
Group 2 0.26(0.034) 0.23(0.022) 0.22(0.018) 0.26(0.055) 0.25(0.021) 0.23(0.011)
Group 3 0.25(0.058) 0.23(0.027) 0.20(0.042) 0.20(0.042) 0.23(0.026) 0.27(0.064)
Table 7.6: Mean (SD) severity of maximum global impacts. Severity of Maximum Global Impacts (g)
Run A B C D E F
Group 1 1.50(0.892) 1.11(0.402) 1.19(0.519) 1.04(0.254) 1.03(0.169) 1.04(0.418)
Group 2 1.14(0.268) 0.91(0.241) 1.17(0.443) 1.05(0.357) 1.52(0.810) 0.81(0.224)
Overall, Group 3 participants tended to have fewer, as well as less severe, impacts than both the Group 1 and Group 2 participants; however, these results were not statistically significant.
7.1.4 Nozzle Executions
Steering nozzle executions were used to assess the number of times a participant turned the steering wheel toward port and/or starboard (Table 7.7). A neutral forward heading was set as a zero reference point, meaning, when plotted, anytime the steering wheel trace was seen to cross zero a nozzle execution had occurred.
Table 7.7: Mean (SD) nozzle executions. Nozzle Executions
Run A B C D E F
Group 1 12.0(1.83) 7.0(2.65) 20.8(7.80) 12.5(3.11) 28.8(3.59) 11.0(2.94)
Group 2 8.0(1.58) 5.8(1.48) 13.0(1.73) 8.0(4.18) 21.2(4.09) 8.0(2.55)
Group 3 9.8(4.36) 8.0(3.41) 21.0(8.81) 9.8(2.93) 26.7(6.59) 11.3(3.98)
There tended to be a high level of variability within the nozzle execution data between Group 1 and Group 3 participants, while Group 2 participants consistently had the fewest number of nozzle executions across all runs.
7.1.5 Pass / Fail Data
Pass and fail determinations were made based on reference to graphical and video data (Figure 7.8). First, using the traces obtained from the DGPS data, individual run plots were created for each trial completed during the testing (Appendices 11A-D). In turn, these run traces were compared to the DPGS traces of the perimeter of the ice field and determinations could be made as to whether or not the lifeboat had been successfully navigated from the start gate to the end gate. Before a run was assigned a “pass” or “fail” rating, the graphical data was confirmed via reference to the video data that was collected throughout each of the trials. A video log is included in Appendix 9. Only after analyzing both the graphical and video data was a run deemed a “pass” or a “fail”.
Table 7.8: Pass/Fail ratings.
Group Total Runs Number of Passes Number of Fails Pass Percentage (%) Fail Percentage (%) 1 30 19 11 63.3 36.7 2 36 27 9 75.0 25.0 3 42 36 6 85.7 14.3
7.2 Heart Rate Measures
The heart rate data collected during testing is presented in Table 7.9 (the full heart rate dataset may be found in Appendix 15). Baseline heart rates were comparable between all three groups, but Group 2 had the lowest trials heart rates. It should be noted that the standard deviations of the Group 3 heart rate data were markedly greater compared to the other two groups, with that of the trials data being especially high.
Table 7.9: Mean (SD) baseline and trials heart rate (HR) data by group.
Group Mean Baseline HR (bpm) Mean Trials HR (bpm) 1 88(10) 102(7) 2 78(7) 87(8) 3 78(14) 102(25)
In order to examine the relationship between the performance and heart rate measures, correlations between the datasets (Groups 1, 2, and 3 combined) were calculated. Table 7.10 shows the Pearson’s correlation coefficients (r values) representing the statistical meaningfulness of the linear relationship between the given variables (the SPSSTM output related to the correlation calculations is included in Appendix 16).
Table 7.10: Performance -and heart rate measure correlations.
Variable 1 Variable 2 Pearson's
r Value
Corresponding p Value
Heart Rate (bpm) Path Length (m) .485 p < 0.10* Heart Rate (bpm) Time In Course (s) .533 p < 0.05* Heart Rate (bpm) Number of Impacts .294 Ns p > 0.10 Heart Rate (bpm) Severity of All Impacts (g) -.029 Ns p > 0.10 Heart Rate (bpm) Severity of Maximum Impacts (g) .266 Ns p > 0.10 Heart Rate (bpm) Nozzle Executions .336 Ns p > 0.10 Heart Rate (bpm) Percentage of Passes .175 Ns p > 0.10 Heart Rate (bpm) Percentage of Fails -.175 Ns p > 0.10
* = significant, Ns = Not significant
The data shows that there was a significant correlation between time in course and heart rate, r = .533, p < .05. Using a more moderate p-value, there is also a relatively strong correlation between path length and heart rate, r = .485, p < .10. The correlations between heart rate and the other performance measures were found to have no statistical significance (Ns, p > 0.10).
7.3 Psychometric Measures
The exit questionnaire contained both ended and scale questions. The open-ended questions were designed to highlight the issues and challenges faced by the participants during the trials. The responses to the open-ended questions (1-3) were categorized to facilitate more meaningful comparisons (Table 7.11, 7.12, and 7.13, with the full uncategorized responses found in Appendix 17). The scale questions (4-7) were designed to examine the confidence and perceived proficiency of the participants (Table 7.14).
Table 7.11: Frequency table of categorized responses to exit questionnaire Question 1 (What were the challenges you faced during testing?)
Categorized Response Group 1 Group 2 Group 3 Total
Visibility 1 1 4 6 Steering 5 1 1 7 External Environment 0 1 0 1 Ergonomics 0 0 1 1 Internal Environment 0 1 2 3 Instruction 1 1 0 2
Experience with Ice 4 3 3 10
Table 7.12: Frequency table of categorized responses to exit questionnaire Question 2 (What would better prepare you to face these challenges?)
Categorized Response Group 1 Group 2 Group 3 Total
Visibility 1 0 0 1 Steering 1 0 0 1 Ergonomics 0 1 2 3 Internal Environment 1 1 1 3 Instruction 1 0 0 1 Training/Practice Time 4 5 3 12 Simulator Training 1 2 0 3
More Experience with Ice 1 0 2 3
Table 7.13: Frequency table of categorized responses to exit questionnaire Question 3 (What would help prepare you better for the ice trials?)
Categorized Response Group 1 Group 2 Group 3 Total
Training/Practice Time 4 4 5 13
Simulator Training 0 0 3 3
More Experience with Ice 3 4 3 10
Looking at the categorized responses to the open-ended exit questionnaire questions, there are two main aspects of TEMPSC training and operation that were highlighted by
the participants: training time/experience in ice fields and ergonomic issues (including visibility and steering).
Table 7.14: Mean (SD) responses to exit questionnaire questions 4-7 by group.
Question Group1 Group 2 Group 3
4) How effective did you find the training?
(0-100%) 86.0(16.73) 75.0(15.17) 80.0(8.16)
5) How well do you think you navigated the
ice field during testing? (0-100%) 64.0(20.74) 71.7(16.02) 74.3(13.97) 6) How well do you feel you can navigate
through ice in the future? (0-100%) 72.0(8.37) 71.7(14.72) 68.6(13.45) 7) At what maximum concentration of ice do
you think you are able to navigate through in the future? (0-100%)
67.5(20.62) 66.7(23.38) 54.3(12.72)
The responses to scale question 4 on the exit questionnaire show that Group 1 perceived their STCW training to be the most effective. The question 5 responses indicate that Group 3 had the highest perceived proficiency during the ice field testing. Questions 6 and 7 suggest that Group 1 and Group 2 have the highest levels of confidence in their abilities to navigate the TEMPSC through ice-covered waters in the future.
8.0 DISCUSSION
Current physical training methodologies for small craft operation in ice-covered waters are limited due to inherent safety constraints. It would not be safe to expose students, trainers, and assets to the risks associated with running physical training scenarios in northern regions. However, advances in simulation technology have demonstrated the convenience and efficacy of utilizing simulators as a means of providing training to vessel operators in these areas. Simulators are capable of facilitating immersive training with a high level of fidelity by introducing advanced training scenarios, such as obstacle avoidance and standby vessel approaches, that would be highly dangerous if carried out in a real-world environment. Similar to Phase 1, this portion of the study set out to examine whether simulation could provide a valid and reliable surrogate for conventional STCW training in terms of preparing novice lifeboat coxswains for navigational operations in ice-covered waters.
8.1 Performance Measures
The results of the pass/fail ratings by group (Figure 8.1) indicate that simulator trained participants (Group 3) were more likely to successfully navigate through the ice field than those participants who were trained through current standard practices (Group 1), as well as those who received the standard training complemented with classroom instruction on ice navigation (Group 2). In other words, the data suggests that there may be a relationship between the type of training undertaken and the likelihood of
successfully completing a given trial. Compared to those who were simulator trained (Group 3), participants who completed the STCW training and the ice briefing (Group 2) were 1.7 times more likely to fail when navigating from gate to gate through the ice field. Most notably, those who completed only the STCW training (Group 1) were 2.6 times more likely to fail in comparison to those who were trained in the simulator.
0.0 10.0 20.0 30.0 40.0 50.0 60.0 70.0 80.0 90.0 100.0 Pass Rates Percentage (%) Group 1 Group 2 Group 3
Figure 8.1: Pass and fail rates by group.
An ANOVA was performed on the remaining performance measures (i.e. path length, time in course, number of impacts, maximum impact severity, mean impact severity, and nozzle executions), but did not yield any significant findings. The SPSSTM output for the ANOVA is included in Appendix 13. Correlations were then computed to highlight possible relationships between the performance variables and the groups (the SPSSTM output is included in Appendix 14). Several significant correlations were identified at the levels of p < 0.01, p < 0.05, and p < 0.10; however, there was no pattern, meaning that there was no consistency in correlations between variables when comparing separate runs. It is likely that the lack of statistically significant findings was across the ANOVA, and Pearson correlations was due, at least in part, to the small sample size and resultant lack of statistical power. The small sample size also contributed to the high amount of variability (i.e. large standard deviations) that might have masked potentially significant differences between groups as related to performance measures. It may also be suggested that this was compounded by the fact that the ice field was essentially in a constant state of transition. Wind speed and direction, along with the participant-directed movement and direction of the TEMPSC through the course, continually pushed the ice pans in various, somewhat unpredictable directions. With this in mind, despite the ice management efforts by the field crew, no two runs could be said to have taken place in an ice field of identical orientation, thereby making between-group comparisons very difficult.
In light of this, and due to the fact that the large amount of variance within the dataset, the performance measure means and standard deviations are most clearly presented and commented on in the form of bar charts. The path length data (Figure 8.2) shows that each of the three groups had relatively similar mean path lengths by run, with no group in particular having markedly longer or shorter path lengths. Also, each of the three groups appear to have similar fluctuations in variance across all of the trials.
0.0 50.0 100.0 150.0 200.0 250.0 300.0 A B C D E F Run Path Length (m) Group 1 Group 2 Group 3
Figure 8.2: Mean (SD) path length.
The mean time in course data (Figure 8.3) suggests that Group 1 and 3 tended to spend more time navigating the ice field; however, both groups showed a relatively large degree of variance in this performance measure. Group 2 consistently showed the shortest mean trial durations, as well as relatively small amounts of variance. Increased time in course could be viewed to represent apprehension and nervousness when manoeuvring through the course, but could also be seen as a manifestation of patience and careful planning as the ice floes were approached. Nonetheless, the limitations of the study make it difficult to determine which of these factors may have had a more prominent affect during the testing.
0.0 50.0 100.0 150.0 200.0 250.0 300.0 350.0 400.0 450.0 A B C D E F Run Time in Course (s) Group 1 Group 2 Group 3
Figure 8.3: Mean (SD) time in course.
Looking at the impact data, Group 3 appears to report the lowest number of impacts most consistently throughout the testing (Figure 8.4). Although in theory this may reflect on the relative effectiveness of the various forms of training, the small sample size and large standard deviations, especially with the longer circumnavigation runs (Run C and E), limit the extent to which conclusions may be drawn. Both the mean severity of all global impacts (Figure 8.5) and the mean severity of maximum global impacts (Figure 8.6) results show inconsistent rankings of groups between runs, as well as very large ranges of variance. The relatively narrow range of values present in the mean severity of all global impacts data (roughly 0.20g - 0.30g) is probably due to ice floe sizes and similar impact speeds. When the TEMPSC struck a large ice floe directly it lost forward momentum and was redirected. This often occurred several times with less and less lifeboat impact force recorded. Despite attempting to remove these lower impacts generated by multiple collisions with the ice floes via reference to the raw impact values and the video data, and to record and analyze only the initial impact values, it is possible that some remained resulting in high standard deviations. These large standard deviations are representative of the high variability of the course between runs due to the constantly shifting ice floes, and with such large ranges it is very difficult to comment directly on the meaningfulness of the results.
0 5 10 15 20 25 30 35 40 45 A B C D E F Run Numbe r of Impa c ts Group 1 Group 2 Group 3
Figure 8.4: Mean (SD) number of impacts.
0.00 0.05 0.10 0.15 0.20 0.25 0.30 0.35 A B C D E F Run Mean I m pact S e veri ty (g) Group 1 Group 2 Group 3
0.00 0.50 1.00 1.50 2.00 2.50 A B C D E F Run Max I m pact S e veri ty (g) Group 1 Group 2 Group 3
Figure 8.6: Mean (SD) severity of maximum global impacts.
Figure 8.7 shows that Group 2 tended to have the fewest number of nozzle executions across all six runs. Remembering that Group 2 also has the shortest average times in course, the results suggest that this group frequently opted for the most direct routes when navigating from one gate to the next. Although possibly beneficial in some instances, directness may not always be advantageous when manoeuvring through an ice field. The higher the concentration of ice, the more advanced the route adjustments and planning must be, typically requiring more time and more frequent nozzle executions. However, again, the extent to which the results can reasonably be generalized is limited by the large variance and small size of the dataset. Generally speaking, both a larger ice field and an increased sample size would likely have made group distinctions more obvious across all of the performance measures.