Analysis of Wet & Dry Weather Bacterial Concentrations
& Marina Catchments, Singapore
By
Genevieve Edine Ho
B.S.E Civil Engineering
University of Michigan, Ann Arbor 2009
Submitted to the Department of Civil and Environmental Engineering in Partial Fulfillment of the Requirements for the Degree of Master of Engineering in Civil and Environmental Engineering
at the
Massachusetts Institute of Technology June 2011
within Kranji
MASSACHUSETITS INSTlIUTE OF TECHNOLOGYJUN 24 2011
LIBRARIES
ARCHmVES
C 2011 Genevieve Edine Ho All rights reserved.The author hereby grants to MIT permission to reproduce and to distribute publicly paper and electronic copies of this thesis document in whole or in part in any medium now known or
hereafter created.
Signature of Author
D of
Department of Civil and
Genevieve Edine Ho Environmental Engineering May 12, 2011 Certified by
Senior Lecturer of Civil and
/ Peter Shanahan Environmental Engineering Thesis Supervisor Accepted by Heidi M. Nepf
Chair, Departmental Co ittee for Graduate Students
Analysis of Wet & Dry Weather Bacterial Concentrations within Kranji
& Marina Catchments, Singapore
By
Genevieve Edine Ho
B.S.E Civil Engineering
University of Michigan, Ann Arbor 2009
Submitted to the Department of Civil and Environmental Engineering on May 12, 2011 in Partial Fulfillment of the Requirements for the Degree of
Master of Engineering in Civil and Environmental Engineering ABSTRACT
The Singaporean government's Public Utilities Board aims to open Kranji and Marina Reservoirs to the public for recreational use. Thus, the water bodies have to be safe from fecal contamination in order to protect the people's health during water-contact activities. Under the Singapore-MIT Alliance for Research and Technology (SMART) program, faculty and students from Nanyang Technological University and MIT have worked together to conduct bacteriological studies at both Kranji and Marina catchments and their reservoirs. Storm water, especially from urban landscapes, contains elevated concentrations of total coliform, . coli, and enterococci bacteria. The goal of this study was to review, classify, and evaluate wet- and dry-weather bacteria samples dating back to 2005 with a focus on grab-samples collected by Nshimyimana (2010) in 2009 and samples collected during January 2011 field work at Choa Chu Kang Crescent, Bras Basah, and Verde. These bacteriological samples were collected from high density residential (HDR), low density residential, forested, and commercial areas.
Evaluation of the relationship between concentration and flow showed a linear increase in bacteria concentrations with flow in storm water from mixed forested and HDR areas, a pattern that is consistent with nonpoint source runoff, while commercial areas exhibited peak concentrations during low and high, but not intermediate, flows indicating contributions from both nonpoint and point sources. Likely point sources are sanitary sewer leakage due to aging infrastructure in the commercial area. All measured concentrations exceeded Singapore and USEPA's recommended bacterial levels for recreational water. Hence, more wet-weather sampling is recommended in order to collect data on bacterial concentrations so that more robust statistical analyses can be performed in future studies. The elevated bacterial concentrations during wet weather from this study indicate that extra precaution should be taken to manage discharge of storm water into receiving waters before they are made accessible to the public. Thesis Supervisor: Peter Shanahan
Acknowledgements
I would like to extend my gratitude to my thesis advisor Dr. Peter Shanahan for his constant
guidance, patience, and advice.
To my 2011 Master of Engineering Singapore team members; Ryan Christopher Bossis and Yangyue Zhang for the many laughs we have shared and also the rougher moments we have gone through over the past year.
To Eveline Ekklesia, Professor Chua Hock Chye Lloyd, Le Song Ha, and Syed Alwi Bin Sheikh Bin Hussien Alkaff of Nanyang Technological University for their hospitality and help while we were in Singapore.
I would like to acknowledge Jean Pierre Nshimyimana for his contribution to this study.
To our program director; Dr. Edward Eric Adams and also to Lauren McLean for bringing this wonderful program together and taking care of us all the way.
To Anjuli Jain Figueroa, Godine Chan, and the rest of the 2011 Master of Engineering group for making this year an unforgettable one. To all the memorable times in Room 1-143.
I would also like to acknowledge my friends from Lodge Preparatory School and Kindergarten who have been with me through thick and thin for the past twenty one years, dearest friends from the American Degree Program for the laughter and joy over the past five years, and to my friends from the University of Michigan. Your faith and encouragement have always given me strength whenever I needed it.
Last but not least, I would like to thank my family, whose never-ending love and support have brought me to where I am today. Thank you for always believing in me, sometimes even more than I believe in myself Especially to my parents; Ho Ming How and Chua Hua In, my sister; Geraldine Evone Ho, Aunt Chua Pin Eng, and my beloved grandmother Kho Sok Sim.
Only those who risk going too far can possibly find out how far one can go. T. S. Eliot
Table of Contents
Chapter 1: Introduction... 12
1.1 Singapore Background ... 12
1.2 W ater Issues and W ater M anagement ... 13
1.2.1 Singapore's W ater Supply - The Four National Taps ... 13
1.2.2 Current Campaign - Active, Beautiful, Clean W aters Programme ... 14
1.3.1 Development of Kranji Reservoir ... 15
1.3.2 M arina Reservoir ... 16
Chapter 2: Analysis of W et- and Dry-W eather Bacterial Loadings ... 18
2.1 Scope of Study ... 18
2.1.1 Reclassification of Wet- and Dry-Weather Samples from Nshimyimana (2010).. 18
2.1.2 Identifying Bacteriological Levels in Storm Runoff... 21
2.2 Bacterial Concentrations in Storm Runoff... 22
2.3 Indicator M icroorganisms ... 23
2.4 Point and Nonpoint Sources of Bacterial Loading... 24
2.5 Defining a Storm Event... 25
Chapter 3: Previous W et and Dry W eather Sampling Events ... 26
3.1 November 2005 to February 2006 Sampling ... 26
3.2 January & February 2009 18-Hour W ater Sampling ... 28
3.3 July 2009 Grab Sampling... 32
Chapter 4: January 2011 Field W ork ... 37
4.1 Sampling Locations... 37
4.2 Collection of Dry W eather Samples... 41
4.3 W et W eather Sampling ... 41
4.4 Colilert@ and EnterolertTM Systems ... .... 42
4.5 Laboratory Analysis ... 42
Chapter 5: Peak Runoff Estimation using W inTR-55 ... 44
5.1 W indows Technical Release 55 (W inTR-55) ... 44
5.2 Using W inTR-55... 45
5.2.1 Rainfall Distribution, P... 46
5.2.2 Landuse for CN Values using ArcGIS ... 46
5.2.3 Tim e of Concentration, Tc ... ... ... .. ... .... . . 48
5.2.4 Qp and T, using W inTR-55 ... 52
Chapter 6: Data Analysis ... 53
6.1 Effect of Land Use ... 53
6.3
Concentration vs
Q/Qp
...
57
6.4 Log C vs Q/Qp... 61
6.5 C/Cdy vs Q/Qp... .65
Chapter 7: Conclusions & Recom m endations ... 72
7.1 Reclassification of Nshimyimana (2010)'s Wet- and Dry-Weather Samples... 72
7.2 Bacteriological Levels in Storm Runoff... 72
7.3 Recom m endations ... 73
Chapter 8: References ... 75
Appendix A : 2011 Field Sam pling Results... 79
Appendix B: Select Field N otes... 85
Appendix C: W inTR-55 Required Inform ation ... 98
Appendix D : Previous Years' W et and Dry W eather Data... 107
List of Figures
Figure 1.1: M ap of Singapore (Bing.com, 2011)... 12
F igure 1.2: Singapore's 17 Reservoirs ... 14
Figure 1.3: Western Catchment with Kranji Reservoir included (PUB, 2007)... 15
Figure 1.4: Location of Western Catchment within Singapore (APWA, 2010)... 16
Figure 1.5: Location of Marina Catchment within Singapore (PUB, 2010)... 17
Figure 2.1: Results of Percentage Observations of Wet- and Dry- Weather E. coli Loadings (N shim y im ana, 2010) ... 18
Figure 2.2: January 2009, June-July 2009, and January 2010 Rainfall (mm) for various Sub-catchments within Kranji (NTU, 2010) (NR = not recorded)... 19
Figure 2.3: January 2009 Rainfall (mm) for Kranji Catchment (NTU, 2009)... 20
Figure 2.4: NTU Catchment and Reservoir Gauging Stations (NTU, 2008) ... 21
Figure 3.1: Averaged Total Colform for 18 hour Dry Weather Sampling during 21 & 22 Jan 2 009 (L ee, 2 0 09) ... 2 9 Figure 3.2: Averaged E. colifor 18 hour Dry Weather Sampling during 21 & 22 Jan 2009 (Lee, 2 0 0 9) ... 3 0 Figure 3.3: Averaged Total Col'form for 18 hour Wet Weather Sampling during 10 & 11 Feb 2 009 (L ee, 2 0 09) ... 3 1 Figure 3.4: Averaged E. colifor 18 hour Wet Weather Sampling during 10 & 11 Feb 2009 (L ee, 2 0 0 9) ... 3 2 Figure 3.5: 15th July 2009 Sampling Event at PB01 (KC1) ... 33
Figure 3.6: 15th July 2009 Sampling Event at PSO1 (KC2)... 34
Figure 3.7: 15 th July 2009 Sampling Event at KK01 (KC6)... 34
Figure 3.8: 22 July 2009 Sampling Event at KK05 and KK06 (KC6)... 35
Figure 3.9: 7h July 2009 Sampling Event at PUO2, PU03, PU4, PU05 (KC7)... 35
Figure 3.10: 9th July 2009 Sampling Event at PU06, PUO7, PU, PU0 PU (KC(7)KC... 36
Figure 4.1: Catchment Area of Choa Chu Kang Crescent (Streetdirectory, 2010)... 38
Figure 4.2: Author Conducting Field Sampling and View of High Density Residential Properties at Choa Chu Kang Crescent (Photographs by Eveline Ekklesia and Ryan Bossis)... 38
Figure 4.3: Catchment Area of Verde (Streetdirectory, 2010)... 39
Figure 4.4: MIT Student Conducting Field Sampling and Image of Low Density Residential Properties at Verde (Photographs by Eveline Ekklesia and Ryan Bossis)... 39
Figure 4.5: Catchment Area of Bras Basah (Streetdirectory, 2010)... 40
Figure 4.6: NTU and MIT Students Sampling at Bras Basah and Drain Sampled... 40
Figure 4.7: Bras Basah Commercial Area ... 41
Figure 4.8: Yellow Wells Indicating Positive Results for Total Coliform... 43
Figure 4.9: Fluorescent Wells Indicating Positive Results for Enterococci ... 43
Figure 5.1: WinTR-55 System Schematic (NRCS, 2009)... 45 Figure 5.2: Land Use GIS Data and Gauging Stations (Different Colors Indicate Different Land
Figure 5.3: Land Area Upstream of Gauging Stations KCJ, KC2, KC6, and KC7... 48
Figure 5.4: Topographic Map of Kranji Catchment (contour interval = 5 m) ... 50
Figure 5.5: Average Velocities for Estimating Time of Travelfor Shallow Concentrated Flow (N R C S, 19 8 6) ... 5 1 Figure 6.1: Event Mean Concentrations for Different Land Uses (NS = not sampled)... 55
Figure 6.2: Log-normal Bar Graphs of Event Mean Concentrations for Various Land Uses (N S = not sam p led) ... 5 6 Figure 6.3: Event Mean Concentrations for E. coli and Enterococci for Various Land Uses (N S = not sam p led) ... 5 6 Figure 6.4a: 2006 - 2011 Wet Weather Total Colform Concentration (CFU/100 mL) vs
Q/Q,
58 Figure 6.4b: Total Colhform Trendline for LDR Land Use ... 59Figure 6.5a: 2006 -2011 Wet Weather E. coli Concentration (CFU/mL) vs
Q/Q...
59Figure 6.5b: E. coli Trendline for Forest & HDR and LDR Land Uses ... 60
Figure 6.6a: Concentration of Enterococci (CFU/100 mL) versus
Q/Q,
... 60Figure 6. 6b: Enterococci Trendline for Forest & HDR and LDR Land Uses ... 61
Figure 6. 7a: Logarithm of Concentration of Total Coliform versus
Q/Q,...
62Figure 6. 7b: Total Colhform Trendline for LDR Land Use (Note: in trendline formula, y = L ocioC , x =
Q/ Q
p) ... 63Figure 6.8a: Logarithm of Concentration of E. coli versus
Q/Q...
63Figure 6. 8b: E. coli Trendline for Forest & HDR and LDR Land Uses (Note: in trendline form ula, y = LocioC, x = Q/Q p)... 64
Figure 6.9a: Logarithm of Concentration of Enterococci versus
Q/Q...
64Figure 6.9b: Enterococci Trendline for Forest & HDR and LDR Land Uses (Note: in trendline form ula, y = LocioC, x = Q/Q p)... 65
Figure 6.10: Total Coliform C/Cdry values versus
Q/Q...
67Figure 6.11: E. coli C/Cdry versus
Q/Q,
... 67Figure 6.12a: Enterococci C/Cd,, versus
Q/Q...
68Figure 6.12b: Enterococci Trendline for Commercial Land Use... 68
Figure 6.13: Log Total Coliform Concentration vs Q/Qdry... 70
Figure 6.14: Log E. coli Concentration vs Q/Qdry... 70
List of Tables
Table 3.1: E. coli Density (MPN/1 00ml) for Gauging Stations KC] and KC2... 27
Table 3.2: Enterococci Density (MPN/00ml) for Gauging Stations KC and KC2... 27
Table 3.3: New Names for 2009 Sampling ... 33
Table 5.1: Total Rainfall,
Q,
and T, of Storm Events... 52Table 6.1: Summary of Results (N/A = not available)... 53
Table 6.2: Percentage Distribution of Land Use (Chua et al., 2010) ... 54
Table 6.3: Bacterial Sample Collection Dates for C and Cdry ... 66
Chapter 1: Introduction
This chapter was prepared collaboratively with Ryan Bossis and Yangyue Zhang.
1.1 Singapore Background
Singapore is located at the southern tip of Malaysia, and is 137 kilometers north of the equator.
The total area of the entire country spans approximately 710 km2 (Granger, 2010) and the
country's current population is estimated to be around five million with a growth of 1% per annum (Nshimyimana, 2010). Singapore's free market economy has enjoyed almost uninterrupted growth since 1965, when it won its independence. The city-state has one of the highest per capital GDPs in the world ($45,000) with a standard of living comparable to North America and Western Europe. Among all the industries, the tourism industry is the best developed in that it generated $12.8 billion in receipts from a record of 9.7 million visitors in
2009.
Figure 1.1: Map of Singapore (Bing.com, 2011)
The climate in the Southeast Asian region is typically humid, rainy and tropical with two main monsoon seasons from December to March and June to September, and inter-monsoon periods in between typically characterized by heavy thunderstorms in the afternoons. Singapore receives
around 2400 mm of rainfall a year, which is above the global average of 1050 mm per year. However, lack of land and thus limited catchment area to collect rainwater, coupled with the high evaporation rates in the country, have caused Singapore to be classified as a water-scarce country. On the United Nations' list of country's fresh water availability, Singapore ranks 170 out of 190 (Tan et al., 2009).
1.2 Water Issues and Water Management
1.2.1 Singapore's Water Supply - The Four National Taps
Singapore has developed water supply for their population through what they describe as their "Four National Taps": water from local catchments, imported water from their neighbor country Malaysia, NEWater, and desalinated water. The demand for domestic water was 75 liters per capita per day in 1965 when the population of Singapore was at 1.9 million (Tan et al., 2009). Singapore's current population is 5.1 million people (S. Department of Statistics, 2011) and the current domestic water demand is at 154 liters per capita per day (Ministry of the Environment and Water Resources, 2011). With the projected population growth and an increasing demand for water per capita, the country is planning ahead to meet future needs.
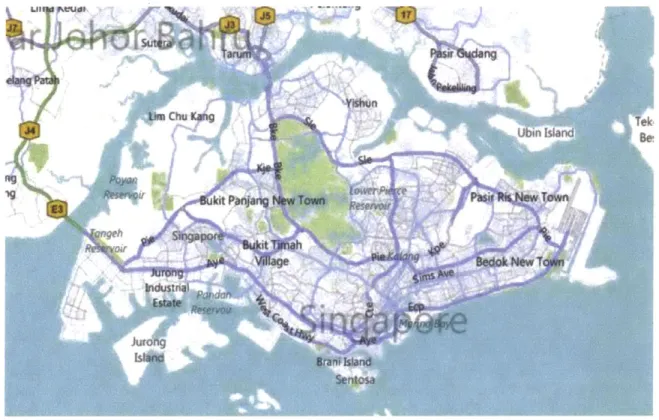
Singapore does not have natural aquifers or lakes. The country draws water from 17 constructed reservoirs with storage water collected using a comprehensive network of drains, canals, rivers,
and stormwater collection ponds. These catchments form Singapore's 1" National Tap (PUB,
2010). Figure 1.2 shows the 17 reservoirs (Pulau Tekong in the upper right corner is also a reservoir) (PUB, 2011).
The 2 National Tap is imported water from Johor, Malaysia. Under a 1961 and revised 1962 Water Agreement with Malaysia, Singapore has the full and exclusive right and liberty to draw off, take, impound, and use all (raw) water from the Johor River up to a maximum of 250 million gallons per day with a payment of 3 cents per 1000 gallons (PUB, 2010). The 1961 and 1962 Agreements will expire in 2011 and 2061 respectively. Singapore is planning for self sufficiency when the Water Agreements to import water from Malaysia expire in 2011 and 2061.
NEWater, the 3rd National Tap, is reclaimed municipal wastewater treated using advanced
membrane technologies and supplies 30% of Singapore's total water demand. There are currently five NEWater plants-Bedok (online in 2003), Kranji (2003), Seletar (2004), Ulu Pandan (2007), and Changi (2010) (PUB, 2010).
Singapore's 4th National Tap was turned online in September 2005 in the form of the SingSpring
Desalination Plant in Tuas. The plant produces 30 million gallons of water per day using reverse osmosis (PUB, 2010).
Kran* Resavoir was amatd by daming up
the river mouth aid is dtk in bidte
biodivenrRIwater hat fls in Choa Chu Kang anduldt Pa4n towns lows to the
Krang Reservoir through ains aid cana&
Saribur, Mura, Poyan
and %"gph
These our reservoirs me loatd in
genrmay uihabited aras
in #h west
kuongLAMls ama-made
freshwater au Rainwata hat fials m
he uon West and urong Easttowns is dwded to Vie lake bwough daiis and Pandan Consircted Upp
over swari POWn
laidasdheenanalPandan The i
dve, Pandan Resevoir resuvv
recve s water through vwthin
drainsd cank from meas There suh a Cerm an d BkiNO pdsn
Batoktowns their n
t4:pe Seletar
Upper 5detar Resevoir is Singapores third Irpundng
resevoir, ater MacRithie and Peirce Ressvors
Rainwater Wing iWoodands own ows toe Upper Sdetar Resevoir trough drains and canas
r ad Lower eMatdde'
st of Singapore's w ese are located
tse natre reseves sevoir waters M
eas they am ft in attral states
0aidn - -
-Maia Resevoir. Singapore's Isth resevoir aid In the tY, has the lagest ad most urbaised cat
10,000 hsutae Rainwater is collected from as fa
Queenstown, Geylang East Ang Mo Kio andToa
Lower Seleta
Lower Seleta Resevoir was consructed by AbiNg a dam aaoss Sungd
Seeat Rainrwater that fais in parts of Tsm andAng Mo Kio towns is
caeped to the Lower Sdela Reservoir Irough drais and canis
Pug- and Serangoon
Puniggo aid Serangoon Reservoirs ae Sipore's 16th ad 17th
resevoirs They were frimed by damig m4or ders Rainwater om
Sengkang. Punggol, and Hougang towns w be dmineled to ten.
The rst to tap waar from n a cachvmernt Bedk Resrvoir
was converted frm a iner said quary MN storwater
cokcton staons tap teraiwaterom s rowding urba"sed
aidunents likeBedok ad Taimes towns,
the hrt resevoir s Wat cawMst (Wfst
dnent at Wate Ccvent (Cmalt)m
ra W Wat catdnl (east)
Paych Iea Proectedwater catdvnen
Figure 1.2: Singapore's 17 Reservoirs
1.2.2 Current Campaign - Active, Beautiful, Clean Waters Programme
Via the Active, Beautiful, Clean Waters (ABC Waters) Programme, Singapore's Public Utilities Board (PUB) aims to transform the drains, canals, and reservoirs within the country into beautiful and vibrant streams, rivers, and lakes. The program's main objectives are to (1) transform water bodies into lifestyle attractions for the public in addition to functioning as collection, storage, and drainage systems; (2) involve People-Public-Private (3P) resources in developing water bodies into community spaces while at the same time maintaining water quality; (3) play the role of the umbrella program that connects all water management initiatives within the country; and (4) integrate water conservation into the community's lifestyle (PUB,
2008). PUB aims to transform two thirds of the country into a massive water catchment by the
year 2011 (PUB, 2010).
PUB developed a Masterplan to identifying potential water catchment projects across the
country. These projects would be implemented in phases over the span of ten to fifteen years with the first five-year plan being from 2007 to 2011. PUB divided the map of Singapore into three "watersheds": the Western, Eastern and Central Catchments, with respective themes and projects. The goal is to provide a suitable water management system to capture freshwater and additionally provide the public with water recreational activities.
1.3 Kranji and Marina Reservoirs
Kranji and Marina Reservoirs are two of the many reservoirs in Singapore being opened to the public under the ABC Waters Programme. Figure 1.2 shows both catchments relative to one another in size and distance. Kranji Catchment covers an area of 6,100 hectares whereas Marina Catchment covers an area of approximately 10,000 hectares.
1.3.1 Development of Kranji Reservoir
Kranji Catchment is a largely rural and underdeveloped area and has some of the most important nature areas in Singapore. Figure 1.3 shows the breakdown of water catchments in the Western Catchment, with Kranji Reservoir included in the figure at the northern corner and Figure 1.4 shows the Western Catchment's location within Singapore.
Kranji Reservoir is a drinking water reservoir in the northwest region of Singapore and is managed by Singapore Public Utilities Board (PUB). Kranji Reservoir has three main tributaries, Sungei Kangkar, Sungei Tengah, and Sungei Peng Siang. The reservoir, despite its strength in natural beauty, open space availability, and ecological uniqueness, has low visitor rates due to lack of transportation, poor access, and relatively isolated areas at the reservoir. Due to the availability of large undeveloped land however, Kranji Reservoir had high recreational potential among other reservoirs in the Western Catchment (Tan et al., 2009). Under the 2003 Masterplan, the Urban Redevelopment Authority (URA) of Singapore proposes to develop a tropical wetlands experience for the public around the Kranji freshwater marshes (PUB, 2003).
Western Catchment
Roundary
Figure 1.4: Location of Western Catchment within Singapore (APWA, 2010)
1.3.2 Marina Reservoir
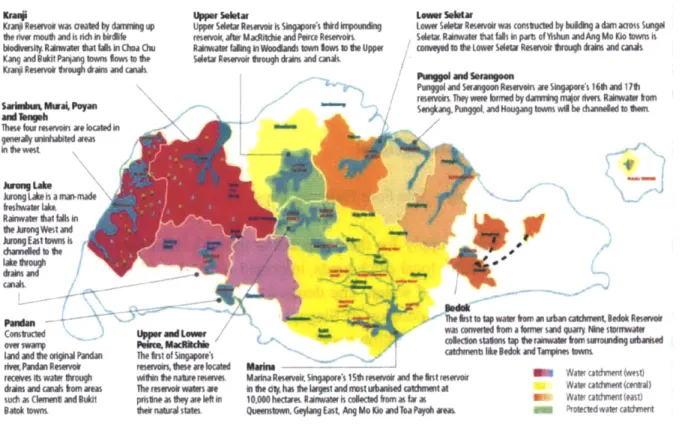
Marina Reservoir was formed in 2008 and is Singapore's 15th reservoir. It is the first reservoir in the center city and has the largest and most urbanized catchment. Marina Catchment
(highlighted in Figure 1.5) spans 10,000 hectares as previously mentioned (1/6th the area of
Singapore), and includes drains from some of the main areas of Singapore including Orchard Road, Ang Mo Kio, Paya Lebar, Alexandra, and other parts of the business district. This includes some of the oldest developments in Singapore. The mouth of the reservoir was dammed by the Marina Barrage and combined with the Punggol and Serangoon Reservoirs, aims to increase the country's water catchment area to two thirds of the total land area. PUB estimates the reservoir to supply more than 10% of Singapore's water demand. Sungei Singapore, Sungei Kallang, Sungei Geylang, and Rochor Channel (a tributary of Sungei Kallang) are the main tributaries flowing into Marina Reservoir. Excess water will be channeled into the existing Upper Peirce Reservoir for storage purposes. As of now, Marina Reservoir is still in transition from sea water to fresh water but Marina Barrage aims to keep out all the salt water from the reservoir.
Figure 1.5: Location of Marina Catchment within Singapore (PUB, 2010)
Chapter 2: Analysis of Wet- and Dry-Weather Bacterial Loadings
2.1 Scope of Study2.1.1 Reclassification of Wet- and Dry-Weather Samples from Nshimyimana (2010)
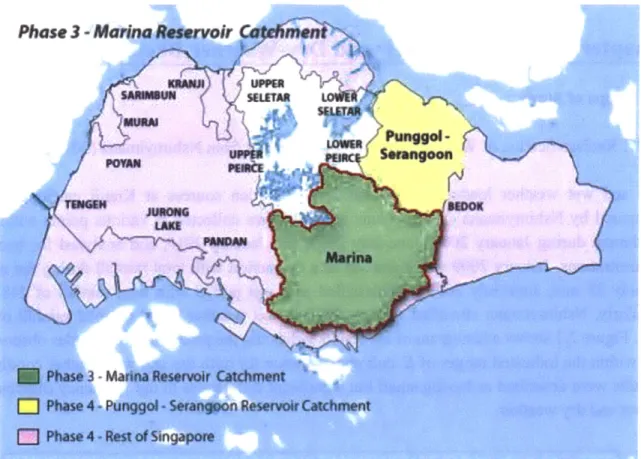
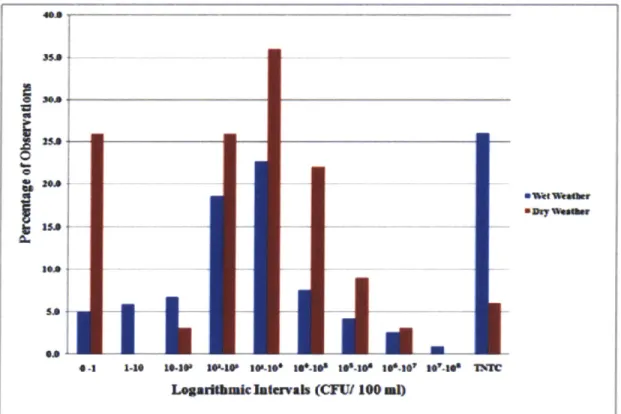
Dry and wet weather loadings of human fecal pollution sources at Kranji catchment were compared by Nshimyimana (2010). Water samples were collected at various points within the catchment during January 2009, June-July 2009, and January 2010, and analyzed for bacterial concentrations. January 2009 was classified as a dry period with total rainfall during the month of only 23 mm, June-July 2009 was classified as a wet period with total rainfall of 248 mm. Similarly, Nshimyimana classified January 2010 as wet weather based on total rainfall of 729 mm. Figure 2.1 shows a histogram of his results indicating the percentage of samples observed to fall within the indicated ranges of E. coli concentration for both dry and wet weather conditions. Results were described as having small but significant differences in the frequency distributions of wet and dry weather.
"1A
L.garh= Jlaervas (CFUI 100 nl)
Figwv 62 Comparon qf Fmwy Porcantmgam of Al . coal Data Reere undr Dry
(January 2009) and WEt Weadw (Jyv 2009 and Januay 2010)
Figure 2.1: Results of Percentage Observations of Wet- and Dry- Weather E. coli Loadings (Nshimyimana, 2010)
Figure 2.2 shows rainfall recorded at different sampling stations during January and June-July
2009 and January 2010 in millimeters of rain while Figure 2.3 shows the amount of rainfall in
January 2009. Rainfall during January 2009 was measured only at the KC2 (Pang-Siang 1) monitoring station since that was the only station in operation at that time whereas by June-July
2009 and January 2010, KC1, KC2 (Pang Siang, Pang Siang-1), KC3, KC4 (Tengah), KC6
(Kangkar), and KC7 (Pang Sua-2) stations went into operation and rainfall could therefore be measured (Nshimyimana, 2010). Rainfall was recorded at five-minute intervals throughout the year in units of millimeters. Flow velocity in meters per second and water surface levels in meters were also recorded by loggers in adjacent drainage channels.
Figure 2.2: January 2009, June-July 2009, and January 2010 Rainfall (mm) for various
Sub-catchments within Kranji (NTU, 2010) (NR = not recorded)
200.0 180.0 160.0 140.0 120.0 100.0 80.0 60.0 40.0 20.0 0.0
Pang Siang Pang Siang-1 Tengah Kangarkar Pang Sua-2
Kranji Sub-catchments ...... ... ....
20
115
11
0-Jainry lS,2009 JamMry 20,2*69 Jamry31.2009
Does OtJamary 2009 Ialrerwah OftrenDy
Figure 2.3: January 2009 Rainfall (mm) for Kranji Catchment (NTU, 2009)
It rained only on January 10th , 20th and 31St in 2009 (Figure 2.3) at Pang Siang-1 and based on
field observations, no samples were collected at Pang Siang-1 during those dates. Hence, the dry weather samples were definite dry weather samples. There is uncertainty as to whether or not the June to July 2009 and January 2010 samples were truly wet weather samples. In actuality, wet-weather samples should be samples collected during or after particular storm events. Using "total rainfall" (248 mm and 729 mm) was an inaccurate representation of weather conditions during that particular month. Although the process of sample collection was extensive, better conclusions regarding comparisons between bacteriological levels during storm and dry weather conditions can be made if those previous samples are categorized more accurately.
Hence, this study firstly aims to reclassify the wet- and dry-weather bacterial samples presented
by Nshimyimana (2010). In order to reclassify the samples, rainfall intensities and discharge per
sampling event had to be determined. Rainfall data for the storm events were compiled by SysEng (S) Pte. Ltd. and Greenspan Pte. Ltd. which are both based in Singapore. Rainfall intensity in millimeters is continuously being recorded at different rain gauging stations (represented by the red circles and black crosses in Figure 2.4) located in Kranji Catchment in Singapore. The rain amount is recorded at 1-minute, 5-minute and 10-minute intervals. Discharges during storm events were obtained from measurements recorded in the field and the
.. . ... . ...
peak flow was identified for each sampling event (i.e. from flow values from start of sampling to end of sampling only). Windows Technical Release 55 (WinTR-55) was used to find peak discharges at stations at which field measurements were not available. The methodology for this determination is described in Chapter 5.
Figure 2.4: NTU Catchment and Reservoir Gauging Stations (NTU, 2008)
2.1.2 Identifying Bacteriological Levels in Storm Runoff
This study secondly intends to identify typical bacteriological levels in storm runoff in Kranji Catchment and in the commercial section of Marina Catchment for different land uses based on analysis of sampling data collected from 2006 to 2011. Both wet- and dry-weather bacterial concentrations were compiled from previous and current studies conducted by students from the Massachusetts Institute of Technology (MIT) and Nanyang Technological University (NTU). Specifically, information was gathered from the final project report Water Quality Monitoring,
Modelling and Management for Kranji Catchment/Reservoir System - Phases 1 and 2 submitted
by the Division of Environmental and Water Resources Engineering of the School of Civil and
Environmental Engineering at NTU to PUB (NTU, 2008), Bacteriological Studies for Kranji Catchment by Lee Li Jun of NTU (Lee, 2009), Evaluating Human Fecal Contamination Sources in Kranji Reservoir Catchment, Singapore by Jean Pierre Nshimyimana of MIT (Nshimyimana,
2010), and data collected in January 2011 at Choa Chu Kang Crescent, Verde, and Bras Basah.
Chapter 3 discusses the datasets for wet- and dry-weather sampling events from 2005 to 2010. The objective of the wet- and dry-weather sampling conducted in 2011 (described in Chapter 4) was to obtain 12-hour series of bacterial concentrations from selected land use types draining into Kranji and Marina Reservoirs. This 12-hour sampling captured the fluxes of bacteria due to human activities such as cooking during lunch and dinner hours, as well as laundry in the mornings. It provides a better representation of fecal contamination at a certain area compared to results from grab sampling. This new dataset of bacterial concentrations in addition to previous years' datasets of bacterial concentrations will have been collected from a range of different land use types including High Density Residential (HDR), Low Density Residential (LDR), Commercial, and Forested areas. Those datasets were then reviewed for their usability for analysis. Results are presented in Chapter 6 in the form of derived concentration versus flow relationships.
The objective of deriving concentration versus flow relationships is to provide better representation of fecal contamination sources. Areas where bacteria concentrations are higher can be located and their peak loading times can be predicted based on rainfall and flow levels. With such knowledge, best management practice designs by Singapore's PUB could be better catered to suit different locations. Therefore, if wet- and dry-weather bacterial loadings could be reclassified more precisely and their sources identified, adequate preventive steps could be taken to protect the public from probable health risks.
2.2 Bacterial Concentrations in Storm Runoff
This section was written in collaboration with Yangyue Zhang.
Previous studies have shown elevated indicator bacteria concentrations in storm runoff from urban areas and in streams. Based on microbial analysis, Overcash and Davidson (1980) found that densities of indicator microorganisms in storm runoff were usually tenfold higher than densities in urban streams and were close to densities found in raw sewage. There is proof of increased health effects to individuals swimming near storm-water outfalls in Santa Monica Bay, California, and of elevated indicator bacteria concentrations in shellfish waters after storm events (Hathaway et al., 2010). Infections of the skin, eyes, ears, nose, and throat may result from contact with the water during such recreational activities as bathing, water skiing, boating, and fishing (Thomann and Mueller, 1987). This is because common modes of transmission of pathogens are through ingestion of contaminated water and food, and exposure to infected
persons or animals. In the event that the runoff is redistributed to surface waters in use by the public as could be done at Kranji and Marina Reservoirs, health risks to the public have to be taken into consideration. Reservoirs may be closed permanently or intermittently during rainfall conditions when high concentrations of pathogenic bacteria are discharged from urban runoff and combined sewer overflows.
It is therefore important to identify concentration levels of bacteria being discharged into receiving waters. Measurement approaches for bacteria in water include analysis for (a) indicator bacterial groups that reflect the potential presence of pathogens, (b) the pathogenic bacteria
directly, (c) viruses, and (d) intestinal parasites. Of these, indicator bacteria are the most
commonly used and are discussed further in Section 2.3.
2.3 Indicator Microorganisms
This section was written in collaboration with Yangyue Zhang.
Indicator microorganisms are used to indicate the presence of pathogenic microorganisms or fecal contamination. The ideal indicator organism can be described as (1) being usable for different types of water sample environments but has no elevated growth rates whilst in water, (2) being present whenever pathogens are present and therefore have densities with direct relationships to degree of fecal pollution, (3) having survival times that are reasonably longer than the survival times of pathogens being detected, and (4) being commonly found in the intestines of warm-blooded animals (Maier et al., 2009). Indicator microorganisms are not necessarily pathogenic but are found more often than not in parallel quantities to the amount of fecal contamination (which contains pathogenic microorganisms) due to their presence in the intestines and therefore feces of mammals.
While the use of bacterial indictors to measure water quality is widespread, no universal agreement exists to indicate the most favorable indicator microorganism to be used. Presently, the most commonly measured bacterial indicators include total coliforms and E. coli. Total coliforms were first to be used in studies with a threshold of 2,300 CFU/100mL as an indicator for detectable swimming-associated health effects based on observations in an epidemiology study conducted by the United States Public Health Service (Dufour, 2001 as cited by Noble et al., 2003). Following the use of total coliforms, E. coli (a subset of the fecal coliform group) was established as the preferred indicator and its threshold was based on a series of epidemiological studies carried out in sewage-impacted recreational waters (Cabelli et al., 1982; Dufour, 1984). These studies demonstrated that that the concentration of E. coli correlated better with water-contact-related illnesses in comparison with total coliforms. E. coli is a good indicator in fresh water and is generally absent in unpolluted waters. More recently, enterococci has been introduced as another indicator of fecal contamination. Enterococci is more persistent in water and sediments compared to coliforms (Sobsey, 2007).
However, the applicability of E. coli as an indicator organism in tropical climates has been doubted (Lopez-Torres, 1987; Hazen, 1988) due to its growth in soils and waters in such climates, and its poor survival in high salinity water, which might give low predictability of health risks (Sobsey, 2007). Singapore is a tropical country with abundant rainfall throughout the year. Hence, the efficiency of using E. coli as an indicator in this region might decrease.
In August 2008, Singapore's National Environment Agency (NEA) adopted new water quality guidelines for recreational water based on studies dating back to 2005 conducted by members of
NEA, PUB, the National Water Agency, National University of Singapore, and NTU. These new
guidelines apply to whole-body water contact activities which are also known as primary contact activities. Enterococcus was stated to be the better indicator of gastrointestinal and respiratory illnesses but E. coli is still used alongside as a water quality indicator in most bacterial studies in Singapore (Dixon et al., 2009; Kerigan and Yeager 2009; Granger 2010; Nshimyimana 2010) since there is no adequate amount of evidence to show that E. coli has failed to identify the sources of fecal contamination. The 2008 NEA guidelines state that for recreational and fresh water bodies, Enterococcus counts should be less than or equal to 200 CFU/1 OOmL water 95% of the time (NEA, 2008). The USEPA guidelines state 126 CFU/100mL for E. coli concentrations
and 33 CFU/100mL for enterococci (USEPA, 2003).
2.4 Point and Nonpoint Sources of Bacterial Loading
Bacterial pollution stems from two main groups; natural and man-made (Novotny and Chesters,
1981). These can be further categorized into point sources or nonpoint (diffuse) sources. Point
source pollution enters water bodies via identifiable locations and are easily measured or quantified. Their impact can usually be evaluated directly. Major sources include effluent from solid waste disposal sites, sewage treatment plants (STPs), or industrial sources. The flow of point sources into surface water is steady, with relatively constant quality in which variability ranges less than one order of magnitude. Point sources cause higher impact during dry (low-flow) periods. Other parameters of interest besides bacterial loadings associated with point sources include biological oxygen demand (BOD), dissolved oxygen (DO) content, nutrients, and suspended solids.
Nonpoint source pollution usually enters surface waters due to meteorological events (Novotny and Chesters, 1981). Their exact source is hard to identify as the pollution accumulates over a large land area and is later transported overland before being discharged into surface waters. Flow of nonpoint sources is highly dynamic in random intermittent intervals with variability ranging at several orders of magnitude. Nonpoint sources cause most severe impacts during or following storm events. Examples of nonpoint sources include land erosion, residues from agricultural chemicals, or weathering of minerals. Their loading to surface water is a response of drainage area to a storm event which usually has limited duration; from a fraction of an hour to
two days. The magnitude of nonpoint sources depends on rain volume, intensity, quality, duration of previous dry period and others. Parameters of interest besides bacterial loadings include amount of sediments, nutrients, toxic substances, DO concentrations and pH.
2.5 Defining a Storm Event
According to Hathaway et al. (2010), a storm event is defined as "any rainfall event which produces runoff in excess of base flow." Base flow or base runoff is defined by the United States Geological Survey (USGS) as sustained or fair weather runoff, composed largely of groundwater effluent (Langbein and Iseri, 2008). Stream flows mostly consist of both groundwater discharge and land surface runoff (Schilling, 2010). Direct runoff and base runoff recede at different rates. Direct runoff recession curves and base runoff recession curves are usually drawn to aid in depicting the decreasing rate of runoff following a period of rain. For the purpose of this study, samples collected in January of 2011 are considered storm samples if collected during rainfall based on field observations. For samples collected in previous years, rainfall and discharge values are obtained and are plotted with concentration as a secondary y axis against time, to find an indication of where the samples lie during the storm.
Chapter 3: Previous Wet and Dry Weather Sampling Events
Total coliform, E. coli, and enterococci bacteria samples had been collected during both storm and dry weather in prior studies. Samples were collected in 2005 and 2006 using an autosampler
by a team formed by the Division of Environmental and Water Resources Engineering at NTU (NTU, 2008). Lee Li Jun from the School of Civil and Environmental Engineering at NTU
carried out 18-hour sampling events in January and February of 2009 (Lee, 2009). Lastly, Jean Pierre Nshimyimana from the Massachusetts Institute of Technology collected grab samples during the months of January 2009 and June and July 2009 (Nshimyimana, 2010). Another team of MIT students collected grab samples in January of 2010 (Foley et al., 2010).
The rainfall amount over time, time of sample collection, and discharge at the point of sampling for each sampling event was reviewed to identify the usability of each dataset for the analysis of wet and dry-weather bacterial concentrations. The dataset was considered usable if the following were available: (1) the 24-hour rainfall amount over time at regular time intervals at the sampling location, and/or (2) gauging record of the 24-hour discharge at the point of sampling, and most importantly (3) the time at which samples were collected. These parameters were required so that distributions of concentration and rainfall or discharge over time and of concentration versus discharge could be plotted in order to identify typical bacteriological levels in storm runoff in Kranji Catchment and parts of Marina Catchment in addition to reclassifying Nshimyimana's (2010) previous wet- and dry-weather bacteria samples.
3.1 November 2005 to February 2006 Sampling
Storm runoff was sampled under the Phase I and II Water Quality Monitoring, Modeling and Management for Kranji Catchment/Reservoir System Project by the Division of Environmental and Water Resources Engineering at NTU for PUB (NTU, 2008). Samples were collected at KC1 (Bricklands Road) and KC2 (Choa Chu Kang Walk) using ISCO 6712 autosamplers during the months of June 2005 to November 2006 and October 2006 to August 2007 respectively. The autosamplers were set to be triggered when water levels in the drains rose to above base flow and collected 24 one-liter samples at a time interval of 10 minutes. Rainfall, water flow levels, and water velocity were logged at 5-minute intervals. The samples were analyzed for E. coli and enterococci concentrations and results are shown in Table 3.1 and Table 3.2 below.
Table 3.1: E. coli Density (MPN 100ml) for Gauging Stations KC] and KC2 Bottle Analyzed
KC1
#3 #6 #9#12
#15
#18
#21
#24
Time Sampled 4:55:00 AM 5:25:00 AM 5:55:00 AM 6:25:00 AM 6:55:00 AM 7:25:00 AM 7:55:00 AM 8:25:00 AM 23-Nov-05 64,900 68,700 38,700 64,900 41,000 >242,000 43,500 17,300 Time Sampled - - - - - - - -18-Jan-06 4,500 5,500 5,800 4,400 5,300 2,400 4,100 7,900 KC2 #1 #4 #7 #10 #13 #16 #19 #22 Time Sampled - - - - - - - -10-Dec-05 3,100 1,300 4,200 3,900 3,900 1,500 850 4,500 Time Sampled - - - - - - - -25-Feb-06 740 3,600 2,500 2,700 4,600 7,900 16,700 7,500Table 3.2: Enterococci Density (MPN 100ml) for Gauging Stations KC] and KC2
Bottle Analyzed KC1 #3 #6 #9 #12 #15 #18 #21 #24 Time Sampled 4:55:00 AM 5:25:00 AM 5:55:00 AM 6:25:00 AM 6:55:00 AM 7:25:00 AM 7:55:00 AM 8:25:00 AM 23-Nov-05 45690 34410 24810 27230 16070 19890 10390 6630 Time Sampled - - - - - - - -18-Jan-06 4780 7820 5200 6050 4570 3450 4410 7890 KC2 #3 #6 #9 #12 #15 #18 #21 #24 Time Sampled - - - - - - - -10-Dec-05 >24196 >24196 >241960 141360 >24196 >24196 >241960 >241960 Time Sampled - - - - - -25-Feb-06 32700 5200 12200 28500 18900 20900 14600 12000
Unfortunately, time-of-sampling information for the 1 0th of December 2005, 18th of January
2006, and 2 5th of February 2006 was not provided by the contractor hired for the work.
Therefore in the future, if sampling times could be obtained for the other events in this series, further analysis on wet- and dry-weather bacterial concentrations could be carried out since this series of data collected via autosampler shows a good distribution of bacterial loadings over time. Dry weather sampling data were available (Table D-1 and D-2 in Appendix D) from this
series of sampling but unfortunately without the sample collection times, the E. coli and
enterococci concentrations could not be included in this analysis.
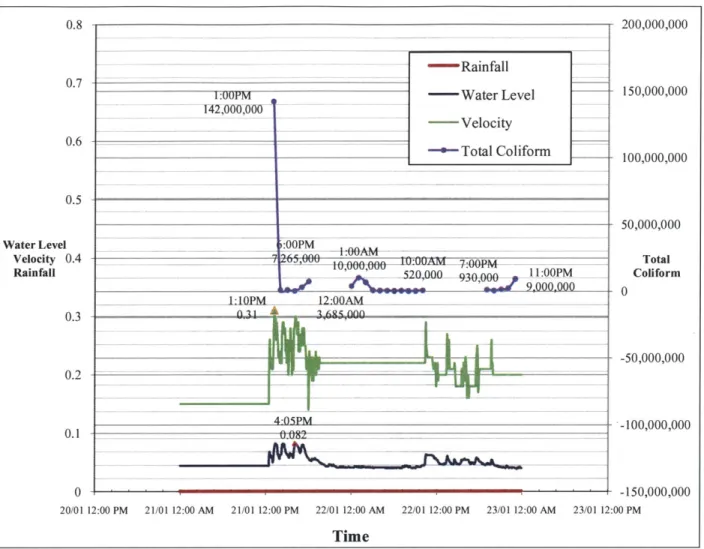
3.2 January & February 2009 18-Hour Water Sampling
Lee Li Jun (2009) collected first-flush storm-event samples at CP2 with the Isco 6712 Full-size Portable Autosampler (Teledyne Isco, Inc., Lincoln, NB) set to collect at 10-minute intervals and triggered to start collecting samples when water levels rose above 0.25 m. CP2 covers Peng Siang sub-catchment and is located at Choa Chu Kang Walk. The Peng Siang sub-catchment covers an area of 1300 ha and is 62% undeveloped area, 32% residential area, and 6% agricultural area. Lee chose the site because previous studies (Tay et al., 2008) had shown that
CP2 had the highest bacteria level count. Analysis of samples collected during dry weather
shows both E. coli and enterococci bacterial concentration peaks at around 12:00 pm whereas results from the wet weather samples showed first-flush effects and higher total coliform and E. coli concentrations. Lee also concluded that this meant nonpoint source pollution was of importance at KC2.
0.8 200,000,000 -Rainfall 0.7- -1:00PM - Water Level 150,000,000 142,000,000 Velocity 0.6-- Total Coliform 100,000,000 0.5 50,000,000
Water Level :OOPM
Velocity 0.4 7 26,0P.0Total Rainfall 520,000 930,00 1 l:00PM Coliform 0.3 -50,000,000 0.2- - - -4-05PM -100,000,000 0.1 0.02 0 -- 150,000,000 20/01 12 00 PM 21/01 12:00 AM 21/01 12:00 PM 22/01 12:00 AM 22/01 12:00 PM 23/01 12:00 AM 23/01 12:00 PM Time
Figure 3.1: Averaged Total Coliform for 18 hour Dry Weather Sampling during 21 & 22 Jan
2009 (Lee, 2009)
1,300,000 2:00PM - Water Level Velocity -Rainfall 800,000 0.5 -*- Total E.Coli 0.4 49,667000 Water Level 1 1 T
Velocity 30,000 10:00AM 71,0OPM
Rainfall 1:10PM 3,667 -200,000 0.2 4:05PM -700,000 0.1 U82 0 -1,200,000 20/01 12:00 PM 21/01 12:00 AM 21/01 12:00 PM 22/01 12:00 AM 22/01 12:00 PM 23/01 12:00 AM 23/01 12:00 PM Time
Figure 3.2: Averaged E. colifor 18 hour Dry Weather Sampling during 21 & 22 Jan 2009 (Lee,
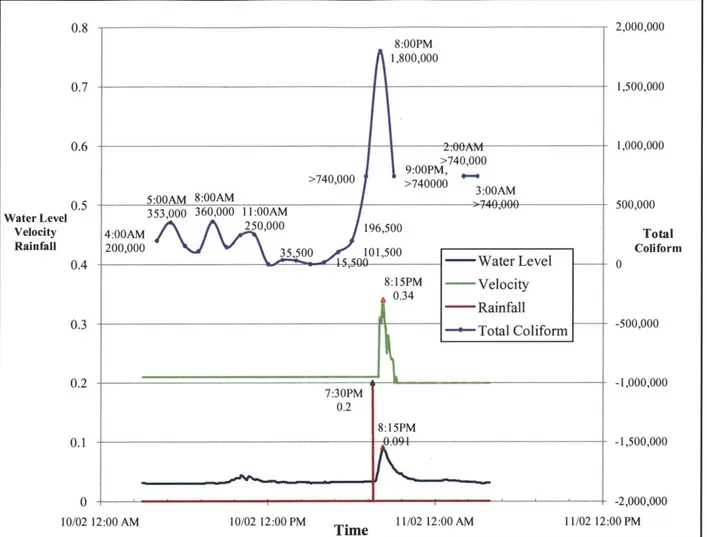
2,000,000 8:00PM 1,800,000 0.7 1,500,000 0.6 2.00AM 1,000,000 >740,000 9:00PM, 0.5 553 0 370,,11:00AM 8:000 500,000
Water Level 353,000 360,000 19:AM
Velocity 4:00AM 00 196,500 Total
Rainfall 200,000 35 500 101,500 Coliform 0.4 5,0- -Water Level - - 0 8:15PM ---- Velocity 0.34 - Rainfall -0,0 0.3 Total Coliform -500,000 0.2 -1,000,000 0.2 8:15PM 0.1 -1,500,000 0 -2,000,000 10/02 12:00 AM 10/02 12:00 PM . 11/02 12:00 AM 11/02 12:00 PM Time
Figure 3.3: Averaged Total Coliform for 18 hour Wet Weather Sampling during 10 & 11 Feb
2009 (Lee, 2009)
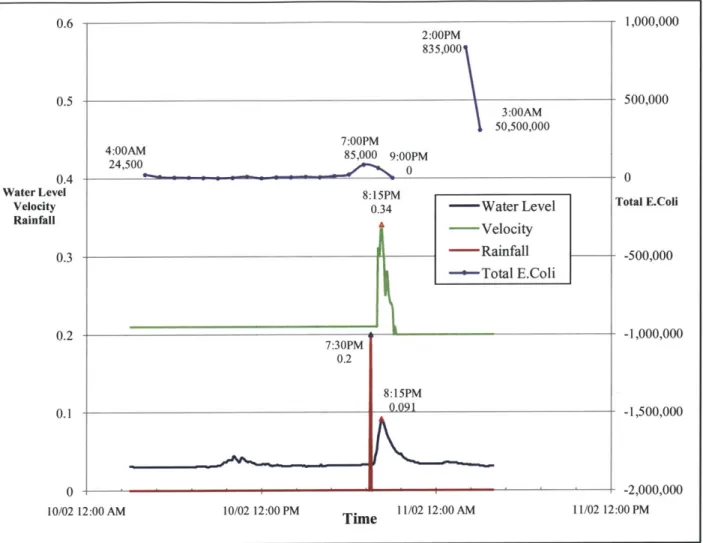
1,000,000
0 -2,000,000
10/02 12:00 AM 10/02 12:00 PM Time 11/02 12:00 AM 11/02 12:00 PM
Figure 3.4: Averaged E. colifor 18 hour Wet Weather Sampling during 10 & 11 Feb 2009 (Lee, 2009)
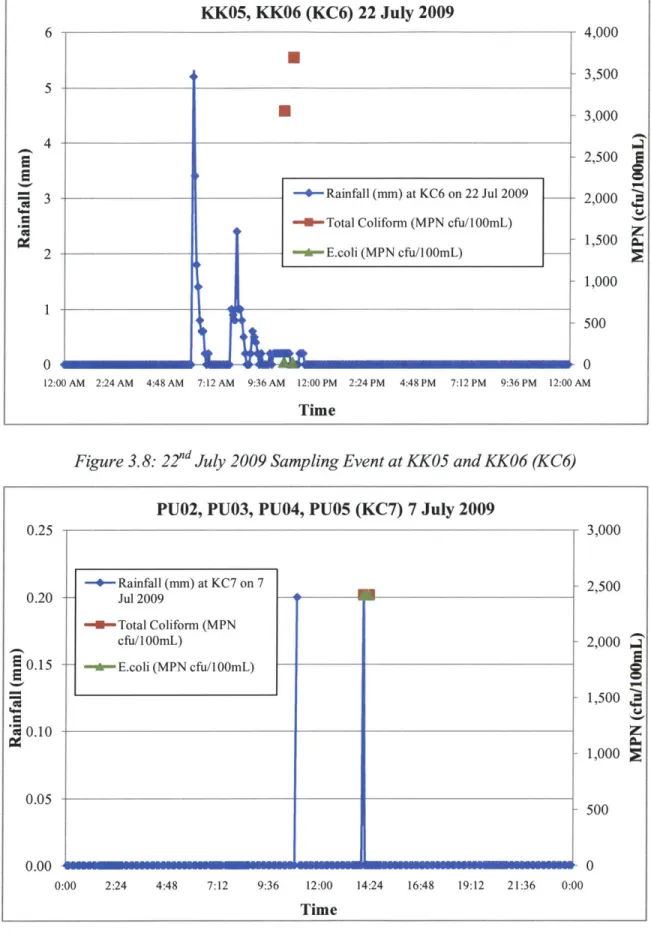
3.3 July 2009 Grab Sampling
Grab samples were collected by Jean Pierre Nshimyimana in July of 2009 (Nshimyimana, 2010).
Runoff samples were collected on 7th and 9th of July 2009 from KC7, 1 5th of July 2009 at KC 1,
KC2, KC3, KC5 and KC6, and 2 2nd of July 2009 from KC6. During the 2009 samplings, new
name codes were given to the sampling locations within the sub-catchments. The new labels are shown in Table 3.3. Bacterial concentrations were obtained from Jean Pierre and from Eveline Ekklesia. Rainfall data from KC 1, KC2, KC6 and KC7 was obtained from databases provided by
SysEng (S) Pte. Ltd. and Greenspan Pte. Ltd.. Although bacterial concentration data were
available for KC3 and KC5, rainfall data was not available as NTU did not have permission from
PUB to access the monitoring stations. Hence, those concentration values were not taken into
account for this report.
2:00PM 835,000 0.5 500,000 3:00AM 50,500,000 7:00PM 4:00AM 85,000 9:00P3M 0.4 0 - 024,500 0 Water Level 8:15PM
Velocity 0.34 - Water Level Total E.Coli
Rainfall Velocity 0.3 - Rainfall -500,000 0--Total E.Coli 0.2 -- 1,000,000 -1,500,000 7:30PM 0.2 8:15PM _________________________________ 0.091 ... . ... ..... . .... .. .... . . ....... . ... - --
---Table 3.3: New Names for 2009 Sampling
Sub-catchment 2008 NTU Sites 2009 Sampling Locations
Peng Siang KC1 PBO1
Peng Siang KC2 PS01
Tengah KC3 THO1
Neo Tiew KC5 NTO1, NTO2
Kangkar KC6 KKO1,KK05, KK06
PUO2, PUO3, PUO4, PU05, PU06,
Pang Sua KC7 PUO7, PUO9, PUO9, PU10, PUl l
Nshimyimana's raw data for January, June-July 2009 and January 2010 from his Kranji Catchment Singapore Field Data Sheet was acquired and reviewed. Samples collected in January
2009 were confirmed to be dry-weather samples because all of them were collected outside of
storm events. Sampling events in July 2009 were highlighted and reevaluated to ascertain if they fell into the storm sampling category based on field observations written in the notes and also on rainfall data. Several of the sampling events were carried out during rainfall events and others were collected before, after, or close to rainfall events. Unfortunately, sampling times for June
2009 and January 2010 samples were not available in the field data sheet. Hence, those sets of
bacterial samples could not be evaluated. Figures 3.5 to 3.10 show the sampling events which were possible wet-weather data.
PBO1 (KC1) 15 July 2009
-- Rainfall (mm) at KCl on 15 Jul 2009 -4-Total Coliform (MPN cfu/1OOmL) -- E.coli (MPN cfu/lO0mL) -mmw 3,000 2,500 2,000 ' 1,500 1,000 2 500 0.25 0.20 0.15 0.10 0.05 0.00 12:00 AM 2:24 AM 4:48 AM 7:12 AM 9:36 AM 12:00 PM 2:24 PM 4:48 PM 7:12 PM 9:36 PM 12:00 AM Time
Figure 3.5: 1 5th July 2009 Sampling Event at PBO (KC)
0
PS01 (KC2) 15 July 2009
1.6
1.4
1.2 - Rainfall (mm) at KC2 on 15 Jul 2009 --- 0
1.0 --- -- Total Coliform (MPN cfu/1OOmL) - 5- 0
-r- E.coli (MPN cfu/1OOmL) A 2 2000-400,000 350,000 300,000 250,000 200,000 150,000 100,000 50,000 0 12:00 AM 2:24 AM 4:48 AM 7:12 AM 9:36 AM 12:00 PM 2:24 PM 4:48 PM 7:12 PM 9:36 PM 12:00 AM Time 0.6 0.4 0.2 0.0
Figure 3.6: 1 5th July 2009 Sampling Event at PS01 (KC2)
KK01 (KC6) 15 July 2009
0.9 50,000
1~
0.5-
S
I
-+-Rainfall (mm) at KC6 on 15 Jul 2009 -U-Total Coliform (MPN cfu/1OOmL) -__ -- E.coli (MPN cfu/10mL) A -- -- --- --- 0 50,000 45,000 40,000 35,000 30,000 25,1000 20,000 15,000 10,000 5,000 0 AM 0.9 0.8 0.7 0.6 0.5 0.4 0.3 0.2 0.1 0.0 12:0 z 2:24 AM 4:48 AM 7:12 AM 9:36 AM 12:00 PM 2:24 PM 4:48 PM 7:12 PM 9:36 PM 12:00 Time
Figure 3.7: 1 5th July 2009 Sampling Event at KKO (KC6)
34
.... .... ...
KK05, KK06 (KC6) 22 July 2009 6 4,000 3,500 5 3,000
4
o - 2,500 3 ____________-+- Rainfall (mm) at KC6 on 22 Jul 2009 2,000-8- Total Coliform (MPN cfu/1OOmL)
1,500 2 -*-E.coli (MPN cfu/10mL) -1,000 1 500 0 M 0
12:00AM 2:24AM 4:48AM 7:12AM 9:36AM 12:00PM 2:24PM 4:48PM 7:12PM 9:36PM 12:00AM
Time
Figure 3.8: 2 2"d July 2009 Sampling Event at KKO5 and KK06 (KC6)
PU02, PU03, PUO4, PU05 (KC7) 7 July 2009
0.25 3,000
-+- Rainfall (mm) at KC7 on 7 - 2,500
0.20 Jul 2009
-- Total Coliform (MPN
cfu/1OOmL) - 2,000 3
0.15 -- E.coli (MPN cfu/1 OOmL)
1,500 0.10 1,000 0.05 500 0.00 --- -0 0:00 2:24 4:48 7:12 9:36 12:00 14:24 16:48 19:12 21:36 0:00 Time
Figure 3.9: 7th July 2009 Sampling Event at PUO2, PU03, PUO4, PU05 (KC7)
PU06, PUO7, PU09, PU09, PU10, PU11 (KC7) 9 July 2009 4.0 3,000 3.5 2,500 3.0 _ -+- Rainfall (mm) at KC7 on 9 Jul 2009 2,000 2.5
--1-Total Coliform (MPN cfu/O0mL)
E 2.0 --- E.coli (MPN cfu/100mL) 1,500 * 1.5 -1,000 1.0 500 0.5 0.0 0 0:00 2:24 4:48 7:12 9:36 12:00 14:24 16:48 19:12 21:36 0:00 Time
Chapter 4: January 2011 Field Work
January 2011 field work was planned by Eveline Ekklesia and carried out by Ryan Bossis, Genevieve Ho, and Yangyue Zhang. Three sampling locations were pre-selected for the field
work. Manual sampling by the students took place from 4th January 2011 to 1 8th January 2011
and lasted from 8:00 am to 7:00 pm whereas an autosampler was configured to detect discharge
levels and automatically start collecting samples during the storm event on 8th February 2011.
4.1 Sampling Locations
Sampling locations were selected by Eveline Ekklesia. They were selected to be representative of high-density residential (HDR) areas, also known as Housing Development Board (HDB) areas, low-density residential (LDR) areas, and commercial areas. Factors considered when choosing the sites included total area covered, percentage of land usage being represented, and dry weather flow level to meet sample volume requirements.
The first selected site was Choa Chu Kang (CCK) Crescent (N 1 24'4.8" E 103045'34.2") which is the outlet point for drainage from an overall area of 37 hectares, and is 84% HDR (Figure 4.1). The name code for CCK Crescent was KC whereby K stood for Kranji and C stood for CCK
Crescent. HDR areas at CCK Crescent consisted of high-rise flats and several grocery stores. The specific sampling site was a covered drain that flowed into the canal and is shown in Figure 4.2. The second site was Verde (N 1023'29.9" E 103'45'9.7"), shown in Figures 4.3 and 4.4, which drains an overall area of approximately 7 hectares and is 76% LDR. The name code for Verde samples was KV. Verde's neighborhood consisted of landed houses such as terrace houses and semi-detached houses. The sampling site was the outlet point of drainage discharging into the same canal as CCK Crescent.
The last site (Figures 4.5 through 4.7) was Bras Basah (N 1*18'13", E 103051'12") which drains an area of 16 hectares and is 65% commercial area. More specifically, the location was surrounded by Hindu and Buddhist temples, an art gallery, a shopping complex, several eateries, office buildings, parking garages, and hotels. Bras Basah is located at Singapore's Historic District and is also densely populated. Bras Basah samples were coded MB, with M standing for the Marina Catchment.
CCK Crescent and Verde are both in Kranji Catchment and are within the catchment drained by gauging station KC7 whereas Bras Basah is located in Marina Catchment and is in the area tributary to gauging station MC 11.
Figure 4.1: Catchment Area of Choa Chu Kang Crescent (Streetdirectory, 2010)
Figure 4.2: Author Conducting Field Sampling and View of High Density Residential Properties at Choa Chu Kang Crescent (Photographs by Eveline Ekklesia and Ryan Bossis)
Samplng Site KV
Figure 4.3: Catchment Area of Verde (Streetdirectory, 2010)
Figure 4.4: MIT Student Conducting Field Sampling and Image of Low Density Residential Properties at Verde (Photographs by Eveline Ekklesia and Ryan Bossis)
-Figure 4.5: Catchment Area of Bras Basah (Streetdirectory, 2010)
Figure 4.6: NTU and MIT Students Sampling at Bras Basah and Drain Sampled
.
Figure 4.7: Bras Basah Commercial Area
4.2 Collection of Dry Weather Samples
Dry weather samples were collected every hour on site. Samples were collected using an adjustable Nasco Sampling Pole for Whirl-Pak@ bags and a sterile Nasco 500-mL Whirl-Pak@ bag (Nasco, Fort Atkinson, WI). The Whirl-Pak@ bag was fixed to the pole using a retainer ring and the pole could be extended from six to 12 feet as needed. Two 1 00-mL and one 50-mL Whirk-Pak@ thio-bags (all sterile) were filled for every sampling time and stored in an ice box to be sent to the laboratory for analysis. Bags were labeled with location names, day of sampling, and time of sampling. Sterile gloves were used throughout the sampling process. Conductivity, salinity, and pH were measured with a YSI meter and recorded. Samples were collected at CCK
Crescent on the 4th and 19th of January 2011, at Verde on 6 th and 1 2 th January 2011, and at Bras
Basah on 1 0th and 1 8th January 2011.
4.3 Wet Weather Sampling
The most reliable kind of sampling is usually carried out manually with the requirement that field personnel understand the methods and are on time with the sampling (Wanielista and Yousef, 1993). However, storm events are hard to predict in the Singaporean climate. Although thunderstorms are usually predicted in the afternoons, they are typically very scattered. Therefore, autosamplers are sometimes used for convenience and are set to collect samples when
the water level rises to a certain level. In the event of wet weather at Bras Basah on the 10th of
January 2011, samples were collected every 20 minutes or 30 minutes by MIT students depending on intensity of rainfall. Wet weather samples were collected using the Nasco Sampling Pole. The Isco Model 3700 Sampler (Teledyne Isco, Inc., Lincoln, NB) was used to
collect wet weather samples at Verde on 8th February 2011. The autosampler was triggered to
collect samples when water levels reached 5.5cm at a time interval of 10 minutes. Rainfall and