Publisher’s version / Version de l'éditeur:
Proceedings of the ISCA 2nd International Conference on Bioinformatics and
Computational Biology, BICoB-2010, p. 86, 2010
READ THESE TERMS AND CONDITIONS CAREFULLY BEFORE USING THIS WEBSITE.
https://nrc-publications.canada.ca/eng/copyright
Vous avez des questions? Nous pouvons vous aider. Pour communiquer directement avec un auteur, consultez la
première page de la revue dans laquelle son article a été publié afin de trouver ses coordonnées. Si vous n’arrivez pas à les repérer, communiquez avec nous à PublicationsArchive-ArchivesPublications@nrc-cnrc.gc.ca.
Questions? Contact the NRC Publications Archive team at
PublicationsArchive-ArchivesPublications@nrc-cnrc.gc.ca. If you wish to email the authors directly, please see the first page of the publication for their contact information.
NRC Publications Archive
Archives des publications du CNRC
This publication could be one of several versions: author’s original, accepted manuscript or the publisher’s version. / La version de cette publication peut être l’une des suivantes : la version prépublication de l’auteur, la version acceptée du manuscrit ou la version de l’éditeur.
Access and use of this website and the material on it are subject to the Terms and Conditions set forth at
Identification of Similarities among MS/MS Spectra from Human Brain
Barton, Alan; Haqqani, Arsalan S.; Valdés, Julio J.
https://publications-cnrc.canada.ca/fra/droits
L’accès à ce site Web et l’utilisation de son contenu sont assujettis aux conditions présentées dans le site LISEZ CES CONDITIONS ATTENTIVEMENT AVANT D’UTILISER CE SITE WEB.
NRC Publications Record / Notice d'Archives des publications de CNRC:
https://nrc-publications.canada.ca/eng/view/object/?id=44bca238-c6b8-400f-9248-1798595d725b https://publications-cnrc.canada.ca/fra/voir/objet/?id=44bca238-c6b8-400f-9248-1798595d725bIdentification of Similarities among MS/MS Spectra from Human Brain
Alan J. Barton
1, Arsalan S. Haqqani
2and Julio J. Vald´
es
11
National Research Council Canada
2National Research Council Canada
Institute for Information Technology
Institute for Biological Sciences
1200 Montreal Road, Ottawa, ON, Canada
100 Sussex Drive, Ottawa, ON, Canada
Abstract
Human brain samples are used for an investiga-tion of three spectra similarities that are useful within machine learning techniques such as supervised near-est neighbour approaches. Such bioinformatic pattern recognition of biological data leads to an MS/MS based methodology to both potentially increase peptide iden-tification and to identify post-translational modifica-tions without theoretical database search.
1
Introduction
Mass spectrometry (MS) is a method of choice in the field of proteomics for identification of proteins and peptides in complex biological samples. Recent advances in the field have enabled generation of thou-sands to hundreds of thouthou-sands of tandem mass spec-tra (MS/MS) within an hour. One spectrum corre-sponds to one peptide sequence. The latter may be determined manually, which is a very time consum-ing process, or automatically usconsum-ing software such as MASCOT or Sequest, which are publicly available and are common database search tools. Successful peptide identification is very low (< 30%) even with the most accurate MS instruments. In other words, associating a peptide sequence to an MS/MS spectra is difficult. Contributing factors are: i) absence of the peptide in the database (e.g. perhaps the peptide is novel) and/or ii) presence of post-translational modifications (PTMs) in the observed spectra. An investigation of human brain samples using three different methods to compare MS/MS spectra is made. In particular, the goals are to: i) find similar spectra between two bi-ological samples and ii) find slightly altered experi-mental spectra due to post-translational modifications between treated and untreated brain samples. Use of MS/MS spectra to identify PTMs without search of a theoretical database has not been well explored.
2
Pairing MS/MS Spectra
The visualization of MS/MS spectra in a 3D space (an example is shown in the results section) uses very general visualization techniques [6], [7], [8], (see also http://www.hybridstrategies.com) and relies on a dissimilarity measure between pairs of spectra. In gen-eral, it is possible to transform a similarity Sij into a
dissimilarity Dij; two possibilities are: Dij = S1ij − 1
and Dij=p2 (1 − Sij). Figure 1 shows two examples
of matched spectra and three similarity scores. One sample is on the positive y-axis (e.g. treated brain sample) and another sample on the negative y-axis (e.g. untreated brain sample). For this study, the quality of the matchings is determined via manual ex-amination by a domain expert who reported true pos-itive (TP), false pospos-itive (FP), or undecided.
2.1
Histogram-based Similarity
A measure of similarity between two spectra (i and j) may be made by construction of their respective histograms (Hi, Hj) through the specification of i) a
bin width (w = 0.25Da) and ii) a histogram range (the interval [a..b], where a = 50.0Da and b = 2000.0Da). Hence: Sij = A − B A with A = n X k=1 max (Hi(k) , Hj(k)) B = n X k=1 [max (Hi(k) , Hj(k)) − min (Hi(k) , Hj(k))]
where Hx(k) is the number of m/z values within the
k-th bin for histogram Hx(x = i or x = j) and n = b−aw .
A related approach [4] uses i) both intensity and m/z information and ii) distributes values into more than one bin at a time.
(a) Identical peptide spectra (TP) with high scores
(b) Non-identical peptide spectra (FP) with low scores
Figure 1: Two examples paired MS/MS spectra mea-sured in different samples.
2.2
Maximum Flow-based Similarity
The maximal flow problem [1] and hence one of its implementations [2] may be used to define a simi-larity between two spectra (Siand Sj) in the following
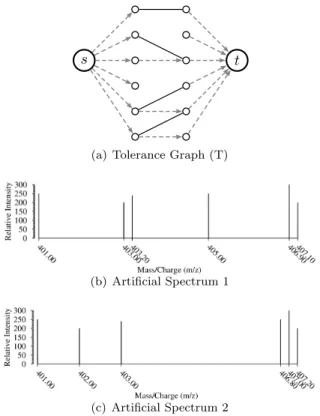
manner. A network flow graph G = (V, E) contains a vertex set V and an edge set E. G may be restricted to a Tolerance Graph T = (V, E), such as the one shown in Fig. 2(a). V = {s} ∪ {t} ∪ Vi∪ Vj where s
is the source, t is the sink, and Vi and Vj are vertices
constructed from Si and Sj. Each vertex v ∈ Vi∪ Vj
represents a m/z value. The edge set E = Es∪Em∪Et,
where Es= {(s, e) : e ∈ Vi}, Et= {(e, t) : e ∈ Vj} and
Em = {(ei, ej) : ei ∈ Vi and ej ∈ Vj}. Each edge
e ∈ E has a positive capacity. Flow emanates from s and is attracted towards t along each edge e ∈ E as long as capacity exists along e. A maximum network flow graph T′
⊂ T has maximum flow Fmax.
To define the similarity, all e ∈ Es∪ Ethave
ca-pacity 1 while e = (u, v) ∈ Em have a non-zero
ca-pacity equalling the count of m/z values satisfying: s(u, v) = |Sim/z − Sjm/z| < δm/z = 0.25Da. Figure
2(a) shows both T and Tm ⊂ T′ ⊂ T . A score may
then be defined to be Sij = FmaxN
i , where Ni is the
size of spectrum i. Other scores also exist that satisfy
s t
(a) Tolerance Graph (T)
(b) Artificial Spectrum 1
(c) Artificial Spectrum 2
Figure 2: Example T used within a maximum flow similarity measure. It is constructed from two spe-cific spectra and a tolerance δm/x= 0.25Da. Fig. 2(a)
shows one maximum matching with solid lines.
commutativity (i.e. Sij = Sji). For example,
Sij1 = Fmax max (Ni, Nj) , Sij2 = Fmax min (Ni, Nj)
Since Fmax≤ min (Ni, Nj) then Sij1 will have a
maxi-mum value of 1 only when Ni = Nj meaning that all
m/z values from one spectrum can be matched to the other (and vice versa). Whereas S2
ij will have a
maxi-mum value of 1 if Fmax = min (Ni, Nj) meaning that
all m/z values can be matched for at least one spec-trum to the other, but not necessarily for both. S1
ij is
investigated.
For example, the graph T in Fig. 2 contains edges from source node s to 6 nodes (each representing a unique m/z value in Fig. 2(b)) and then 6 nodes for the m/z values in Fig. 2(c) that are close enough to the m/z values in Fig. 2(b) followed by edges to node t. Each edge in T is assigned a weight of 1 (other pos-sibilities exist for weight assignment such as: i) inverse distanced-based, ii) fuzzy-based measures, etc.). Then maximum flow is computed from s to t and found (it is 4 in this case) in order to determine a maximum matching from Spectrum 1 to Spectrum 2. This leads to the computation of one possible maxflow-based sim-ilarity, which is 4/6 = 0.6.
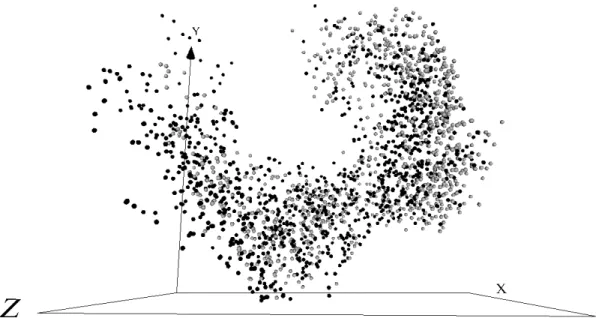
Figure 3: Static 3D representation for all n = 2, 835 MS/MS spectra. Light Grey spheres: treated (interleukin-1-beta) brain sample containing 1, 409 spectra. Black spheres: untreated brain sample containing 1, 426 spectra. Dissimilarity Measure: Kolmogorov-Smirnov. Optimizer: Fletcher-Reeves. Sammon error: 0.019838 computed over a dissimilarity matrix containing (n2− n)/2 = 4, 017, 195 values in the range [0.000, 5.887]. Seed: 1195514469
Figure 4: Distributions of the scores for the three investigated similarity measures when MS/MS spectra were matched between the treated (state I) and untreated (state J) brain samples.
2.3
Kolmogorov-Smirnov
D
Statistic-based Dissimilarity
The Kolmogorov-Smirnov test (non-parametric and distribution free) determines if two data sets dif-fer significantly [5]. The maximum difference be-tween cumulative prob. distributions SNi and SNj is:
DStat ij = −∞<x<∞max SNi(x) − SNj(x) . Differing sizes is solved using an effective size Ne
ij. The dissimilarity (Dij) is: Dij = DijStat q Ne ij, N e ij = NiNj Ni+ Nj .
3
Experimental Settings
Proteins from human brain endothelial cells in two different biological states - untreated (state I) and interleukin-1-beta treated (state J) - were isolated and digested into peptides [3] and analyzed by nanoLC-autoMS/MS on an LTQ XL linear trap mass spectrom-eter (Thermo) coupled to an MDLC chromatography system (GE Healthcare). MS/MS spectra for each bi-ological state were submitted to MASCOT search en-gine (Matrix Science Ltd., London, U.K.) [3].
4
Results and Discussion
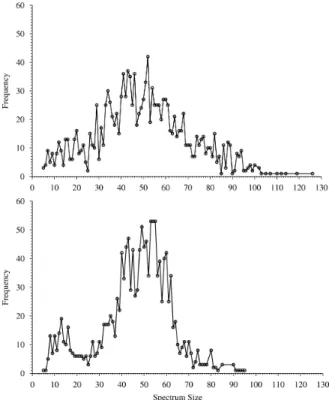
The distributions of the sizes of the MS/MS spec-tra are shown in Fig. 5 and indicate a marked dif-ference between treated and untreated brain samples. From another perspective, the overall structure of the spectra data, in which a 3 dimensional representation was constructed using a dissimilarity matrix contain-ing elements computed via the Kolmogorov-Smirnov D statistic is shown in Fig. 3. The space can be seen to contain spectra from both untreated and treated brain samples spread throughout. This demonstrates that a highly nonlinear separating function would be required in order to differentiate the samples based on the MS/MS spectra. In other words, the light grey spheres and the black spheres are very thoroughly mixed. However, it can be seen that the right region of the space contains more light grey spheres (spectra associated to treated brain) than the left. Both figures demonstrate that the treatment does have an overall effect on the brain, but that the specific manner and degree needs to be determined with more detailed fu-ture studies.
An investigation of the three similarity measures is shown in Fig. 4. The 1, 409 spectra from the untreated brain sample (297 identified by MASCOT ≈ 21%) were matched with the 1, 426 spectra from
Figure 5: Distributions for all 2, 835 MS/MS spectra sizes. Top: Untreated sample with 1, 409 spectra. Bot-tom: Treated sample with 1, 426 spectra.
the treated brain sample (170 identified by MAS-COT ≈ 12%). Multiplication reveals 2, 009, 234 po-tential pairings. The investigated measures all paired ≈ 7, 000 spectra indicating > 99.95% of the pairings were discarded; a significant savings. The domain ex-pert then manually validated the ≈ 7, 000 pairings for each measure and classified them as TP match, FP match, or undecided match. For example, Fig. 4 re-ports (520/656) · 100 ≈ 80% of the TP were not iden-tified by MASCOT, which is true for all 3 measures.
It is observed that < 10% are true positives (TP) and 56 − 58% are false positives (FP). The remain-ing are not known to be TP or FP. Further inves-tigation is required, although many appear to have PTMs (see below). An example of a TP and a FP matching is shown in Fig.1(a) and Fig.1(b), respec-tively. Similarity scores correlated to the TP or FP nature for all three methods, although the correlation was higher for “Histogram” and “MaxFlow” than for “KS” (Fig.4). A 2% overlap for the former two meth-ods leads to TP and FP separation. For “KS”, scores are higher, but > 95% of TP and FP scores overlap leading to poor discrimination ability. Submission of all TP spectra to Mascot results in 20−25% being iden-tified as identical peptides (the remaining TPs were missed). However, the missing TPs could be identified
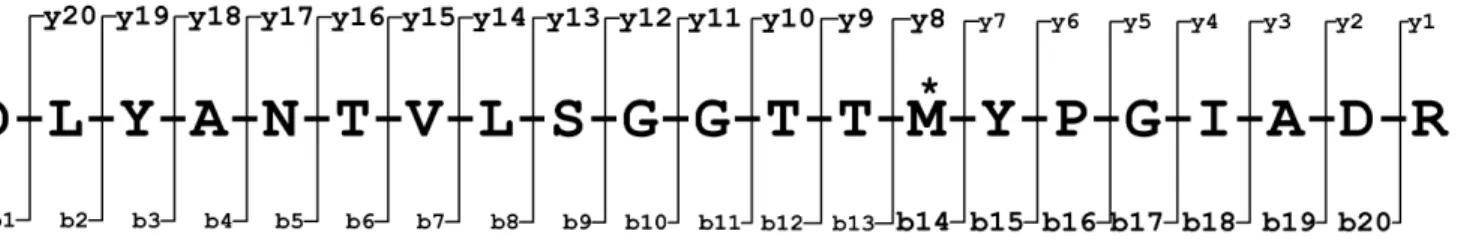
(a) Theoretical fragmentation of peptide showing expected b- and y-ions and location of PTM.
(b) Experimental MS/MS spectra showing actual fragmentation for biological states I and J. State I intensities increase on the positive y-axis while state J intensities are a reflection and increase on the negative y-axis.
Figure 6: Post-translational modification (oxidation) on amino acid residue methionine (M) results in a shift of all fragment ions from y8 to y20 and b14 to b20 by 16 daltons; shown both theoretically (Fig.6(a)) and experimentally (Fig.6(b)). A spectra is identified if the sequence reported by MASCOT has a score higher than 35.
by either “Histogram” or “MaxFlow” (see Fig.1(a) for example). Thus, a preliminary preprocessing imple-mentation (i.e. matching similar MS/MS spectra be-fore database search) has shown that > 250 spectra previously either false or low-score (or unidentifiable) identifications become correctly identified or identified with a 15 − 20 point score increase, respectively.
Identification of PTMs was the second goal. Initially, two spectra of a peptide were examined (Fig.6(b)) - one of which was previously determined to have a PTM (Fig.6(a)). Both “Histogram” and “MaxFlow” gave scores well below the 10th
per-centile of TP scores, whereas “KS” gave a high score (Fig.6(b)). Consequently, examination of high scoring TP matches identified several additional PTMs (some of which are absent in the protein database (unpub-lished data)). For all of these peptides, “Histogram” and “MaxFlow” gave low scores while “KS” gave high scores (as high as 0.75).
5
Conclusions
Three methods to compare MS/MS spectra were used. The “Histogram” and “MaxFlow” methods, when applied prior to database searching, significantly increased the rate of success for identification of pep-tides, since ≈ 80% were not identified by MASCOT. On the other hand, a hybrid “KS” method, one com-bining high “KS” values and low “Histogram” and “MaxFlow” values, shows great promise in identify-ing PTMs in peptide spectra without usidentify-ing database search engines. Further experiments are necessary in order to elaborate the specific details of treatment of interleukin-1-beta upon the brain.
Acknowledgments
Dr. Kelly (IBS), Dr. Famili (IIT) and Dr. Mau-reen O’connor (BRI) are thanked for their support.
References
[1] L.R. Ford and D.R. Fulkerson, Maximal Flow Through a Network. Canadian Journal of Math-ematics, 8:3 pp.399–404, 1956.
[2] A.V. Goldberg, An Efficient Implementation of a Scaling Minimum-Cost Flow Algorithm. Journal of Algorithms, 22, Article No. AL950805, pp.1–29, 1997.
[3] A.S. Haqqani, J. Kelly, E. Baumann, R.F. Haseloff, I.E. Blasig, D.B. Stanimirovic. Protein
markers of ischemic insult in brain endothelial cells identified using 2D gel electrophoresis and ICAT-based quantitative proteomics. Journal of Proteome Res. 6 pp. 226–39, 2007.
[4] J. Liu, B. Carrillo, C.M. Yanofsky, C. Beaudrie, F. Morales, R.E. Kearney, A novel approach to speed up peptide sequencing via MS/MS spec-tra analysis. In proceedings of the IEEE 27th
En-gineering in Medicine and Biology Annual Con-ference, pp. 4441–4444, September 1-4, Shanghai (China), 2005.
[5] W.H. Press, B.P. Flannery, S.A. Teukolsky and W.T. Vetterling. Numerical Recipes in C, Cam-bridge University Press, New York, 1986.
[6] J.J. Vald´es, Virtual reality representation of rela-tional systems and decision rules. In P. Hajek, ed-itor, Theory and Application of Relational Struc-tures as Knowledge Instruments, Meeting of the COST Action 274. Prague, Nov 2002.
[7] J.J. Vald´es, Similarity-based heterogeneous neu-rons in the context of general observational mod-els. Neural Network World, vol. 12(5) pp. 499– 508, 2002.
[8] J. J.Vald´es, Virtual reality representation of infor-mation systems and decision rules. Lecture Notes in Artificial Intelligence, vol. 2639 LNAI, pp. 615– 618. Springer-Verlag, 2003.