RENEWABLE RESOURCES• CASE STUDY
Life cycle assessment of soybean-based biodiesel
in Argentina for export
Luis Panichelli&Arnaud Dauriat&Edgard Gnansounou
Received: 23 April 2008 / Accepted: 13 November 2008 / Published online: 16 December 2008
# Springer-Verlag 2008
Abstract
Background, aim and scope Regional specificities are a key factor when analyzing the environmental impact of a biofuel pathway through a life cycle assessment (LCA). Due to different energy mixes, transport distances, agricul-tural practices and land use changes, results can signifi-cantly vary from one country to another. The Republic of Argentina is the first exporter of soybean oil and meal and the third largest soybean producer in the world, and therefore, soybean-based biodiesel production is expected to significantly increase in the near future, mostly for exportation. Moreover, Argentinean biodiesel producers will need to evaluate the environmental performances of their product in order to comply with sustainability criteria being developed. However, because of regional specific-ities, the environmental performances of this biofuel pathway can be expected to be different from those obtained for other countries and feedstocks previously studied. This work aims at analyzing the environmental impact of soybean-based biodiesel production in Argentina for export. The relevant impact categories account for the primary non-renewable energy consumption (CED), the global warming potential (GWP), the eutrophication potential
(EP), the acidification potential (AP), the terrestrial ecotox-icity (TE), the aquatic ecotoxecotox-icity (AE), the human toxecotox-icity (HT) and land use competition (LU). The paper tackles the feedstock and country specificities in biodiesel production by comparing the results of soybean-based biodiesel in Argentina with other reference cases. Emphasis is put on explaining the factors that contribute most to the final results and the regional specificities that lead to different results for each biodiesel pathway.
Materials and methods The Argentinean (AR) biodiesel pathway was modelled through an LCA and was compared with reference cases available in the ecoinvent® 2.01 database, namely, soybean-based biodiesel production in Brazil (BR) and the United States (US), rapeseed-based biodiesel production in the European Union (EU) and Switzerland (CH) and palm-oil-based biodiesel production in Malaysia (MY). In all cases, the systems were modelled from feedstock production to biodiesel use as B100 in a 28 t truck in CH. Furthermore, biodiesel pathways were compared with fossil low-sulphur diesel produced and used in CH. The LCA was performed according to the ISO standards. The life cycle inventory and the life cycle impact assessment (LCIA) were performed in Excel spreadsheets using the ecoinvent® 2.01 database. The cumulative energy demand (CED) and the GWP were estimated through the CED for fossil and nuclear energy and the IPCC 2001 (climate change) LCIA methods, respectively. Other impact categories were assessed according to CML 2001, as implemented in ecoinvent. As the product is a fuel for transportation (service), the system was defined for one vehicle kilometre (functional unit) and was divided into seven unit processes, namely, agricultural phase, soybean oil extraction and refining, transesterification, transport to port, transport to the destination country border, distribution and utilisation.
Responsible editor: Robert Anex L. Panichelli
:
E. Gnansounou (*) École Polytechnique Fédérale de Lausanne, LASEN-ICARE-ENAC,Station 18, EPFL,
1015 Lausanne, Switzerland e-mail: [email protected] A. Dauriat
ENERS Energy Concept, Av. Saint-Paul,
Results The Argentinean pathway results in the highest GWP, CED, AE and HT compared with the reference biofuel pathways. Compared with the fossil reference, all impact categories are higher for the AR case, except for the CED. The most significant factor that contributes to the environmental impact in the Argentinean case varies depending on the evaluated category. Land provision through deforestation for soybean cultivation is the most impacting factor of the AR biodiesel pathway for the GWP, the CED and the HT categories. Whilst nitrogen oxide emissions during the fuel use are the main cause of acidification, nitrate leaching during soybean cultivation is the main factor of eutrophication. LU is almost totally affected by arable land occupation for soybean cultivation. Cypermethrin used as pesticide in feedstock production accounts for almost the total impact on TE and AE. Discussion The sensitivity analysis shows that an increase of 10% in the soybean yield, whilst keeping the same inputs, will reduce the total impact of the system. Avoiding deforestation is the main challenge to improve the environ-mental performances of soybean-based biodiesel production in AR. If the soybean expansion can be done on marginal and set-aside agricultural land, the negative impact of the system will be significantly reduced. Further implementa-tion of crops’ successions, soybean inoculaimplementa-tion, reduced tillage and less toxic pesticides will also improve the environmental performances. Using ethanol as alcohol in the transesterification process could significantly improve the energy balance of the Argentinean pathway.
Conclusions The main explaining factors depend on regional specificities of the system that lead to different results from those obtained in the reference cases. Significantly different results can be obtained depending on the level of detail of the input data, the use of punctual or average data and the assumptions made to build up the LCA inventory. Further improvement of the AR biodiesel pathways should be done in order to comply with international sustainability criteria on biofuel production.
Recommendations and perspectives Due to the influence of land use changes in the final results, more efforts should be made to account for land use changes others than deforestation. More data are needed to determine the part of deforestation attributable to soybean cultivation. More efforts should be done to improve modelling of interaction between variables and previous crops in the agricultural phase, future transesterification technologies and market prices evolution. In order to assess more accurately the environmental impact of soybean-based biodiesel produc-tion in Argentina, further consideraproduc-tions should be made to account for indirect land use changes, domestic biodiesel consumption and exportation to other regions, production scale and regional georeferenced differentiation of production systems.
Keywords Agriculture . Argentina . Biodiesel . Explaining factors . Export . Land use changes . LCA . Modelling . Soybean-based biodiesel production
1 Background, aim and scope
Life cycle assessment (LCA) of biofuel production requires a country-specific approach due to the significant impor-tance of local conditions in estimating the energy consump-tion and the greenhouse gas emissions of the system. Some efforts have been put worldwide to determine country-specific and raw-material-country-specific biofuels environmental
impact (RFA 2008; Reijnders and Huijbregts 2008; Russi
2008; Zah et al. 2007; CONCAWE-EUCAR-JRC 2007;
Smith et al. 2007; Farrell et al. 2006; Gnansounou and
Dauriat 2005; VIEWLS 2005; Bernesson et al. 2004;
Elsayed et al. 2003; ADEME 2002; GM-LBST 2002;
Sheehan et al.1998).
However, due to different system boundaries, functional unit, allocation methods and other assumptions in LCA approaches, results are difficult to compare. The LCA of bioenergy products within the ecoinvent® 2.01 database is a first attempt to develop environmental impact factors for country-specific and feedstock-specific biofuel pathways
under a consistent methodology (Jungbluth et al.2007). A
structured and transparent methodology was applied to develop environmental impact factors for soybean-based biodiesel from Brazil (BR) and the United States (US), rapeseed-based biodiesel from the European Union (EU) and Switzerland (CH), palm-oil-based biodiesel from Malaysia (MY) and fossil diesel from Switzerland (CH). However, soybean-based biodiesel from Argentina (AR) was not included.
In the framework of biofuel research at LASEN, a biofuel platform was developed to test the influence of modelling choices in LCA results. The model is based on the ecoinvent® database and represents biofuel pathways from feedstock production to fuel utilisation. A first case study was developed using wheat-based bioethanol
produc-tion and utilisaproduc-tion in CH (Gnansounou et al. 2008). The
platform was then used to generate a detailed life cycle inventory (LCI) and LCA of soybean-based biodiesel from AR.
The Republic of Argentina is the first exporter of soybean oil and meal and the third largest soybean producer in the world, and therefore, biodiesel production from this source is expected to significantly increase in the next years, mostly for exportation. Nonetheless, a consistent life cycle approach was not yet applied to evaluate the environmental performance of this country-specific biofuel pathway.
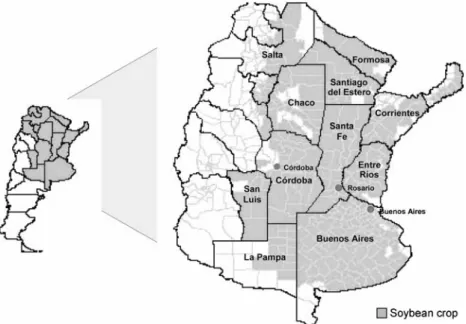
Argentina is the third largest vegetable oil producer in the world (5.40 Mt in 2005) and the first soybean oil exporter in the world (4.83 Mt in 2005; SAGPyA-IICA
2005). Soybean represents 53% of the country’s cultivated
area with grains, and 88% of this surface is concentrated in the central region of the country (Buenos Aires, Córdoba and Santa Fe) representing 83% of the national soybean
production (Fig.1).
Soybean oil is mainly exported to China (36%), India
(21%) and Bangladesh (5%; Franco 2005a), and together
with sunflower oil, it represents 99% of the national average milling capacity. In 2004, 47 vegetable oil mills were operating and concentrated mainly in Santa Fe (72%), Buenos
Aires (15%) and Cordoba (11%; Ciani and Esposito2005). At
present, there are eight biodiesel production plants installed
in Argentina, with a production capacity of 600 kt year−1of
biodiesel. Of the total production, 318 kt of biodiesel was exported in 2007, from which 76% were destined to the US and 23% to the EU. The production capacity is expected to
double by the end of 2008 (SAGPyA2008).
An increased interest in biofuel production in Argentina has been observed in recent years. Argentina has been ranked as the third country in the world with the highest potential for biodiesel production (Johnston and Holloway
2007). This statement relies on the availability of soybean oil
for export, the low production costs and the good socioeco-nomic conditions. The biodiesel production potential is of
5.26 Bl, accounting for 51% of the country’s diesel demand.
The Argentinean government has established a 5% mandatory blending of biofuels in conventional fuels for transportation by 2010. The main feedstock is expected to be soybean due to the large availability of this product in the country. If so, 650 Ml of soybean-based biodiesel (i.e. 3.5 Mt of soybeans
and 1.2 Mha) will be required to comply with the national
obligation (SAGPyA-IICA 2005). Moreover, due to the
exporting structure of Argentinean commodities, biodiesel production is seen as an opportunity to expand the exports portfolio. Even though biodiesel production is still incipient, it is expected to grow rapidly due to the mandatory blending law, the increased international demand for biofuels, the availability of feedstock and the high agro-exporting efficiency of the vegetable oil sector. These factors determine competitive costs for biodiesel production.
On the other hand, current initiatives, especially in the
US (Farrell and Sperling2007a,b) and the EU (Bauen et al.
2007; Cramer et al. 2007), to account for sustainability
aspects of biofuel production may constrain the exporting opportunities of Argentinean biodiesel. A key criterion is the greenhouses gas (GHG) emission balance of the biofuel. Therefore, the aim of this paper was to evaluate the position of Argentina as a producer of sustainable biodiesel in comparison with other worldwide suppliers.
This study aims at determining the environmental impact of vegetable oil methyl ester (VOME) production from soybean culture in Argentina for export (B100soyARG-CH) through a LCA. The biodiesel pathway is modelled up to the exportation port, as results can significantly change depending on the destination country. However, for purposes of comparison with the reference systems and in order to illustrate the impact of the transportation and the utilisation phase, the biodiesel pathway was also modelled for export to Switzerland.
Emphasis is put on the modelling of the Argentinean case and in understanding the main factors that influence the final results and that explain the main differences between producing countries.
Fig. 1 Soybean production area in Argentina. Adapted from SAGPyA (2006a)
2 Materials and methods
The LCA was performed according to the ISO standards on
LCA (ISO2006a,b) and to the main steps described in ISO
norm 14041. The LCI and the life cycle impact assessment (LCIA) were performed in the biofuel platform model developed at LASEN integrating Microsoft Excel® spread-sheets and using the ecoinvent® 2.01 database (Frischknecht
et al.2004; Frischknecht2005).
2.1 Key parameters, assumptions and data quality
The system was defined from a well-to-wheels approach.
The functional unit is‘1 km driven with diesel by a 28 t
truck’. The function of the system is to deliver ‘fuel for transportation’. The LCIA methods are non-renewable cumulative energy demand (CED) for the CED, IPCC 2001 GWP 100a (climate change) for GWP, CML 2001 generic for eutrophication potential (EP), CML 2001 generic for acidification potential (AP), CML 2001 TAETP 100a for terrestrial ecotoxicity (TE), CML 2001 FAETP 100a for aquatic ecotoxicity (AE), CML 2001 HTP 100a for human toxicity (HT) and CML 2001 for land use competition (LU), available in the ecoinvent® 2.01 database. The system description is valid for soybean-based biodiesel in Argentina (country-specific approach) and for a time framework 2006–2010, as technologies, prices and produc-tion methods are assumed to change in the medium term.
The reference biodiesel pathways are those available from the ecoinvent® 2.01 database, and the reference systems are described as follows:
& B100soyBR-CHsoybean-based VOME produced in BR
and used in CH;
& B100soyUS-CH soybean-based VOME produced in the
US and used in CH;
& B100rapeEU-CHrapeseed-based VOME produced in the
EU and used in CH;
& B100rape CH-CH rapeseed-based VOME produced in
CH and used in CH;
& B100palm MY-CHpalm-based VOME produced in MY
and used in CH;
& D100fossil CH-CH fossil diesel produced and used in
CH.
Rapeseed production for biodiesel in Switzerland is calculated as an average of different agricultural production methods, namely, organic (1%), extensive (28%) and integrated (71%) production. Rapeseed production in the European Union corresponds to conventional rapeseed production in Germany.
Economic allocation was based on market values. Soybean oil and soybean meal allocation was based on international market prices, as these products are exported.
However, as glycerine is destined to national consumption,
national market price was used. B100soyARG-CH market
price was assumed to be that of US VOME.
Although the ISO norm recommends subdividing the system or performing system expansion as methods instead of allocation, economic allocation has been chosen essentially because soybean meal is a commodity with a defined market value. Moreover, the decision was taken in coherence with the ecoinvent database for
bioenergy products (Jungbluth et al. 2007) where
alloca-tion of environmental impacts between co-products is based on the respective prices of co-products. Nonetheless, sensitivity analysis was performed for allocation based on energy content, mass and carbon content to evaluate the variability of results with regard to this key methodological parameter.
Only carbon dioxide (CO2), methane (CH4) and nitrous oxide (N2O) emissions are considered for GWP assessment. Emissions from land use change other than direct defores-tation are excluded due to lack of data.
The quality of the used data is consistent with the objectives of the study. However, since the production of biodiesel in Argentina so far remains a marginal activity, transesterification data are based on average international technology, consistent with the information found in ecoinvent®. Agricultural data are specific to the Argentinean context. Vegetable oil production and transesterification, however, were adapted to the Argentinean context with data from the US and average European reference cases
(Jungbluth et al.2007).
Soybean yield per hectare is based on the average yield from the last five available harvesting periods (2000/2001– 2004/2005). Transport distances are based on average distances and do not correspond to a specific case. No data was available for the soybean intermediate storage and drying phase. Consequently, this stage was not considered in the system boundaries, and it was assumed to take place only at the vegetable oil extraction plant.
The relevance of the data quality was studied through sensitivity analysis of key input values with a significant impact on the final results.
2.2 System description and inventory data
The Argentinean soybean-based biodiesel pathway was divided into seven unit processes, namely, agricultural phase (soybean production), soybean oil extraction and refining (oil production), transesterification of soybean oil (VOME production), VOME transport to port in AR, VOME transport from port to the Swiss border, VOME distribution in CH and VOME use in CH. The listed inputs and outputs are the ones necessary to evaluate the selected impact categories.
The AR agricultural phase is specifically detailed and based on national values. Due to lack of data in oil extraction and transesterification, these processes were constructed on the US case, but adapted to the AR context. The country-specific data are detailed in the following sections.
2.3 Soybean production
The characteristics of the production system are estimated as averages based on the four soybean production systems in Argentina: first- and second-class soybean in reduced tillage (FCRT and SCRT) and first- and second-class soybean in conventional tillage (FCCT and SCCT).
The distribution of the total production between the systems is 49.3%, 30.6%, 14.7% and 5.4%, respectively (SAGPyA
2006a). The average soybean yield is 2,591 kg ha−1
(SAGPyA2006a) and is calculated as the weighted average
yield of the four production systems with regard to their respective shares of national production.
First class soybean is grown between October/November (sowing) and April/May (harvesting), corresponding to the optimal growing period for soybean in Argentina. The soybean cycle lasts for 6 months, and the land is then left and set aside during the winter (crop succession of set-aside land-soybean). Second-class soybean is grown between December (sowing) and April/May (harvesting), after
wheat (crop succession of wheat–soybean). Therefore,
soybeans of shorter growing cycle are used. Wheat is grown between June/July and December (harvesting) and soybean is sowed at the same time wheat is harvested. This allows having two crops per year on that land. However, as first class soybean is grown in the optimal period, higher yields are obtained compared with second-class soybean.
Both first- and second-class soybeans are grown in monoculture as well as in rotation with corn or sunflower. However, no data is available of the proportion of each soybean type done in monoculture and in rotation.
Phosphate fertilisers are imported from US, Russia, Lithuania, Morocco and Tunisia. NPK formulations are
imported from Brazil and Uruguay (SAGPyA 2006b).
Pesticides and fertilisers are available at regional storage (port of Rosario) and are transported over 300 km in 28 t trucks to the local area and 30 km by tractor or trailer to the
field (SAGPyA 2006b). Soybeans are transported over
30 km by tractor to the regional storage. Seed input varies depending on the production method, being 75, 70, 80 and
70 kg ha−1for FCRT, SCRT, FCCT and SCCT, respectively.
Land occupation is estimated as 1 year for first-class soybean (only soybean) and 0.5 year for second-class soybean (soybean–wheat production). Soybean area has increased from 10.7 Mha in 2000 to 15.3 Mha in 2005
(4.7 Mha; SAGPyA,2006a), displacing other crops (32%),
mainly wheat, corn, sunflower and sorghum, pasture land
(27%), savannas (19%) and forest (22%; Benbrook 2005;
Gasparri et al.2008; Montenegro et al.2005; Paruelo et al.
2005). The land use is assumed arable land and
transfor-mation from arable land, shrub land, pasture and forest. Deforestation for soybean cultivation occurs in Salta, Chaco, Tucumán and Santiago del Estero (Grau et al.
2005; Gasparri and Manghi 2004) at an average rate of
258,406 ha year−1 for the period 2000–2005. GHG
emissions from deforestation are estimated as the emission from land provision and the emission from carbon stock change in soil, as implemented in ecoinvent®, and totally allocated to the use as agricultural land. Soybean is assumed to be cultivated in deforested areas during 2 years. Land provision is estimated based on the deforested area between 2000 and 2005 (1,550,435 ha of the Chaco seasonally dry forest and 72,000 ha of the evergreen and
semi-evergreen Yungas forest; Gasparri et al. 2008) and a
rate attributed to soybean expansion (64% of the total deforested area in the Northeast of Argentina; Pengue
2005). CO2 emissions from carbon stock change in soil
(55 t CO2ha−1year−1) and biomass (193 t CO2ha−1year−1)
were calculated by Gasparri et al. (2008) based on the IPCC
Good Practice Guidance for LULUCF and the bookkeeping
method (Houghton 2003). Carbon loss from soil after
deforestation is estimated based on carbon stock change in
soil from forest conversion to agricultural land (15 t C ha−1
year−1; Gasparri et al.2008). Carbon stock change in soil
represents only 7% of the total emission from land use conversion. Emissions from biomass (93%) are accounted as provision of land by forest clearing.
Diesel consumption in agricultural processes was con-verted into inputs of agricultural field work processes
according to ecoinvent® (Nemecek et al.2007) in order to
consider agricultural machinery production and use as well as exhaust emissions from the tractor. Diesel consumption
in combined harvesting is 10.6 l ha−1. Fuel consumption in
sowing, pesticide and fertiliser application is calculated
based on primary data from Donato et al. (2005). Diesel
consumption for agricultural activities other than harvesting
is 25 and 52 l ha−1 for reduced and conventional tillage,
respectively.
Pesticide and fertiliser use is the average of soybean cultivation in Argentina under the different production
systems (Márgenes agropecuarios2006). Nitrogen fertiliser
is only applied to first-class soybean as monoammonium
phosphate (MAP; 5 kg MAP ha−1), whilst second class uses
the residual fertilisation of the previously implanted crop (wheat). P fertiliser is applied as MAP and triple super phosphate (TSP) fertilisers in average doses of 5 kg MAP
ha−1 and 10.5 kg TSP ha−1, respectively. Other fertilisers
such as calcium sulphate and simple formulations of P and S were not included due to lack of data. No K fertiliser is
applied in soybean production in Argentina (FAO 2004). Average pesticide applications (expressed in grams of
active compound) are with deltamethrin (67 g ha−1),
difenoconazole (5 g ha−1), cypermethrin (45 g ha−1),
chlorpyrifos (421 g ha−1), endosulfan (68 g ha−1), metribuzin
(14 g ha−1), acetochlor (56 g ha−1), glyphosate (2,340 g
ha−1), 2,4-D (240 g ha−1), metsulfuron methyl (3 g ha−1) and
imazetapyr (3 g ha−1).
N2O emissions are calculated as a direct emission from the N input and an indirect emission from the N content in nitrate leaching, as implemented in ecoinvent®. N input accounts for the N biological fixation (BNF) and for N
fertiliser (Jungbluth et al. 2007). BNF is assumed to be
70 kg N ha−1as in the reference US and BR cases. Nitrogen
oxides and ammonia emissions to air, nitrate and phospho-rous emissions to groundwater and phosphophospho-rous emissions to surface water are estimated according to Nemecek et al.
(2007), as implemented in Jungbluth et al. (2007).
Heavy metal emissions to soil are estimated as the difference between seed and fertilisers inputs and outputs, based on the BR case, as implemented in Jungbluth et al.
(2007). Pesticide inputs are assumed as emissions to soil.
Biogenic CO2 uptake (1.37 kg kg−1soybean) and biomass
energy (20.45 MJ kg−1 soybean) are estimated from the
carbon balance and the energy content in soybeans for the BR case, respectively. Soybean irrigation in Argentina is not a common practice, and the irrigated area is not significant. 2.4 Soybean oil extraction and refining
Solvent extraction technology (with methanol) is based on international standard technology, as described in Jungbluth
et al. (2007) for VOME production. However, yields,
allocation factors, natural gas and electricity consumption, electricity mix and transport distances are specific to the Argentinean context.
From 1 t of soybean, 182 kg of soybean oil (19%), 794 kg of soybean meal and 18 kg of residues are obtained. Soybean oil and soybean meal prices are US$521 and US$201 per ton, respectively (average January 2001–September 2006 at
Rotterdam market; SAGPyA 2006c). Energy contents are
assumed to be 37.2 and 17 MJ kg−1, respectively (Jungbluth
et al. 2007). Soybeans are dried (from 16% to 13%
humidity) in the vegetable oil mill using natural gas. The electricity mix was modelled based on the electricity production in Argentina and accounts for the construction and
operation of the power plants (SERA2006). The Argentinean
electricity mix is mainly dominated by fossil fuels (50% natural gas and 38% oil). Electricity at grid was modelled based on the electricity mix accounting for transmission and distribution processes. The electricity and natural gas consumption corresponds to average values for vegetable
oil mills in Santa Fe and Córdoba (IDIED2004).
Utilities are transported over 150 km in 28 t trucks. Vegetable oil mills are supplied with soybeans in a radius of 300 km being transported 80% by 28 t trucks and 20% by train. Mill infrastructure is included in the same way as in all reference cases.
2.5 Transesterification of soybean oil (methyl ester production)
Soybean oil transesterification is based on international standard technology as implemented in Jungbluth et al.
(2007) for VOME production, adapting allocation factors,
natural gas and electricity consumption, electricity mix and transport distances to the Argentinean context. From 1 t of soybean oil, 972.7 kg of soybean methyl ester and 106.1 kg of glycerine are obtained, considering methanol and potassium hydroxide addition.
Soybean methyl ester is produced for the international
markets (US$833 per ton—US market price) and glycerine
is sold in the national market (US$100 per ton—Argentina
market price; Asal and Marcus2005). Energy contents are
assumed to be 37.2 and 18 MJ kg−1, respectively
(Jungbluth et al. 2007).
Electricity and natural gas consumption are those of VOME production in the European Union. Chemicals are assumed to be supplied by chemical laboratories in Rosario, Córdoba and Buenos Aires from an average transport distance of 250 km in 28 t trucks.
Vegetable oil mills are located near the ports of Rosario in the Paraná River. Consequently, 97% of the soybean oil, 97% of the soybean meal and 75% of the soybean are
exported from this port (Franco 2005b). The
transesterifi-cation plants are assumed to be located in the same place, and therefore, no transportation of soybean oil is assumed. 2.6 Transport to exportation port, transport from port to the CH border and distribution to service station in CH In Argentina, biodiesel is transported over 100 km in 28 t trucks from the transesterification plant to the port of Rosario. It is then transported by transoceanic tanker from the ports of Rosario to the port of Rotterdam over an average distance of 12,091 km. Finally, it is transported over 840 km in barge tanker to Basel, 100 km by train and 150 km in 28 t trucks to the service station.
2.7 Utilisation
Biodiesel is assumed to completely replace fossil diesel in
28 t trucks in CH. Fuel economy is 0.27 and 0.25 kg km−1
for biodiesel and fossil diesel, respectively. The impact of the utilisation phase is assumed to be the same for all the biodiesel pathways and is directly taken from ecoinvent® as
operation of a 28 t truck with 100% rapeseed VOME. Operation of a 28 t truck with fossil diesel is also taken from ecoinvent®.
3 Results
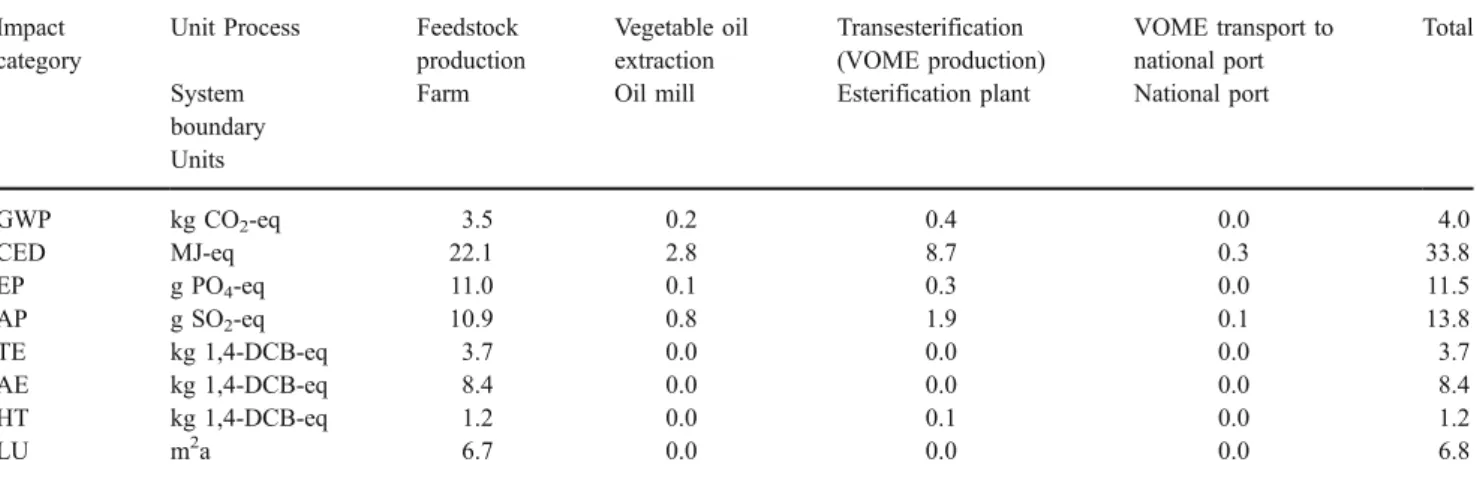
The results for all impact categories are presented in Table1
per kilogram of VOME for each unit process of the Argentinean case, modelled from feedstock production up to the exportation port.
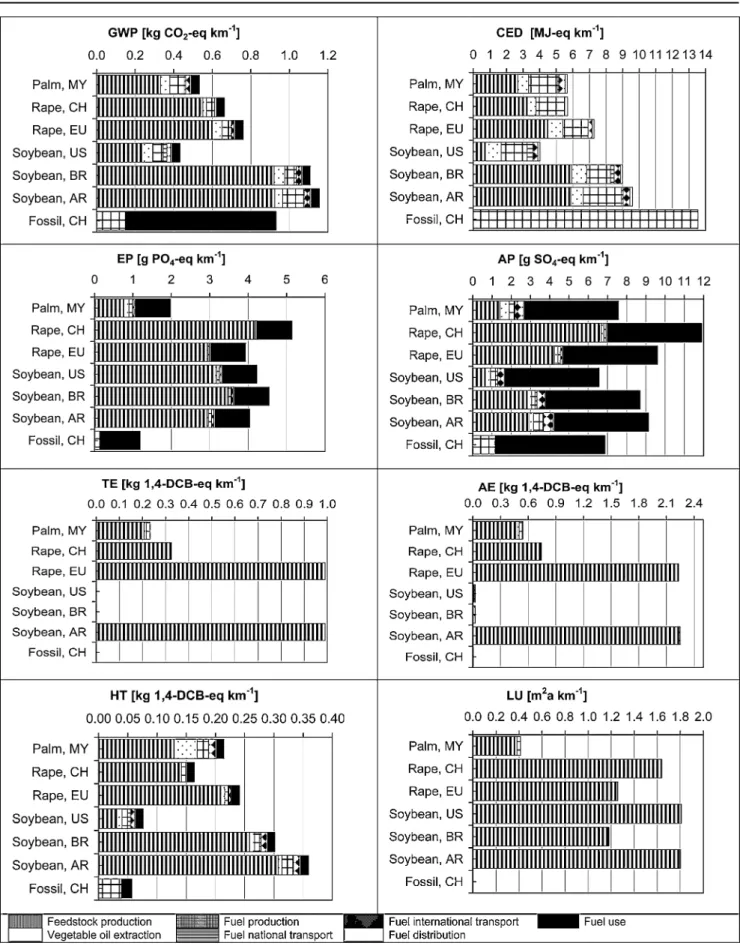
Figure2shows the comparison of the AR case with the
biodiesel and fossil diesel reference cases, including transport to Swiss border, distribution and use as B100 in 28 t trucks in Switzerland. The contribution of each unit
process of fuel production is also presented in Fig. 2 per
kilometre.
Results for each impact category for 1 km driven in a 28 t truck in Switzerland with B100 produced in AR from soybeans are: GWP, 1.2 kg CO2-eq; CED, 9.6 MJ-eq; EP, 4 g PO4-eq; AP, 9 g SO2-eq; TE, 1 kg 1,4-DCB-eq, AE,
2.2 kg 1,4-DCB-eq; HT, 0.4 kg 1,4-DCB-eq; LU, 1.8 m2a.
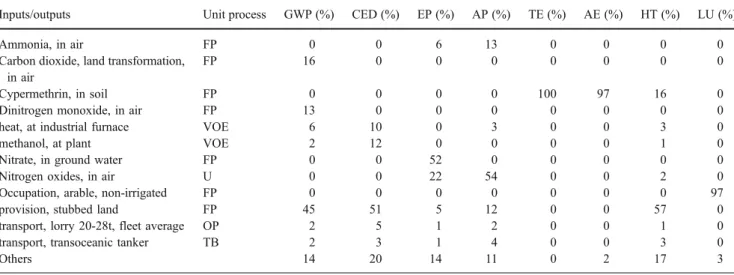
Inputs and outputs contribution to the final results for all impact categories, expressed as percentage of the total
impact, are presented in Table2.
3.1 Global warming potential and cumulative energy demand
The impact of biodiesel production is highly dominated by the agricultural phase, especially in the cases of Argentina, Brazil, the EU, Switzerland and Malaysia. Feedstock production represents 61%, 66%, 62%, 57% and 47% of the CED, respectively. For the GWP, the contribution of feedstock production is even more significant, accounting
for 80%, 83%, 79%, 83% and 62%, respectively. However, for the US case, whilst the industrial phase is dominant in the CED (63%), soybean production represents 54% of the GWP. GWP of biodiesel production in AR and BR is higher than the fossil reference and consequently is not a good choice to mitigate global warming. All biofuel pathways are below the fossil reference with respect to the CED, the AR case being the most energy-consuming one. The US has the best performance on GWP and CED.
The agricultural phase in Argentinean biodiesel produc-tion performs like the Brazilian one with respect to the CED and the GWP. The factors that explain the CED and the GWP values for the agricultural phase differ depending on the type of feedstock and the country of origin. When land use change occurs, like in Brazil, Malaysia and Argentina, the provision of land accounts for a significant
part of the impact (Fargione et al.2008; Searchinger et al.
2008; Righelato and Spracklen 2007; Kløverpris et al.
2008; Zah et al. 2007; Kløverpris et al. 2007). The high
impact factors of Brazilian and Argentinean soybeans are mainly due to emissions from land use change. Provision of scrubbed land is an energy-intensive process that represents 83%, 51% and 55% of the CED, respectively, during the agricultural phase. When no land use change occurs, the CED is mainly determined by the harvesting process, the ploughing process, the production and use of fertilisers and the production of seeds, as in the cases of US, EU and CH. Significant contribution to the impacts is due to the trans-esterification process (24% of the CED for the AR case), primarily due to the use of methanol. Biodiesel production requires 110.5 kg methanol per ton soybean oil. Nevertheless, the same input quantity was assumed for all the systems modelled, and consequently, methanol is not a parameter in the comparison of biodiesel pathways.
Table 1 Unit processes contribution to each impact category for the AR case, expressed in kilograms of soybean-based VOME and modelled from feedstock production at farm to VOME transport at port
Impact category
Unit Process Feedstock production Vegetable oil extraction Transesterification (VOME production) VOME transport to national port Total System boundary
Farm Oil mill Esterification plant National port Units GWP kg CO2-eq 3.5 0.2 0.4 0.0 4.0 CED MJ-eq 22.1 2.8 8.7 0.3 33.8 EP g PO4-eq 11.0 0.1 0.3 0.0 11.5 AP g SO2-eq 10.9 0.8 1.9 0.1 13.8 TE kg 1,4-DCB-eq 3.7 0.0 0.0 0.0 3.7 AE kg 1,4-DCB-eq 8.4 0.0 0.0 0.0 8.4 HT kg 1,4-DCB-eq 1.2 0.0 0.1 0.0 1.2 LU m2a 6.7 0.0 0.0 0.0 6.8
GWP global warming potential, CED cumulative energy demand, EP eutrophication potential, AP acidification potential, TE terrestrial ecotoxicity, AE aquatic ecotoxicity, HT human toxicity, LU land use competition, VOME vegetable oil methyl ester
Amazonian deforestation for soybean cultivation in Brazil, tropical deforestation in Malaysia for palm tree production and deforestation of dry subtropical forest in Argentina for soybean cultivation significantly contribute to an increase in GHG emissions. Emissions due to land preparation for agricultural use (land provision) together with carbon stock changes due to land use change represents 70%, 77% and 69% of the GWP of the feedstock production process, respectively, in the BR, AR and MY cases.
Apart from land use change emissions, N2O emission is the other major contributor to the GWP. Nitrous oxide emissions are mainly due to the use of N-based fertilisers in the EU, CH and MY cases for rapeseed and palm oil production. However, in the case of soybean production, N2O comes mainly from BNF. N2O emissions accounts for 16%, 53%, 38%, 22%, 75% and 16% of the GWP of the agricultural phase for Malaysia, Switzerland, the European Union, Brazil, the United States and Argentina, respectively.
The generalised use of reduced tillage methods in Argentina (88% of the total soybean cultivation) explains the lower use of fossil fuels in the agricultural phase. However, the USA case gives lower values mainly because deforestation does not occur and because of the higher crop
yields in US soybean (2,641 kg ha−1), the lower transport
distances and the lower use of pesticides in the agricultural phase. The US logistic system is more efficient. In Switzerland and the European Union, the same explanation can be given. The use of fertilisers for soybean cultivation is lower in Brazil, whilst the use of pesticides is lower in
Argentina. Soybean yield in Brazil (2,544 kg ha−1) is
similar to that of the Argentinean case.
The transport to port phase is only significant in the case of US (9%), as biodiesel is transported over 1,400 km by train and 100 km by truck to the port. Transport to the Swiss border is significant for the cases of US and MY (7% and 7% of the CED, respectively, and 5% and 4% of the GWP, respectively), mainly influenced by the transport distances from the biodiesel-producing country to the service station in Switzerland. Transoceanic transport represents 43%, 27%, 65% and 57% of the CED and 43%, 27%, 67% and 55% of the GWP of the transport phase for the cases of BR, US, MY and AR, respectively. For the US, the main contribution is the rail transport of VOME from the production site to the exportation port (34% and 31% of the CED and the GWP of the distribution and transport phase), followed by the transoceanic transport (21% and 22% of the CED and the GWP of the distribution and transport phase, respectively).
Comparing the environmental impact with the diesel
(54.9 MJ-eq kg−1) and the low-sulphur diesel (55.1 MJ-eq
kg−1) used in Switzerland, all the VOME pathways perform
worse than the fossil references for almost all the categories, with the exception of CED and GWP (for some pathways). The GWP for diesel and low-sulphur diesel
production are 0.59 and 0.60 kg CO2-eq kg−1, respectively.
However, emissions from the utilisation phase in fossil diesel are not compensated by the biogenic carbon uptake as in the case of biodiesel, significantly increasing the GWP of the fossil reference. Nonetheless, the AR and the BR cases results in higher GWP.
Table 2 Main factors contributing to the environmental impact of soybean-based VOME production in AR and used as B100 in CH, expressed as percentage of the total impact
Inputs/outputs Unit process GWP (%) CED (%) EP (%) AP (%) TE (%) AE (%) HT (%) LU (%)
Ammonia, in air FP 0 0 6 13 0 0 0 0
Carbon dioxide, land transformation, in air
FP 16 0 0 0 0 0 0 0
Cypermethrin, in soil FP 0 0 0 0 100 97 16 0
Dinitrogen monoxide, in air FP 13 0 0 0 0 0 0 0
heat, at industrial furnace VOE 6 10 0 3 0 0 3 0
methanol, at plant VOE 2 12 0 0 0 0 1 0
Nitrate, in ground water FP 0 0 52 0 0 0 0 0
Nitrogen oxides, in air U 0 0 22 54 0 0 2 0
Occupation, arable, non-irrigated FP 0 0 0 0 0 0 0 97
provision, stubbed land FP 45 51 5 12 0 0 57 0
transport, lorry 20-28t, fleet average OP 2 5 1 2 0 0 1 0
transport, transoceanic tanker TB 2 3 1 4 0 0 3 0
Others 14 20 14 11 0 2 17 3
GWP global warming potential, CED cumulative energy demand, EP eutrophication potential, AP acidification potential, TE terrestrial ecotoxicity, AE aquatic ecotoxicity, HT human toxicity, LU land use competition, FP feedstock production, VOE vegetable oil esterification, OP oil production, U utilisation, TB transport to border
3.2 Eutrophication and acidification potential
The eutrophication potential result is mainly due to feedstock production and the utilisation of the fuel for all cases (72% and 22% for the AR case, respectively). The acidification potential is explained mainly by emissions of ammonia to air, nitrates leaching to ground water and land provision for soybean cultivation. Significant contribution of the utilisation phase (22% of the EP) is due to nitrogen oxide emissions to air at fuel combustion. Similar results are obtained for the AR, EU, BR and US cases. However, the EP of all biofuel pathways is higher than that of the fossil reference.
Acidification potential is mainly due to the utilisation phase (54% of the AP) as a consequence of nitrogen oxide emissions (54% of the utilisation phase). Significant contribution of the feedstock production is due to ammonia emissions to air in soybean cultivation and ammonia, nitrogen oxides and sulfur dioxide emissions during land provision. All biofuel pathways result in a higher AP compared with the fossil reference, with the exception of the US case.
The impact of the utilisation phase on the EP and the AP is the same for all the biofuel pathways, as it was assumed that they all have the same properties.
3.3 Terrestrial, aquatic and human toxicity
Terrestrial and aquatic ecotoxicity results in similar relative values when comparing biofuel pathways. Cypermethrin is a potent pyretroid-based pesticides used in rape production in CH and EU, in palm oil production in MY and in soybean production in AR for caterpillar control. Similar amounts are used in the EU and AR cases. This compound is responsible for almost all the TE and the AE in all cases. In US and BR, other pesticides with lower toxicological impact are used, giving almost no effect on TE and AE, similar to the fossil reference.
Human toxicity is 49% due to benzene emissions to air during land provision (57% of the HT) and cypermethrin application for pest biological control in the agricultural phase (16% of the HT). The same inputs are the cause of high HT results for BR (only benzene), EU (only cypermethrin) and MY. All biofuel pathways give higher impacts than the fossil reference.
3.4 Land use competition
Arable land occupation for soybean cultivation is the main source contributing to the LU impact. Results for AR are similar to US values, as most of the soybean is cultivated as first-class soybean, giving no place for a second crop in an annual basis. Land occupation for rape cultivation in CH
and EU differs due to higher yield in EU. The BR case results in lower land occupation, as it was modelled as a second-class soybean. Obviously, the fossil reference performs better than the biofuel pathways.
3.5 Co-products
Impact results for the co-products of biodiesel production
are given in Table 3 based on economic allocation.
Additional co-products processing to obtain marketable products are considered. Soybean meal drying and glycerine refining are included, in coherence with allocation based on market prices.
The environmental impact of the products is determined by the allocation of the environmental burden between co-products. Whilst palm kernel meal produced in MY has the best performance in almost all impact categories, soybean meal produced in AR results in the highest impacts. Whilst glycerine production in EU from rapeseed oil results in the highest impacts for almost all the categories, glycerine from soybean oil produced in AR is the best case.
4 Discussion 4.1 Previous studies
No previous LCAs were found for soybean-based biodiesel in Argentina. However, a default value of GWP is given by the English Renewable Transport Fuel Obligation (RTFO)
to calculate GHG balance of imported biofuels (RFA2008),
including soybean-based biodiesel produced in Argentina. The conservative default value given by the RTFO is less
than half the result of this study (4 kg CO2-eq kg−1VOME
at esterification plant compared to 1.8 kg CO2-eq kg−1from
the RTFO). This discrepancy may be attributed to emis-sions from land use change. However, no data was available about how the RTFO value was estimated.
Dalgaard et al. (2007) give values for GWP, AP and EP
for soybean and soybean meal production in Argentina based on a consequential LCA approach. The GWP of
Argentinean soybean obtained by Dalgaard et al. (2007)
differs from the value obtained in this study (0.6 and 1.6 kg
CO2-eq kg−1 soybean, respectively). GWP values for the
AR soybean meal are between 0.3 and 0.7 kg CO2-eq kg−1
depending on the reference system chosen for assigning the impacts under a system expansion approach. These differ-ences are explained by the influence of the allocation method (system expansion vs. economic allocation) and due to different assumptions in the LCA inventory. Mainly, deforestation for soybean production (and consequently emissions from land use change) was not considered and no
However, BNF values are higher than in our study (132 kg
N ha−1compared to 70 kg N ha−1in our study). Dalgaard et
al. (2007) reports positive and negative acidification values
as a consequence of palm oil and rape meal substitution, respectively, in the system expansion approach, which results in an impact or a credit (avoided acidification) for soybean meal in Argentina. The values for soybean are 5
and 0. 8 g SO2-eq kg−1 soybean in this study and in
Dalgaard et al. (2007) (both calculated through the EDIP
method). This difference relies on the different N input assumed, on the estimation method for ammonia and nitrogen oxides and on the excluded nitrogen oxide emissions from land provision. Eutrophication values (negative in Dalgaard et al. and positive in our study) differ mainly because of the allocation method and because they have assumed no nitrate leaching to groundwater (responsible for 52% of the EP in our study).
Whilst Dalgaard et al. have modelled the soybean production system with punctual data for a specific year, we have used average data from a specific period whenever these data were available. This factor also contributes to explain the different results obtained.
4.2 Sensitivity analysis
Five scenarios were modelled to determine the impact of changing inputs in the agricultural and fuel production phase, corresponding to the following situations:
& S1 10% increment in yield while keeping the same level of inputs and labour;
& S2 Avoiding deforestation;
& S3 Shift soybean production method;
& S4 Soybean inoculation with bacteria and BNF value; & S5 Avoiding cypermethrin use;
& S6 Avoiding methanol use; & S7 Glycerine price.
Results are compared with the Argentinean reference
case and presented in Table 4. The environmental impact
of the system is mainly determined by the agricultural phase and, consequently, by the soybean yield in AR. The sensitivity analysis shows that an increase of 10% in the soybean yield by keeping the same inputs (S1) will reduce
the GWP and the EP of B100soyARG-CHin CH by 7%, the
ecotoxicity and the LU by 9%, the CED by 5% and the AP by 3%, respectively. On the other hand, increasing the yield is likely to increase diesel consumption in harvesting (and possibly the use of fertilisers). For instance, consid-ering a 46% increment in yield for soybean (3,800 kg
ha−1) diesel consumption will rise by 26% (Donato et al.
2005). A yield increment allows one to obtain lower
values of the environmental indicators, resulting in lower impacts. T able 3 Environmental impact of co-products, expressed per kilogram of glycerine and kilogram of meal, respectively Impact category Feedstock Palm oil Rapeseed oil Rapeseed oil Soybean oil Soybean oil Soybean oil Palm kernel Rape seed Rape seed Soybean Soybean Soybe an Origin MY CH EU US BR AR MY CH EU US BR AR Units Product Glycerine (at esterification plant) Meal (at oil mill) GWP kg CO 2 -eq 2.3 3.1 3.6 1.0 3.0 0.5 0.2 0.5 0.6 0.6 1.4 1.4 CED MJ-eq 25.9 28.4 35.3 9.7 24.6 4.0 1.8 3.0 4.8 3.7 10.1 9.8 EP g P O4 -eq 5 2 2 1 5 1 0 1 1 1 0 3 3 6 5 4 AP g S O2 -eq 1 1 36 23 3 1 0 2 1 5 4 2 4 5 TE kg 1,4-DCB-eq 1.2 1.7 5.1 0.0 0.0 0.4 0.1 0.3 0.9 0.0 0.0 1.4 AE kg 1,4-DCB-eq 2.8 3.8 1 1.4 0.1 0.1 1.0 0.3 0.6 2.0 0.0 0.0 3.3 HT kg 1,4-DCB-eq 1.0 0.8 1.1 0.1 0.8 0.1 0.1 0.1 0.2 0.1 0.4 0.5 LU m 2 a 2.1 8.4 6.4 5.4 3.5 0.8 0.2 1.3 1.1 3.2 1.6 2.6 GWP global warming potential, CED cumulative energ y demand, EP eutrophication potential, AP acidification potential, TE terrestrial ecotoxicity , AE aquatic ecotoxicity , HT human toxicity , LU land use competition, MY Malaysia, CH Switzerland, EU European Union, BR Brazil, AR Ar gentina
Avoiding deforestation (S2) and allocating the future land expansion to other set-aside and marginal arable land significantly decreases the environmental performances of the system, as follows: GWP is reduced by 61% as CO2 emissions from soil and biomass are avoided; CED decreases on 51% as biomass energy use from primary forest is avoided; AP is reduced by 12% as ammonia, nitrogen oxides and sulfur dioxide emissions are avoided; HE decreases on 57% as benzene emissions are avoided; EP is reduced on 5% for avoided ammonia and nitrogen oxides emissions during land provision. No effect on TE and AE occurs and an insignificant increase on LU is obtained. Deforestation for soybean cultivation was as-sumed to be 64% of the deforested area in the Northern provinces of Argentina. However, other land use changes have occurred due to soybean expansion, such as conver-sion of other cropland (mainly wheat, corn, sunflower and
sorghum) and conversion of pastureland (Pengue2006). A
default value of 0.05 kg CO2-eq kg−1of biodiesel is given
by the RTFO for grassland conversion (RFA 2008).
Nevertheless, consistent data to account for these changes were not available. Uncertainty is linked to carbon emissions, as the used data were estimated as accumulated emissions. Consequently, the emissions do not only account
for the carbon loss of a specific year but also for the decaying emission of previous years calculated during 25 years. This has resulted in an overestimation of the emissions in an annual basis.
The soybean production method has a strong influence on the results (S3). When shifting to conventional tillage, the ecotoxicity of the system increased significantly, mainly for TE and AE, due to the higher input of cypermethrin and the lower yields in conventional soybean production. LU is also increased, as FCCT soybean production does not allow crop succession. When shifting to reduced tillage methods, the impact of the system is reduced. FCRT soybean production allows reducing the ecotoxicity impact due to a reduction in cypermethrin input and reducing GWP and CED due to lower diesel consumption in agricultural processes. SCRT method allows reducing the ecotoxicity effect for the same reason and the LU due to soybean– wheat succession whilst EP is increased.
Soybean production in AR, BR and US was modelled
with a N fixation value of 70 kg ha−1. However, the BNF
depends on the N content in the grain, the type of soil and the agricultural practices in each country, and consequently, different values are expected to be obtained in each country and production system. For the AR case, BNF varies Table 4 Sensitivity analysis of significant variables impacting the final results per kilometre
Scenario Description
Impact category GWP CED EP AP TE AE HT LU
Units kg CO2-eq MJ-eq g PO4-eq g SO2-eq kg 1,4-DCB-eq kg 1,4-DCB-eq kg 1,4-DCB-eq m2a
S0 Reference 1.2 9.6 4.0 9.1 1.0 2.3 0.4 1.8 S1 Yield increment 1.1 9.1 3.8 8.9 0.9 2.0 0.3 1.6 −7% −5% −7% −3% −9% −9% −8% −9% S2 Avoiding deforestation 0.4 4.7 3.9 8.0 1.0 2.2 0.2 1.8 −61% −51% −5% −12% 0% 0% −57% 0% S3 FCRT 1.1 9.5 3.7 8.9 0.8 1.8 0.3 1.9 −2% −1% −8% −2% −21% −20% −4% 7% FCCT 1.2 9.8 4.0 9.2 2.5 5.5 0.5 2.3 1% 2% −1% 1% 149% 146% 27% 26% SCRT 1.2 9.5 4.5 9.3 0.2 0.4 0.3 1.4 2% −1% 11% 2% −84% −83% −15% −22% S4 NBF value 1.2 9.6 5.1 9.7 1.0 2.3 0.4 1.8 6% 0% 27% 7% 0% 0% 0% 0% Rhizobacteria inoculation 1.0 8.3 4.2 9.0 0.8 1.7 0.3 1.4 −13% −14% 5% −2% −22% −22% −19% −22%
S5 Avoiding cypermethrin use 1.2 9.6 4.0 9.1 0.0 0.1 0.3 1.8
0% 0% 0% 0% −100% −97% −16% 0%
S6 Avoiding methanol use 1.1 8.6 4.1 9.3 1.0 2.3 0.4 1.9
−1% −11% 1% 1% 0% 0% 23% 3%
S7 Glycerine price 1.1 9.0 3.8 8.9 0.9 2.1 0.3 1.7
−6% −6% −5% −3% −7% −7% −6% −7%
GWP global warming potential, CED cumulative energy demand, EP eutrophication potential, AP acidification potential, TE terrestrial ecotoxicity, AE aquatic ecotoxicity, HT human toxicity, LU land use competition, FCRT first-class soybean in reduced tillage, SCRT second-class soybean in reduced tillage, FCCT first-class soybean in conventional tillage
between 80 and 120 kg ha−1 (Díaz Zorita 2003; Racca
2002), and reduced tillage systems allow fixing more N
than conventional tillage systems (González 2007). BNF
values of 120, 80, 100 and 70 kg N ha−1 are assumed for
FCRT, SCRT, FCCT and SCCT, respectively (S4). BNF values are estimated in function of crop yields and as 50% of the soybean N requirements (Melgar, personal commu-nication).The new BNF values have mainly increased the EP. Soybean inoculation with rhizobacteria allows increasing BNF and this results in reducing fertiliser inputs and increasing yield. A yield increment between 500 and
1,000 kg ha−1can be obtained (González2007). This variable
was added assuming a yield increment of 750 kg ha−1 and
the new BNF values. Even though N2O emissions per hectare are increased as more N is fixed, they are compensated by the increased yield, resulting in a reduction of the environmental impact. Because assuming other BNF values would have resulted in an overestimation of the N2O emissions in the Argentinean case, compared with the reference soybean-based biodiesel pathways, the same assumption was used in this study.
Cypermethrin use can be avoided by replacing it by deltamethrin, another pyretroid-based pesticide use in AR (S5). The ecotoxicity of deltamethrin is significantly lower than that of cypermethrin, resulting in reduction of the TE, the AE and the HT of 100%, 97% and 16%, respectively.
An alternative to reduce CED from methanol use is to
substitute it by bioethanol (3.6 MJ-eq kg−1 Brazilian
sugarcane-based ethanol (Jungbluth et al.2007) compared
to 37.4 MJ-eq kg−1 methanol; S6). Using ethanol as the
alcohol in the transesterification reaction can significantly improve the energy balance of the Argentinean pathway when this is proven technically feasible. When importing BR sugarcane-based ethanol, including 1,000 km transport in 28 t trucks from fermentation plant to the port of Foz do Iguaçu, 1,000 km transport by barge tanker to the Rosario port and 100 km transport in 28 t truck to the esterification plant, the CED decreases by 11%. Nonetheless, HT is increased due to emissions to air during bioethanol transport. Domestic ethanol production can significantly reduce this impact.
Best case includes higher productivity, no deforestation, reduced tillage, soybean inoculation, avoiding cypermethrin use and avoiding methanol use in VOME transesterifica-tion. These measures should be undertaken in order to make AR biodiesel more environmentally competitive.
Sensitivity analysis of allocation methods (economic, mass, energy and carbon content) did not result in significant differences for the Argentinean case nor for the reference cases. The different vegetable oil extraction yield and the higher oil content for rapeseed and palm fruit bunches in the EU, CH and MY (397 and 380 kg oil per ton
rapeseed and 242 kg oil per ton palm fruit bunches, respectively) than for soybean in AR, BR and the US (182, 182 and 188 kg oil per ton soybean) determines different allocation factors and consequently contributes to explain the different results.
Allocation of glycerine results for AR was based on national market price (US$0.1 per kilogram of glycerine). The reference cases were modelled assuming higher prices (US$0.66 per kilogram in the US and BR, US$1.66 per kilogram in CH, the EU and MY). The impact factors for glycerine are highly influenced by the low market value of commercial glycerine in Argentina. Increased production of biodiesel may generate export opportunities for glycerine. Performing the allocation based on US glycerine market price (S7) results in a 500% increase in the environmental impact of glycerine (results are similar to those of the BR case for GWP, CED, EP, AP and LU and similar to the EU case for ecotoxicity effects) and an average decrease of 6%
of the impact of B100soyARG-CH for all categories.
Consequently, even though the allocation method did not significantly affect the result, the price variation in economic allocation has a strong impact.
The impact of transportation and utilisation phase is a function of transport distance and the type of vehicle used in each country. When biodiesel is intended to be exported
to other country, the values“at Port” in Table 1should be
used and the impact of the transport and distribution to the chosen country and the assumptions related to the utilisa-tion phase should be added.
The AR case was modelled with a higher level of detail than the reference cases, especially in the agricultural phase where four different production systems were considered. As shown in the sensitivity analysis, when assuming one production system for all soybean production, results are significantly modified.
5 Conclusions
Argentinean biodiesel producers will need to study the environmental performance of their products in order to comply with sustainability criteria being developed (Farrell
and Sperling 2007a, b; Bauen et al. 2007; Cramer et al.
2007). Due to the potential of Argentina to produce
biodiesel for export, this work constitutes a baseline to analyse the environmental impact of this feedstock and country-specific pathway by estimating the energy con-sumption, the GHG emissions, the acidification and the eutrophication potentials, the ecotoxicity effects and the land use competition of soybean-based biodiesel production in Argentina for export. The position of Argentina as a soybean-based biodiesel exporter is proven to be not competitive from the environmental point of view unless
specific measures are undertaken. These measures include avoiding deforestation, applying reduced tillage and crops successions, applying soybean inoculation methods, in-creasing yield, using low ecotoxicity pesticides and using biomass-based methanol or bioethanol in VOME produc-tion. Compared with the fossil reference, the AR pathway has a worse performance in all the impact categories with the exception of energy consumption. The analysis of the explanatory factors shows the significant influence of the land use change, the BNF and the use of fertilisers, the applied pesticides, the soybean production method, the use of methanol and the transport system in the environmental impact.
6 Recommendations and perspectives 6.1 Modelling approach
Modelling of the agricultural phase is still too rigid. More efforts should be conducted to account for interactions between input and output variables (e.g. the impact of previous crop management, the correlation between appli-cation of fertilisers and yield increment, the influence of soybean inoculation on N2O emissions, the relation between tillage method and fertiliser use). Better knowl-edge of these correlations will allow improving agricultural phase modelling.
Better accounting for land use changes, interaction between variables and previous crops in the agricultural phase, future transesterification technologies and market prices evolution are essential to improve modelling of biofuel pathways.
Soybean in Argentina is cultivated as monoculture as well as in rotation with wheat. The management of the previous crop will have an impact on the subsequent soybean culture. Nitrogen fertiliser was allocated to the crop to which it was applied. No residual effect to the secondary crop was considered. However, in reality, second-class soybean, cultivated after wheat, is not addi-tionally fertilised as it uses the residual N from the wheat fertilisation. Similar consequences may apply to the use of pesticides and the choice of the tillage method. Expanding the system to account for crops succession will help to better model the system inputs in the agricultural phase. Moreover, the development of new transesterification technologies, the choice of additives and process optimisa-tion may influence the impact of the system on the environment.
The level of detail of data inputs should be improved in order to better account for regional specificities and to generate consistent average data at the national level. Nonetheless, more efforts should be conducted to
harmonise LCA methodology for biofuel impact assess-ment in order to allow comparison between biofuel pathways.
The values for the fossil reference system are actually ‘black box’ results. However, the same modelling concerns (i.e. allocation method) of the biofuel pathways applied to
the fossil reference (Guinée and Heijungs 2007). Further
efforts are needed in this issue.
Based on the LASEN Biofuel’s Platform, perspectives include the study of modelling choices in this pathway, the integration of agricultural models and the improvement of the LCI data especially for the oil extraction and trans-esterification phases.
Carbon emissions from deforestation should be better accounted for when new data become available.
6.2 Data uncertainty
The process of land provision from deforestation should be characterised for the AR case. Soybean cultivation data on deforested areas should be improved and become more consistent, including the amount of soybean cultivated in deforested land, soybean cultivation period, soybean yields and the applied agricultural practices.
Grain drying is identified as an important contributor in the rapeseed-based reference systems. This process should be better modelled when more data become available. Data on transesterification process should be developed and data on oil production should be improved.
In order to assess more accurately biodiesel production pathways, further consideration should be given to include indirect land use changes. For example, US soybean is produced in rotation with corn, and so, increased corn acreage in US will reduce soybean production and increase soybean price. This may be encouraging soybean expansion in AR and BR and consequently encouraging deforestation processes in these countries. However, an attributional LCA can not capture this kind of effects and further research is needed to determine and allocate indirect land use changes to a biofuel pathway.
Data on soybean production methods and agricultural practices should be harmonised, georeferenced and officially validated. Data at the county level should be developed, integrated and become consistent with national average values to account for production scale effects and logistical constraints in biodiesel production.
Acknowledgements We kindly acknowledge Luciana Moltoni and Jorge Hilbert from the Institute of Rural Engineering at the National Institute of Agricultural Technology in Argentina (IIR-INTA) for data provision. We are grateful to Andres Leone from the National Biofuels Program at the Secretary of Agriculture, Livestock, Fishery and Food (SAGPyA) in Argentina for his useful comments and Ignacio Gasparri
from the University of Tucumán (LIEY-CONICET) for providing data and validating hypotheses on deforestation and land use change emissions. Finally, we are grateful to anonymous reviewers for their useful remarks to improve this paper.
References
ADEME (2002) Bilans énergétiques et gaz à effet de serre des filières de production des biocarburants, rapport technique. ADEME, DIREM, PriceWaterhouseCoopers
Asal S, Marcus R (2005) An analysis of the obstacles to the development of a sustainable biodiesel industry in Argentina. Report. Université Paris-Dauphine. DU-Développement Durable & Organisations Bauen A, Watson P, Howes J (2007) Carbon reporting within the
renewable transport fuel obligation: methodology. E4tech Benbrook CM (2005) Rust, resistance, run down soils and rising costs—
problems facing soybean producers in Argentina. Ag Biotech InfoNet, Technical Paper no. 8. 20 January 2005
Bernesson S, Nilsson D, Hansson PA (2004) A limited LCA comparing large- and small-scale production of rape methyl ester (RME) under Swedish conditions. Biomass Bioenerg 26:545– 559
Cramer J et al (2007) Testing framework for sustainable biomass. Final report from the project group‘Sustainable production of biomass’. Creative Energy
Ciani R, Esposito A (2005) Perfil descriptivo de la cadena de oleaginosos. SAGPyA. Available at: http://www.sagpya.gov.ar. Accessed 15 December 2006 (in Spanish)
CONCAWE-EUCAR-JRC (2007) Well-to-wheels analysis of future automotive fuels and powertrains in the European context. Well-to-wheels report, version 2c. Available at:http://ies.jrc.cec.eu.int/
wtw.html. Accessed 10 March 2008
Dalgaard R, Schmidt J, Halberg N, Christensen P, Thrane M, Pengue WA (2007) LCA of soybean meal. Int J Life Cycle Assess 13 (3):240–254
Díaz Zorita, M (2003) Nuevas estrategias en el manejo de la soja. Fertilización en soja en Argentina. En: Simposio internacional sobre soja. XI Congreso Nacional de AAPRESID. Tomo 2. pp 113–127
Donato L, Moltoni L, Hilbert J (2005) La producción de biocombus-tibles empleando siembra directa en la Argentina: Implicancias económicas y energéticas. Instituto de Ingeniería Rural-INTA (in Spanish)
Elsayed MA, Matthews R, Mortimer ND (2003) Carbon and energy balances for a range of biofuels options. Project No. B/B6/00784/ REP URN 03/836. Available at: http://www.berr.gov.uk/files/
file14925.pdf. Accessed 10 March 2008
Fargione J, Hill J, Tilman D, Polasky S, Hawthorne P (2008) Land clearing and the biofuel carbon debt. Science 319(5867):1235– 1238
Farrell AE, Plevin RJ, Turner BT, Jones AD, O’Hare M, Kammen DM (2006) Ethanol can contribute to energy and environmental goals. Science 311(5781):506–508
Farrell AE, Sperling D (2007a) A low-carbon fuel standard for California, Part 1: technical analysis. University of California Farrell AE, Sperling D (2007b) A low-carbon fuel standard for
California, part 2: policy analysis. University of California Food and Agriculture Organization of rhe United Nations (2004) Fertilizer
use by crop in Argentina. Land and Plant Nutrition Management Service, Land and Water Development Division, Rome
Franco D (2005a) Aceite de soja: Análisis de Cadena Alimentaria. SAGPyA. Available at: http://www.alimentosargentinos.gov.ar. Accessed 15 December 2006 (in Spanish)
Franco D (2005b) Logística en la cadena de oleaginosas. SAGPyA, Dirección de Industria Alimentaria. Revista Alimentos Argentinos N° 30, Oct. 2005. Available at:http://www.alimentosargentinos.
gov.ar. Accessed 8 December 2006 (in Spanish)
Frischknecht R (2005) Ecoinvent data v1.1 (2004): from heterogenous databases to unified and transparent LCI data. Int J Life Cycle Assess 10(1):1–2
Frischknecht R, Jungbluth N, Althaus HJ, Doka G, Dones R, Heck T, Hellweg S, Hischier R, Nemecek T, Rebitzer G, Spielmann M (2004) The ecoinvent database: overview and methodological framework. Int J Life Cycle Assess 10(1):3–9
Gasparri NI, Grau H, Manghi E (2008) Carbon pools and emissions from deforestation in extra-tropical forests of northern Argentina between 1900 and 2005. Ecosystems 11:1247–1261
Gasparri NI, Manghi E (2004) Estimación de volumen, biomasa y contenido de carbono de las regions forestales argentines. Informe final, Unidad de Manejo del Sistema de Evaluación Forestal, Dirección de bosques, Secretaría de ambiente y desarrollo sustentable, Septiembre 2004 (in Spanish)
GM-LBST (2002) GM Well-to-wheel analysis of energy use and greenhouse gas emissions of advanced fuel/vehicle systems: a European study. General Motors, L-B-Systemtechnik
Gnansounou E, Dauriat A (2005) Energy balance of bioethanol: a synthesis. Proceedings of the 14th European Biomass Conference & Exhibition, Paris, France, Oct. 2005
Gnansounou E, Dauriat A, Panichelli L, Villegas JD (2008) Energy and greenhouse gas balances of biofuels: biases induced by LCA modelling choices. J Sci Ind Res (JSIR) 67:885–897
González N (2007) Fijación de Nitrógeno en soja. Uso de inoculantes. Available at: http://www.planetasoja.com/trabajos/trabajos800.
php?id1=3277&id2=3278&idSec=26. Accessed 22 February
2008 (in Spanish)
Grau HR, Gasparri NI, Aide TM (2005) Agriculture expansion and deforestation in seasonally dry forests of north-west Argentina. Environ Conserv 32(2):140–148
Guinée JB, Heijungs R (2007) Calculating the influence of alternative allocation scenarios in fossil fuel chains. Int J Life Cycle Assess 12(3):173–180
Houghton RA (2003) Revised estimates of the annual net flux of carbon to the atmosphere from changes in land use and land management 1850–2000. Tellus 55B(2):378–390
IDIED (2004) Instituto de Investigación en Economía y Dirección para el Desarrollo, Universidad Austral. Indicadores económicos regionales, Septiembre 2004. Available at: http://www.austral.
edu.ar/FCE/inst_idied.htm. Accessed 8 December 2006 (in
Spanish)
ISO (2006a) Norma ISO 14040:2006. Environmental management. Life cycle assessment. Principles and framework
ISO (2006b) Norma ISO 14044:2006. Environmental management. Life cycle assessment. Requirements and guidelines
Johnston M, Holloway T (2007) A global comparison of national biodiesel production potentials. Environ Sci Technol 41:23 Jungbluth N, Faist Emmenegger M, Dinkel F, Stettler O, Doka G,
Chudacoff M, Dauriat A, Gnansounou E, Sutter J, Spielmann M, Kljun N, Schleiss K (2007) Life cycle inventories of bioenergy. Data v2.0 (2007), ecoinvent report No. 17, Swiss Center for Life Cycle Inventories, Uster
Kløverpris J, Wenzel H, Nielsen PH (2007) Life cycle inventory modelling of land use induced by crop consumption. Part 1: conceptual analysis and methodological proposal. Int J Life Cycle Assess 13(1):13–21
Kløverpris J, Wenzel H, Banse M, Milà i Canals L, Reenberg A (2008) Conference and Workshop on Modelling Global Land Use Implications in the Environmental Assessment of Biofuels. Int J Life Cycle Assess 13(3):178–183
Márgenes agropecuarios (2006) Costos y márgenes de producción para soja de primera y soja de segunda. Revista Márgenes Agropecuarios, 2/10/06, pp 57–59 (in Spanish)
Montenegro C, Strada M, Bono J, Gasparri NI, Manghi E, Parmuchi MG, Brouver M (2005) Estimación de la pérdida de superficie de bosque nativo y tasa de deforestación en el norte de argentina. 3er congreso forestal argentino y latinoamericano 6–9 Septiembre 2005, Corrientes (in Spanish)
Nemecek T, Heil A, Huguenin O, Meier S, Erzinger S, Blaser S, Dux D, Zimmermann A (2007) Life Cycle Inventories of Agricultural Production Systems. ecoinvent report No. 15, v2.0. Agroscope FAL Reckenholz and FAT Taenikon, Swiss Centre for Life Cycle Inventories, Dübendorf
Paruelo JM, Guerschman JP, Verón SR (2005) Expansión agrícola y cambios en el uso del suelo. CienciaHoy Bs As 15(87):14–23 (in Spanish)
Pengue WA (2005) Transgenic crops in Argentina: the ecological and social debt. Bull Sci Technol Soc 25(NA):1–9
Pengue WA (2006) Increasing roundup ready soybean export from Argentina. In: Trydeman Knudsen M, Halberg N, Olesen JE, Byrne J, Iyer V, Toly N (eds) Global trends in agriculture and food systems. CEEP Publications, USA
Racca R (2002) Fijación biológica del nitrógeno. In: Actas 1er Simposio de Fertilidad de Suelos y Fertilización en Siembra Directa, X Congreso Nacional de AAPRESID, pp 197–208 (in Spanish) Reijnders L, Huijbregts MAJ (2008) Palm oil and the emission of
carbon-based greenhouse gases. J Clean Prod 16:477–482 RFA (2008) Carbon and sustainability reporting within the renewable
transport fuel obligation. Technical Guidance, Office of the Renewable Fuels Agency
Righelato R, Spracklen DV (2007) Carbon mitigation by biofuels or by saving and restoring forests. Science 317(5840):902–902 Russi D (2008) An integrated assessment of a large-scale biodiesel
production in Italy. Energ Policy 36:1169–1180
SAGPyA-IICA (2005) Secretaria de Agricultura, Ganadería, Pesca y Alimentos—Instituto Interamericano de Cooperación para la Agricultura. Perspectivas de los biocombustibles en la Argentina y en Brasil. Documento no. ISBN: 987-9159-07-1
SAGPyA (2006a) Estimaciones agrícolas. Available at: http://www.
sagpya.gov.ar. Accessed 15 December 2006 (in Spanish)
SAGPyA (2006b) Panorama del uso y consumo de fertilizantes en Argentina. Available at: http://www.sagpya.mecon.gov.ar. Accessed 15 December 2006 (in Spanish)
SAGPyA (2006c) Evolución de los precios externos de oleaginosos. Available at: http://www.sagpya.mecon.gov.ar. Accessed 15 December 2006 (in Spanish)
SAGPyA (2008) Más de 260 millones de dólares en exportaciones de biodiesel durante 2007. Press communication
Searchinger T, Heimlich R, Houghton RA, Dong F, Elobeid A, Fabiosa J, Tokgoz S, Hayes D, Yu TH (2008) Use of U.S. croplands for biofuels increases greenhouse gases through emissions from land use change. Science 319(5867):1238–1240 SERP (Secretaría de Energía de la República Argentina) (2006) Cálculo del factor de emisiones de CO2de la red argentina de
energía eléctrica. Available at: http://energia3.mecon.gov.ar. Accessed 4 October 2007
Sheehan J, Duffield J, Shapouri H, Graboski M, Camobrero V (1998) An overview of biodiesel and petroleum diesel life-cycles. National Renewable Energy Laboratory, US Department of Energy Smith EG, Janzen HH, Newlands NK (2007) Energy balances of biodiesel production from soybean and canola in Canada. Can J Plant Sci 87(4):793–801
VIEWLS (2005) Environmental and economic performance of biofuels, vo I, main report. VIEWLS Project, SenterNovem Zah R, Böni H, Gauch M, Hischier R, Lehmann M, Wäger P (2007)
Ökobilanzierung von Bioenergie: Ökologische Bewertung der Treibstoffnutzung. Schlussbericht, Entwurf Version 1.3.0. EMPA, Abteilung Technologie und Gesellschaft, 2007 (in German)