Complementary PET studies of striatal neuronal
function in the differential diagnosis between
multiple system atrophy and Parkinson’s disease
Angelo Antonini,
1Klaus L. Leenders,
2Peter Vontobel,
1R. Paul Maguire,
1John Missimer,
1Maria Psylla
1and Ilonka Gu¨nther
11PET Department, Paul Scherrer Institute, Villigen, and Correspondence to: Professor K. L. Leenders, PET 2Department of Neurology, University Hospital, Zurich, Department, Paul Scherrer Institute, CH-5232 Villigen,
Switzerland Switzerland
Summary
We used PET with the tracers [18F]fluorodeoxyglucose
(FDG), [18F]fluorodopa (FDOPA) and [11C]raclopride
(RACLO) to study striatal glucose and dopa metabolism, and dopamine D2receptor binding, respectively, in nine patients
with multiple system atrophy. Ten patients with classical Parkinson’s disease were investigated with the same three PET tracers’ and three separate groups, each of 10 healthy subjects, served as control populations. We found that striatal FDOPA values separated all healthy subjects from patients with parkinsonism but they were not useful in distinguishing multiple system atrophy from Parkinson’s disease. Conversely, striatal RACLO as well as FDG values discriminated all multiple system atrophy from Parkinson’s disease patients as
Keywords: multiple system atrophy; Parkinson’s disease; glucose metabolism; dopamine D2receptors; dopa metabolism
Abbreviations: FDG 5 [18F]fluorodeoxyglucose; FDOPA 5 [18F]fluorodopa; RACLO 5 [11C]raclopride; rCMRGlc 5
regional cerebral metabolic rate of glucose
Introduction
Multiple system atrophy is characterized by neuronal degeneration and gliosis in the basal ganglia, brainstem, cerebellum and spinal cord (Fearnley and Lees, 1990; Papp et al., 1994).
Clinically, a reliable diagnosis of multiple system atrophy can be made in the presence of a combination of parkinsonism, severe autonomic failure, cerebellar and pyramidal signs (Quinn, 1989; Quinn and Marsden, 1993). However, even if some clinical features of multiple system atrophy are clearly distinctive from idiopathic Parkinson’s disease, diagnostic errors are not uncommon. Indeed, neuropathological studies have shown that ~20% of patients clinically diagnosed with Parkinson’s disease may prove at post-mortem to have had another neurodegenerative disorder (Hughes et al., 1992a).
© Oxford University Press 1997
well as from healthy control subjects. Metabolic and receptor binding decrements in the putamen of multiple system atrophy patients were significantly correlated. Stepwise regression analysis revealed that a linear combination of putamen RACLO and FDOPA values accurately predicted clinical measures of disease severity in the multiple system atrophy group. Our findings suggest that striatal FDG and particularly RACLO are sensitive and effective measures of striatal function and may help characterizing patients with multiple system atrophy. In contrast, FDOPA measurements are accurate in detecting abnormalities of the nigrostriatal dopaminergic system but may not distinguish among different forms of parkinsonism.
Neuroimaging studies with PET may help in the differential diagnosis of parkinsonism. Studies of dopamine D2receptors
with [11C]raclopride (RACLO) have revealed reduced striatal
binding in multiple system atrophy but not in Parkinson’s disease patients, consistent with degeneration of striatal projection neurons (Brooks et al., 1992; Sawle et al., 1993). Likewise, brain metabolism studies with [18F]fluorodeoxyglucose (FDG) have shown basal ganglia
hypometabolism in patients with atypical parkinsonism (DeVolder et al., 1989, Eidelberg et al., 1993, 1995; Gilman et al., 1994). In contrast, the investigation of striatal dopa metabolism with [18F]fluorodopa (FDOPA) separated healthy
subjects from patients with parkinsonism (Sawle et al., 1994) but it was less effective in distinguishing between multiple
system atrophy and Parkinson’s disease (Burn et al., 1994). However, the aforementioned studies were performed in independent patient populations. Therefore issues regarding the effectiveness of these PET tracers in separating normal subjects from parkinsonian patients and in discriminating different forms of parkinsonism have not been entirely addressed.
In this study, we wished to provide a more comprehensive view of metabolic and receptor changes in multiple system atrophy. We used PET and FDOPA, RACLO and FDG to investigate striatal dopaminergic function in nine multiple system atrophy patients. We then assessed the effectiveness of the three PET tracers in discriminating multiple system atrophy patients from a control population of 10 typical Parkinson’s disease patients investigated using the same combination of PET radioligands, and from three separate control groups, each of 10 healthy subjects.
Methods
Patients
We studied nine patients with multiple system atrophy [five men and four women; mean (6 SD) age 57 6 7 years; disease duration 56 2 years; Hoehn and Yahr score 3.9 6 0.9]. Multiple system atrophy patients presented with signs of parkinsonism without a history of known causative factors such as encephalitis or neuroleptic treatment. Resting tremor was absent in eight out of nine and mild in one. Family histories were negative for neurodegenerative disorders. All multiple system atrophy patients had a poor or absent response to dopaminergic treatment (,20% change in motor scores). Symptoms and signs of severe postural hypotension (sustained fall.20 mmHg systolic blood pressure) were present in six out of nine patients. Urinary dysfunction was present in four out of nine. Mild gait ataxia was present in three out of nine patients. Patient 2 presented only with parkinsonian features at the time of the PET investigation. However, she also developed postural hypotension a few months later. The clinical features of these multiple system atrophy patients are summarized in Table 1.
We also studied 10 patients with typical Parkinson’s disease
Table 1 Clinical features of patients with multiple system atrophy
Patients Sex Age Duration of Hoehn and Ataxia Pyramidal Postural Urinary Medications
(years) disease (years) Yahr stage signs hypotension incontinence
1 M 62 5 3 – – 1 – L-dopa 500 mg 2 F 49 6 5 – – – 1 L-dopa 1250 mg and pergolide 3 mg 3 M 56 4 3 – 1 – – L-dopa 800 mg and bromocriptine 10 mg 4 M 50 5 3 – – – – L-dopa 1000 mg 5 M 62 5 4 1 – 1 1 L-dopa 500 mg 6 F 68 5 5 1 – 1 – L-dopa 600 mg 7 F 49 4 3 – – 1 1 L-dopa 300 mg 8 F 60 9 5 1 1 1 – L-dopa 200 mg 9 M 60 3 4 – 1 1 1 L-dopa 400 mg
[seven men and three women; age 63 6 5 years; disease duration 10 6 5 years; Hoehn and Yahr score 3.7 6 0.6]. All Parkinson’s disease patients had asymmetric onset, positive and sustained response to levodopa at the time of PET and no signs of autonomic dysfunction (Hughes et al., 1992b). Clinical and PET data of these Parkinson’s disease patients have been previously published (Antonini et al., 1995).
Before each PET scan, Parkinson’s disease and multiple system atrophy patients were clinically scored using a semiquantitative five-point scale for rigidity, bradykinesia and tremor in all four limbs, from 0 (5 absent) to 4 (5 very marked) as previously reported (Antonini et al., 1994, 1995). A composite motor score was calculated by adding the individual subscores for rigidity and bradykinesia.
All patients receiving treatment were studied in the ‘off’ condition, i.e. off their medication; dopamine agonists were stopped for 5 days, whereas levodopa-containing drugs were withdrawn 12 h before scanning (Antonini et al., 1994).
PET scans were performed in a random sequence and within 5 days in all multiple system atrophy and Parkinson’s disease subjects. All patients underwent MRI scanning as previously described (Antonini et al., 1993a). No multiple system atrophy or Parkinson’s disease patients revealed signal abnormalities or evidence of atrophy in the cortical areas, basal ganglia and cerebellum.
Three separate groups, each of 10 healthy subjects served as controls [mean age (6 SD) of RACLO controls, 58 6 9 years; FDOPA controls, 56 6 6 years; FDG controls, 54
6 11 years]. Healthy volunteers were either relatives of
Parkinson’s disease patients or workers from our institute. Data regarding the healthy control subjects reported here have been published previously (Antonini et al., 1993b, 1995). The study was approved by the Ethical Committee of the University Hospital of Zurich, Switzerland. Informed consent was obtained from each subject according to the declaration of Helsinki.
PET scanning procedure
PET scans were performed at the Paul Scherrer Institute on a CTI 933/04–16 scanner which records seven planes
simultaneously (transaxial resolution after reconstruction 8 mm full width at half maximum). An individualized head mould, prepared by pouring urethane foam into a polystyrene holder, was used to immobilize the head during the scanning. For each patient, the same individualized head mould was used for all three scans to ensure comparable head positioning. The scanner was aligned parallel to the orbitomeatal line using a laser beam. The gantry field of view was chosen to cover the region from the orbitomeatal line plus 2 cm to the orbitomeatal line plus 7.6 cm containing the complete striatum and the upper half of cerebellum. A 10 min transmission scan was performed using an external68Ge ring source. Each
PET tracer was infused intravenously in a volume of 10 ml of physiological saline, over a period of 3 min using a constant volume infusion pump.
The FDOPA (Reddy et al., 1993) injected dose ranged from 90 to 160 MBq. FDOPA/PET scanning consisted of 28 time frames for a total of 124 min. Carbidopa (2 mg/kg) was administered orally 1 h before PET scanning to inhibit the peripheral aromatic amino acid decarboxylase.
The RACLO (Ehrin et al., 1987) injected dose ranged from 110 to 340 MBq. RACLO/PET scanning consisted of 20 time frames for a total of 58 min.
The FDG (Hamacher et al., 1986) injected dose ranged from 120 to 360 MBq. FDG/PET scanning consisted of 16 time frames for a total of 48 min. Eighteen arterial blood samples were taken over the time course of the study to determine18F activity in plasma.
PET data analysis
All scans in both groups were analysed using identical standardized regions of interest as previously described (Antonini et al., 1995). Regions of interest were placed on a computer monitor in a standard template arrangement on the putamen (elliptical region of 250 mm2) and caudate
nucleus (circular region of 62.5 mm2). Region of interest
values of the right and left hemispheres were averaged. Putamen : caudate ratios were calculated for each PET tracer.
RACLO
Regions of interest were defined on integral images produced by adding the frames corresponding to the last 30 min of data acquisition. Regions of interest were defined on the plane where the maximal uptake was found and then visually adjusted to maximize the average region of interest value. They were then superimposed on the dynamic data set to generate time activity data. The cerebellum was used as reference region. Regions of interest in the cerebellum (one elliptical region of 780 mm2over each cerebellar lobe) were
defined on one of the lower planes in which the outline of the cerebellar hemispheres were most clearly visible. Specific RACLO binding in caudate nucleus and putamen was calculated in each subject using the ratio index [i.e. (target
region of interest activity–cerebellum activity)/cerebellum activity (Antonini et al., 1993b)].
FDOPA
Regions of interest were defined on integral images produced by adding the frames corresponding to the last 60 min of data acquisition. Regions of interest were defined on the plane where the maximal uptake was found and then visually adjusted to maximize the average region of interest value. They were then superimposed on the dynamic data set to generate time activity data. The occipital cortex was used as reference region. Occipital regions of interest (circular region of 612.5 mm2on each occipital lobe) were placed on each
occipital hemisphere on the same plane of striatal regions of interest. Data were analysed using a multiple-time graphical analysis approach with occipital cortex activity as input function (Patlak et al., 1985). In the multiple-time graphical analysis method, the gradient of the linear regression of the data, described as the net influx constant Ki(per minute),
reflects the rate of decarboxylation of FDOPA into [18F]fluorodopamine by the nigrostriatal dopaminergic nerve
terminals.
FDG
Parametric images of regional cerebral metabolic rate of glucose (rCMRGlc) expressed in µmol/min/100 g were calculated on a pixel-by-pixel basis. Regions of interest were placed on the plane where the anatomical structure of putamen and caudate nucleus was most clearly visible and visually adjusted to maximize the average region of interest value. A whole brain region of interest (one ellipse adjusted in size in order to cover the whole brain) was placed on the plane cutting through the striatum. To reduce intersubject variability, rCMRGlc region of interest values were normalized to the corresponding global region of interest to calculate a glucose metabolic index (Antonini et al., 1995).
Statistical analysis
The following statistical procedures were employed. (i) We compared RACLO, FDOPA and FDG values in multiple system atrophy and healthy subjects, and between multiple system atrophy and Parkinson’s disease, using analysis of variance (ANOVA) followed by Bonferroni correction for multiple comparisons (n 5 6). Differences between groups were considered significant at a level of P
, 0.005.
(ii) We employed caudate nucleus and putamen values for each of the three PET tracers and discriminant functional analysis using the F test associated with Wilks’λ(Anderson, 1984) to discriminate multiple system atrophy from healthy control subjects, and multiple system atrophy from Parkinson’s disease patients.
coefficients followed by Bonferroni correction for multiple comparisons (n5 4) to correlate RACLO, FDOPA and FDG measures in the putamen and the caudate nucleus, with total composite motor score and Hoehn and Yahr scale. Differences between groups were considered significant at a level of P, 0.01.
(iv) We employed stepwise regression analysis to identify the PET variables that better predicted the total motor score in the multiple system atrophy group.
Statistical analyses were carried out using JMP® (SAS
Institute, Cary, NC, USA).
Results
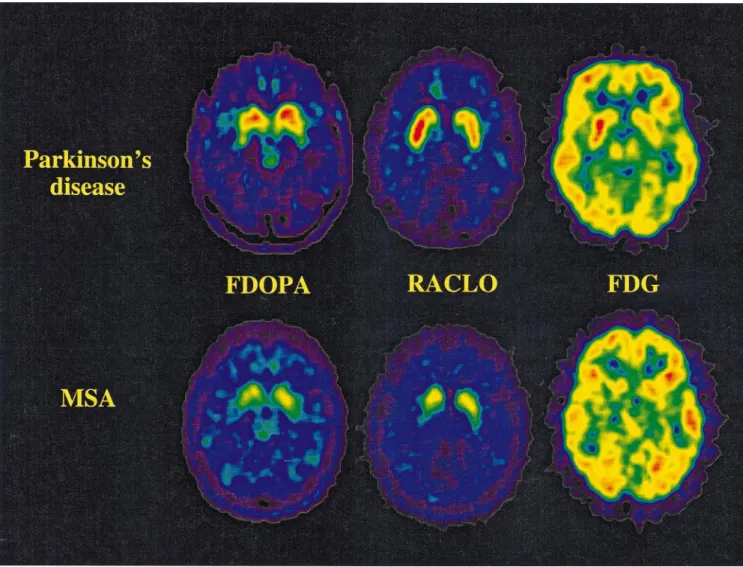
Mean RACLO, FDOPA and FDG values for multiple system atrophy and Parkinson’s disease patients, and healthy control subjects are given in Table 2. Examples of FDG, RACLO and FDOPA images from multiple system atrophy and Parkinson’s disease patients are shown in Fig. 1.
Group comparisons
Multiple system atrophy versus healthy control
subjects
In the caudate nucleus, multiple system atrophy patients showed significantly reduced FDOPA (P , 0.0005) and
Table 2 FDOPA, RACLO and FDG values in multiple system atrophy and Parkinson’s disease patients, and healthy control subjects
FDOPA (Kocc3 10–3) RACLO index FDG (glucose metabolic index)
Caudate Putamen Putamen to Caudate Putamen Putamen to Caudate Putamen Putamen to
nucleus caudate ratio caudate ratio caudate ratio
Multiple system atrophy patients 1 4.30 2.34 0.54 1.77 0.79 0.45 0.99 0.86 0.87 2 6.53 3.57 0.55 0.93 0.60 0.64 1.06 0.90 0.87 3 9.47 6.06 0.64 2.04 1.43 0.70 1.11 0.99 0.89 4 5.02 4.08 0.81 1.60 1.66 1.03 1.13 1.13 1.00 5 7.37 4.52 0.48 1.67 1.15 0.69 1.07 1.02 0.95 6 7.94 4.50 0.57 1.87 1.63 0.87 1.03 1.09 1.01 7 9.10 6.60 0.73 1.02 1.45 1.42 1.21 0.99 0.81 8 4.76 2.35 0.49 1.10 0.54 0.49 0.91 0.98 1.08 9 6.33 2.25 0.36 1.90 1.35 0.71 1.16 1.02 0.88 Mean 6.76 4.03 0.57 1.54 1.18 0.78 1.07 1.00 0.93 SD 1.87 1.59 0.14 0.42 0.43 0.30 0.09 0.08 0.09 % of Parkinson’s 100 95 91 80 47 60 90 74 82 disease mean % of normal mean 64 40 60 66 50 77 93 79 85 Parkinson’s disease patients Mean 6.74 4.23 0.63 1.94 2.50 1.30 1.19 1.35 1.13 SD 1.27 1.14 0.14 0.30 0.36 0.14 0.08 0.12 0.07 % of normal mean 64 42 66 83 106 129 103 106 103 Normal subjects Mean 10.49 10.06 0.95 2.34 2.35 1.01 1.16 1.27 1.10 SD 0.69 0.73 0.05 0.25 0.18 0.06 0.05 0.05 0.06
RACLO (P, 0.0001). FDG differences were not significant. In the putamen, FDOPA (P, 0.0001), RACLO (P , 0.0001) and FDG values (P, 0.0001) were significantly decreased. FDOPA (P , 0.0001) and FDG (P , 0.0001) putamen : caudate ratios were reduced but those for RACLO were not.
Multiple system atrophy versus Parkinson’s
disease
In the caudate nucleus, multiple system atrophy patients showed a tendency for RACLO (P 5 0.05) and FDG (P 5 0.02) reductions that did not reach significance after Bonferroni correction. In the putamen, significant decreases were present in RACLO (P , 0.0001) and FDG (P , 0.0001) values. RACLO (P , 0.0001) and FDG (P , 0.0001) putamen : caudate ratios were significantly reduced. FDOPA values in the caudate and putamen as well as putamen : caudate ratios did not differ between the two groups.
Discriminant analysis
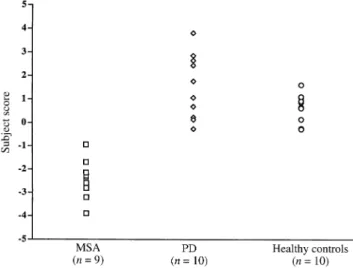
A combination of caudate and putamen FDOPA values (Fig. 2) discriminated all healthy control subjects from multiple system atrophy patients [F(2,16)5 93.8, P , 0.0001], but not multiple system atrophy from Parkinson’s disease patients.
Fig. 1 Representative PET images of FDOPA, RACLO and FDG at the mid-striatal level from one patient with Parkinson’s disease (PD)
(top row) and one patient with multiple system atrophy (MSA) (Patient 3; bottom row). Each FDOPA, RACLO and FDG image is scaled relative to common maximum and background levels.
Fig. 2 Scatter diagram of subject scores derived from
discriminant functional analysis of caudate nucleus and putamen FDOPA values in multiple system atrophy (MSA), Parkinson’s disease (PD) and normal control subjects.
A combination of caudate and putamen RACLO values (Fig. 3) discriminated between all multiple system atrophy patients and healthy control subjects [F(2,16) 5 29.0, P
, 0.0001] and between all multiple system atrophy and
Parkinson’s disease patients [F(2,16)5 28.6, P , 0.0001], but not between Parkinson’s disease patients and normal control subjects.
A combination of caudate and putamen FDG values (Fig. 4) separated all multiple system atrophy patients from healthy control subjects [F(2,16) 5 40.3, P , 0.0001] and all multiple system atrophy from Parkinson’s disease patients [F(2,16) 5 40.4, P , 0.0001], but not Parkinson’s disease patients from normal control subjects.
Correlation analysis
In multiple system atrophy patients, a significant correlation was found between putamen FDOPA and the total motor score (r5 –0.80, P , 0.01; Fig. 5). The correlation between putamen FDOPA and the Hoehn and Yahr score did not
Fig. 3 Scatter diagram of subject scores derived from
discriminant functional analysis of caudate nucleus and putamen RACLO values in multiple system atrophy, Parkinson’s disease and normal control subjects.
Fig. 4 Scatter diagram of subject scores derived from
discriminant functional analysis of caudate nucleus and putamen FDG values in multiple system atrophy, Parkinson’s disease and normal control subjects.
Fig. 5 Scatter diagram of putamen FDOPA values versus total
motor score in multiple system atrophy patients (r5 0.81, P, 0.01).
Fig. 6 Scatter diagram of putamen RACLO values versus total
motor score in multiple system atrophy patients (r5 0.91, P , 0.001).
reach significance after Bonferroni correction (r 5 –0.68, P 5 0.05). Correlations between putamen RACLO and Hoehn and Yahr score (r5 –0.82, P , 0.01), and between putamen RACLO and the motor score (r 5 –0.91, P , 0.001; Fig. 6) were also significant. Correlation between putamen FDG and the composite motor score did not reach significance after Bonferroni correction for multiple comparisons (r5 –0.63, P 5 0.05). FDOPA, RACLO and FDG values in the caudate nucleus showed no correlation with clinical measures. Correlations between FDOPA and RACLO values in both caudate nucleus and putamen were not significant. RACLO and FDG showed a significant correlation (r5 0.78, P , 0.01) in the putamen but not in the caudate nucleus.
Stepwise regression analysis revealed that a linear combination of putamen FDOPA and RACLO values was highly predictive of total composite clinical score in the multiple system atrophy patients [R25 0.95, F(2,16) 557.3,
P, 0.0001].
Discussion
We found that the measurement of putamen glucose metabolism and dopamine D2 receptor binding accurately
discriminated multiple system atrophy from Parkinson’s disease patients as well as multiple system atrophy from healthy control subjects. In contrast, FDOPA values in the putamen separated healthy subjects from all parkinsonian patients but not multiple system atrophy from Parkinson’s disease patients. Moreover, a linear combination of putamen RACLO and FDOPA values was highly predictive of disease severity measures in the multiple system atrophy population. Our findings are in keeping with previous PET studies of striatal dopamine receptor binding (Brooks et al., 1992; Sawle et al., 1993) and glucose metabolism in multiple system atrophy (DeVolder et al., 1989; Eidelberg et al., 1993; Gilman et al., 1994; Eidelberg et al., 1995). These PET findings are also consistent with degeneration of striatal
projection neurons and dopaminergic nerve terminals in multiple system atrophy as demonstrated by neuropathological studies (Fearnley and Lees, 1990; Goto et al., 1996; Ito et al., 1996). In our study, the investigation of both RACLO binding and FDG metabolism in the putamen discriminated all multiple system atrophy from all Parkinson’s disease patients. Our finding of complete concordance between FDG and RACLO measurements and the clinical diagnosis of multiple system atrophy and Parkinson’s disease may be surprising since neuropathological studies have suggested that a large percentage of parkinsonian patients may be misdiagnosed in life (Hughes et al., 1992a). However, Hughes et al. (1992b) have also shown that the use of stringent clinical criteria for Parkinson’s disease selection, as in our study, affords a high level of concordance (.90%) between the clinical and neuropathological diagnosis of Parkinson’s disease. Analogously, we expected a similar level of concordance in the multiple system atrophy group, considering that patients were deliberately selected with a high clinical likelihood of atypical parkinsonism (Rajput et al., 1991; Quinn and Marsden, 1993). Our findings suggest that the assessment of striatal function with RACLO or FDG may also demonstrate diagnostic utility in the clinical evaluation of patients presenting with parkinsonism and only minor atypical signs. Indeed the identification of subjects with only ‘possible’ multiple system atrophy (Quinn, 1989) is challenging, in view of the lack of definite diagnostic tests to confirm the clinical suspicion of atypical parkinsonism. More importantly, neuropathological studies have shown that even signs and symptoms that are commonly considered to be diagnostic of Parkinson’s disease, such as resting tremor or levodopa responsiveness, may be found in patients ultimately recognized to have multiple system atrophy at post-mortem examination (Hughes et al., 1992c; Colosimo et al., 1995; Ito et al., 1996). Therefore the recognition of striatal neuronal integrity with RACLO or FDG may be of considerable support to the clinical assessment in the selection of suitable candidates for experimental therapeutics or stereotaxic surgery.
In our study, RACLO and FDG decrements in the putamen of multiple system atrophy patients were significantly correlated. However, RACLO predicted disease severity better than did FDG, suggesting that the measurement of striatal dopamine D2receptor binding may be more sensitive
than glucose metabolism in assessing the extent of neuronal degeneration. Indeed, in a previous study of patients with Huntington’s disease we found that RACLO was superior to FDG in the longitudinal quantification of the degree of striatal neuronal impairment in asymptomatic mutation-carriers (Antonini et al., 1996). We interpret our FDG findings in multiple system atrophy as an indication that, in addition to degeneration of the post-synaptic dopaminergic system, feedback mechanisms within the motor loop may modulate striatal energy metabolism.
We also found that the measurement of FDOPA uptake in putamen and caudate nucleus separated all healthy subjects
from patients with parkinsonism but it was not helpful in discriminating multiple system atrophy from Parkinson’s disease patients. Several authors have used FDOPA to assess nigrostriatal dopaminergic function in parkinsonian patients (Leenders et al., 1986, 1990; Eidelberg et al., 1990; Antonini et al., 1995; Morrish et al. 1996a; Vingerhoets et al., 1997). These studies have shown that in Parkinson’s disease putamen FDOPA uptake is correlated with clinical measures of disease severity (Eidelberg et al., 1990; Antonini et al., 1995; Morrish et al., 1996b; Vingerhoets et al., 1997) and suggested that nigrostriatal abnormalities might be detected pre-clinically (Sawle et al., 1992). More importantly, Snow et al. (1993) have shown that in vivo striatal FDOPA measurements correlate with dopamine cell counts and levels measured post-mortem in the same individuals. In contrast, PET findings concerning the effectiveness of FDOPA measurements in the differential diagnosis of parkinsonism are controversial. Brooks et al. (1990) have shown that some multiple system atrophy patients may present with more severe impairment of caudate dopaminergic nerve terminals than Parkinson’s disease patients and suggested that, in this case, FDOPA putamen : caudate ratios could be used in the differential diagnosis among different forms of parkinsonism. However, in a subsequent study in a larger patient population, Burn et al. (1994) suggested that indeed FDOPA measurements may not distinguish between Parkinson’s disease and multiple system atrophy. Analogously, Eidelberg et al. (1995) have shown that caudate and putamen FDOPA values did not discriminate typical from atypical parkinsonian patients. In our study, multiple system atrophy and Parkinson’s disease patients showed comparable decreases in putamen : caudate FDOPA ratios indicating that both disorders may present with a pattern of marked putamen impairment and relative sparing of the caudate nucleus. In this connection, neuropathological studies have shown that the distribution of neuronal degeneration in the substantia nigra may be similar in both disorders, although cellular loss is more extensive in multiple system atrophy than in Parkinson’s disease (Fearnley and Lees, 1990).
We found a significant correlation between putamen FDOPA uptake and disease severity scores in the multiple system atrophy group, analogous to results previously reported by us and other authors in Parkinson’s disease. More importantly, we found that a linear combination of putamen FDOPA and RACLO values predicted.90% of the variance of composite motor score in our multiple system atrophy subjects. This finding confirms that the concomitant degeneration of the pre- and post-synaptic striatal dopaminergic system is responsible for the motor disturbance in patients with atypical parkinsonism.
In conclusion, measurements of striatal glucose metabolism and dopamine D2 receptor binding afford an accurate
categorization of multiple system atrophy patients. The investigation of nigrostriatal dopaminergic function with FDOPA is useful in separating parkinsonian patients from healthy subjects but may not distinguish between typical
and atypical forms of parkinsonism. However, FDOPA in combination with RACLO measurements can be used to predict the degree of motor disturbance in multiple system atrophy. The assessment of striatal function using RACLO or FDG may also demonstrate diagnostic utility in supporting the clinical suspicion of multiple system atrophy in patients presenting with parkinsonism and only minimal atypical signs.
References
Anderson TW. An introduction to multivariate statistical analysis. 2nd ed. New York: John Wiley, 1984.
Antonini A, Leenders KL, Meier D, Oertel WH, Boesiger P, Anliker M. T2 relaxation time in patients with Parkinson’s disease. Neurology 1993a; 43: 697–700.
Antonini A, Leenders KL, Reist H, Thomann R, Beer HF, Locher J. Effect of age on D2 dopamine receptors in normal human brain measured by positron emission tomography and [11C]raclopride. Arch Neurol 1993b; 50: 474–80.
Antonini A, Schwarz J, Oertel WH, Beer HF, Madeja UD, Leenders KL. [11C]raclopride and positron emission tomography in previously untreated patients with Parkinson’s disease: influence of L-dopa and lisuride therapy on striatal dopamine D2-receptors. Neurology 1994; 44: 1325–9.
Antonini A, Vontobel P, Psylla M, Guenther I, Maguire RP, Missimer J, et al. Complementary positron emission tomographic studies of the striatal dopaminergic system in Parkinson’s disease. Arch Neurol 1995; 52: 1183–90.
Antonini A, Leenders KL, Spiegel R, Meier D, Vontobel P, Weigell-Weber M, et al. Striatal glucose metabolism and dopamine D2 receptor binding in asymptomatic gene carriers and patients with Huntington’s disease. Brain 1996; 119: 2085–95.
Brooks DJ, Salmon EP, Mathias CJ, Quinn N, Leenders KL, Bannister R, et al. The relationship between locomotor disability, autonomic dysfunction, and the integrity of the striatal dopaminergic system in patients with multiple system atrophy, pure autonomic failure, and Parkinson’s disease, studied with PET. Brain 1990; 113: 1539–52.
Brooks DJ, Ibanez V, Sawle GV, Playford ED, Quinn N, Mathias CJ, et al. Striatal D2 receptor status in patients with Parkinson’s disease, striatonigral degeneration, and progressive supranuclear palsy, measured with [11C]raclopride and positron emission tomography. Ann Neurol 1992; 31: 184–92.
Burn DJ, Sawle GV, Brooks DJ. Differential diagnosis of Parkinson’s disease , multiple system atrophy, and Steele-Richardson-Olszewski syndrome: discriminant analysis of striatal 18F-dopa PET data. J Neurol Neurosurg Psychiatry 1994; 57: 278–84.
Colosimo C, Albanese A, Hughes AJ, de Bruin VMS, Lees AJ. Some specific clinical features differentiate multiple system atrophy (striatonigral variety) from Parkinson’s disease [see comments]. Arch Neurol 1995; 52: 294–8. Comment in: Arch Neurol 1996; 53: 212–3.
De Volder AG, Francart J, Laterre C, Dooms G, Bol A, Michel C,
et al. Decreased glucose utilization in the striatum and frontal lobe in probable striatonigral degeneration. Ann Neurol 1989; 26: 239–47. Ehrin E, Gawell L, Ho¨gberg T, Paulis T, Stro¨m P. Synthesis of (methoxy-3H)- and (methoxy-11C)-labeled raclopride-specific
dopamine D2 receptors ligands. J Labelled Comp Radiopharm 1987; 24: 931–9.
Eidelberg D, Moeller JR, Dhawan V, Sidtis JJ, Ginos JZ, Strother SC, et al. The metabolic anatomy of Parkinson’s disease: complementary [18F]fluorodeoxyglucose and [18F]fluorodopa positron emission tomographic studies. Mov Disord 1990; 5: 203–13.
Eidelberg D, Takikawa S, Moeller JR, Dhawan V, Redington K, Chaly T, et al. Striatal hypometabolism distinguishes striatonigral degeneration from Parkinson’s disease. Ann Neurol 1993; 33: 518–27.
Eidelberg D, Moeller JR, Ishikawa T, Dhawan V, Spetsieris P, Chaly T, et al. Early differential diagnosis of Parkinson’s disease with 18F-fluorodeoxyglucose and positron emission tomography. Neurology 1995; 45: 1995–2004.
Fearnley JM, Lees AJ. Striatonigral-degeneration: a clinico-pathological study. Brain 1990; 113: 1823–42.
Gilman S, Koeppe RA, Junck L, Kluin KJ, Lohman M, St Laurent RT. Patterns of cerebral glucose metabolism detected with positron emission tomography differ in multiple system atrophy and olivopontocerebellar atrophy. Ann Neurol 1994; 36: 166–75. Goto S, Matsumoto S, Ushio Y, Hirano A. Subregional loss of putaminal efferents to the basal ganglia output nuclei may cause parkinsonism in striatonigral degeneration. Neurology 1996; 47: 1032–6.
Hamacher K, Coenen HH, Sto¨cklin G. Efficient stereospecific synthesis of no-carrier-added 2-[18F]-fluoro-2-deoxy-D-glucose using aminopolyether supported nucleophilic substitution. J Nucl Med 1986; 27: 235–8.
Hughes AJ, Daniel SE, Kilford L, Lees AJ. Accuracy of clinical diagnosis of idiopathic Parkinson’s disease: a clinico-pathological study of 100 cases [see comments]. J Neurol Neurosurg Psychiatry 1992a; 55: 181–4. Comment in: J Neurol Neurosurg Psychiatry 1993; 56: 938–9.
Hughes AJ, Ben-Shlomo Y, Daniel SE, Lees AJ. What features improve the accuracy of clinical diagnosis in Parkinson’s disease: a clinicopathologic study [published erratum appears in Neurology 1992; 42: 1436] [see comments]. Neurology 1992b; 42: 1142–6. Comment in: Neurology 1993; 43: 1629–30.
Hughes AJ, Colosimo C, Kleedorfer B, Daniel SE, Lees AJ. The dopaminergic response in multiple system atrophy. J Neurol Neurosurg Psychiatry 1992c; 55: 1009–13.
Ito H, Kusaka H, Matsumoto S, Imai T. Striatal efferent involvement and its correlation to levodopa efficacy in patients with multiple system atrophy. Neurology 1996; 47: 1291–9.
Leenders KL, Palmer AJ, Quinn N, Clark JC, Firnau G, Garnett ES, et al. Brain dopamine metabolism in patients with Parkinson’s disease measured with positron emission tomography. J Neurol Neurosurg Psychiatry 1986; 49: 853–60.
Leenders KL, Salmon EP, Tyrrell P, Perani D, Brooks DJ, Sager H, et al. The nigrostriatal dopaminergic system assessed in vivo by
positron emission tomography in healthy volunteer subjects and patients with Parkinson’s disease. Arch Neurol 1990; 47: 1290–8. Morrish PK, Sawle GV, Brooks DJ. Regional changes in [18F]dopa metabolism in the striatum in Parkinson’s disease. Brain 1996a; 119: 2097–103.
Morrish PK, Sawle GV, Brooks DJ. An [18F]dopa-PET and clinical study of the rate of progression in Parkinson’s disease. Brain 1996b; 119: 585–91.
Papp MI, Lantos PL. The distribution of oligodendroglial inclusions in multiple system atrophy and its relevance to clinical symptomatology. Brain 1994; 117: 235–43.
Patlak CS, Blasberg RG. Graphical evaluation of blood-to-brain transfer constants from multiple-time uptake data. Generalizations. J Cereb Blood Flow Metab 1985; 5: 584–90.
Quinn N. Multiple system atrophy–the nature of the beast. [Review]. J Neurol Neurosurg Psychiatry 1989; 52 Special Suppl: 78–89. Quinn NP, Marsden CD. The motor disorder of multiple system atrophy. J Neurol Neurosurg Psychiatry 1993; 56: 1239–42. Rajput AH, Rozdilsky B, Rajput A. Accuracy of clinical diagnosis in parkinsonism–a prospective study. Can J Neurol Sci 1991; 18: 275–8.
Reddy GN, Ha¨berli M, Beer HF, Schubiger AP. An improved synthesis of no-carrier-added (NCA) 6-[18F]fluoro-L-DOPA and its
remote routine production for PET investigations of dopaminergic systems. Appl Radiat Isot 1993; 44: 645–9.
Sawle GV, Wroe SJ, Lees AJ, Brooks DJ, Frackowiak RSJ. The identification of presymptomatic parkinsonism: clinical and [18F]dopa positron emission tomography studies in an Irish kindred. Ann Neurol 1992; 32: 609–17.
Sawle GV, Playford ED, Brooks DJ, Quinn N, Frackowiak RSJ. Asymmetrical pre-synaptic and post-synaptic changes in the striatal dopamine projection in dopa naı¨ve parkinsonism. Brain 1993; 116: 853–67.
Sawle GV, Playford ED, Burn DJ, Cunningham VJ, Brooks DJ. Separating Parkinson’s disease from normality: discriminant function analysis of fluorodopa F18 positron emission tomography data. Arch Neurol 1994; 51: 237–43.
Snow BJ, Tooyama I, McGeer EG, Yamada T, Calne DB, Takahashi H, et al. Human positron emission tomographic [18F]fluorodopa studies correlate with dopamine cell counts and levels. Ann Neurol 1993; 34: 324–30.
Vingerhoets FJG, Schulzer M, Calne DB, Snow BJ. Which clinical sign of Parkinson’s disease best reflects the nigrostriatal lesion? Ann Neurol 1997; 41: 58–64.
Received March 25, 1997. Revised June 23, 1997. Accepted July 10, 1997