by
Meisy A. Ortega-Tong MAS
Bachelor of Science in Civil Engineering University of Chile, 2007
Civil Engineer University of Chile, 2008 Master of Engineering Sciences
University of Chile, 2008
Submitted to the Department of Civil and Environmental Engineering in partial fulfillment of the requirements for the degree of
Master of Science in Transportation at the
MASSACHUSETTS INSTITUTE OF TECHNOLOGY June 2013
SACHUSEfTS INSiTTUTE
OF TECHNOLOGY
JUL 0 8 2013
LIBRARIES
@Massachusetts Institute of Technology 2013. All rights seryd
A uthor. . . . .. . . ... . . . . Department of Civil and Environmental Engineering May 24, 2013
C ertified by. . . . . . - ... . . . .
Nigel H. M. Wilson Professor of Civil and Environmental Engineering Thesis Supervisor
Certified by. ...
Y
Harilaos N. Koutsopoulos Visiting Professor of Civil and Environmental Engineering Thesis Supervisor
A a
Accepted by...
Heidi M. epf Chair, Departmental Committee for Graduate Students
by
Meisy A. Ortega-Tong
Submitted to the Department of Civil and Environmental Engineering on May 24, 2013, in partial fulfillment of the requirements
for the degree of Master of Science in Transportation
Abstract
Understanding transit users in terms of their travel patterns can support the planning and design of better services. User classification can improve market research through more targeted access to groups of interest. It facilitates planning through better survey design, as well as more detailed evaluation, through analysis of impacts based on the characterization of the
affected users. Classification of public transport users can be enhanced through the use of data from smart cards. The objective of the thesis is to categorize and better understand travel patterns of London's public transport users, using an extensive database of Oyster Card transactions. Several travel characteristics related to temporal and spatial variability, activity patterns, sociodemographic characteristics, and mode choices are used to identify homogeneous clusters. Four of the groups identified represent regular users composed of workers and students who make commuting journeys during the week, and some of them make leisure journeys during weekends. The four remaining clusters are occasional users, composed of leisure travelers, and visitors traveling for tourism and business purposes.
A detailed analysis of the characteristics of each group in terms of spatial
travel patterns, temporal changes in cluster characteristics, and membership is presented. Lack of temporal stability at the cluster level indicated that four clusters are more appropriate to analyze passenger behavior. The clusters were used to examine in detail characteristics of some special groups, such as visitors and registered users. Visitors belong mainly to two clusters, making it possible to identify business and leisure visitors. Registered users showed larger proportions in regular user clusters and their travel patterns were more similar to regular user behavior. The analysis of Oyster Card attrition rates showed that occasional user cards exit the system at a faster rate than cards of regular users who retain their cards for longer periods of time, explaining the high drop in the number of active Oyster Cards observed between consecutive months.
Thesis Supervisor: Nigel H. M. Wilson
Title: Professor of Civil and Environmental Engineering
Thesis Supervisor: Harilaos N. Koutsopoulos
Acknowledgements
The research presented in this thesis would not be possible without the help and support of the following parties that I would like to thank.
" To Transport for London for the funding provided for this research project,
specially to Lauren Sager-Weinstein and Duncan Horne for their help and guidance during my internship in London.
" To my research advisors: Professors Haris Koutsopoulos and Nigel Wilson
for their professional advice and for the time spent editing and improving this thesis.
" To my London roommates: Yonah Freemark, Laura Riegel, and Cecilia
Viggiano for all the great times we spent and for cheering my life up while in London.
" To my friends: Fernanda Bravo, Anna Matias, and, Simmy Willemman
for their friendship, all their support, and love.
" To my husband Gast6n for all his knowledge, love and patience. Thanks
for traveling more than 100 thousand miles to be with me, for encourage me to keep going, and for make me smile every day.
* To my parents and siblings in Chile for understand me, love me and bear having me so far away. Especialmente gracias a mis padres, todo lo que he logrado en la vida es fruto de su trabajo y esfuerzo.
" To anyone who indirectly contribute to this work by making me happy
Contents List of Figures List of Tables 1 Introduction 1.1 M otivation . . . . 1.1.1 Customer Experience . . . . 1.1.2 Transportation Planning . . . . 1.2 Research Objectives. . . . . 1.3 Research Approach . . . . 1.4 London Background . . . .
1.4.1 London and the Greater London Authority . 1.4.2 The Public Transport Network . . . .
1.4.3 Public Transport Fares and Ticketing . . . . 1.5 Thesis Organization . . . .
2 Literature Review
2.1 Automated Data Collection Systems . . . .
2.1.1 Automated Vehicle Location Systems 2.1.2 Automated Fare Collection Systems . 2.2 Travel Behavior and Travel Pattern Analysis 2.2.1 General Travel Behavior . . . . 2.2.2 Travel Pattern Classification . . . . .
12 . . . . 1 3 . . . . 1 3 . . . . 1 5 . . . . 1 5 . . . . 1 6 . . . - - - 1 9 . . . . 20 . . . . 20 . . . . 22 . . . . 25 26 . . . . 2 6 . . . . 2 7 . . . . 2 8 . . . . 2 9 . . . . 3 0 . . . . 3 3 5 8 11
CONTENTS
3 Classification of London Public Transport Users 35
3.1 Methodology ... ... 35
3.1.1 Classification Methods ... ... 36
3.1.2 Travel Pattern Descriptive Variables ... 43
3.2 Data Needs and Sources . . . . 49
3.2.1 Oyster Card Data . . . . 49
3.2.2 iB us . . . . 50
3.2.3 ODX Full Journey Inference . . . . 50
3.2.4 Sampling Strategy . . . . 52
3.3 Sample Characteristics . . . . 54
3.3.1 Travel Frequency . . . . 54
3.3.2 Journey Start Time . . . . 55
3.3.3 Activity Duration . . . . 56 3.3.4 Origin Frequency . . . . 56 3.3.5 Travel Distance . . . . 57 3.3.6 Mode Choice . . . . 59 3.3.7 Sociodemographic Characteristics . . . . 59 3.4 Clustering Process . . . . 60
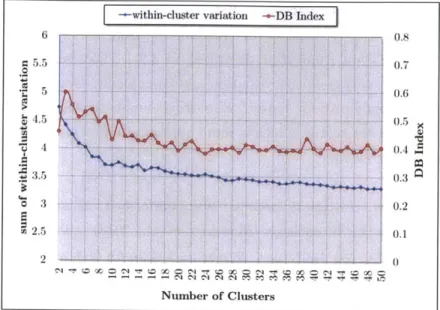
3.4.1 Optimal Number of Clusters . . . 60
3.4.2 Clustering Analysis . . . . 63
3.4.3 Cluster Initial Interpretation . . . . 73
3.4.4 Cluster Validation: ANOVA Analysis . . . 77
3.5 Sum m ary . . . 80
4 Cluster Spatial Distribution and Temporal Stability 82 4.1 Passenger Groups Spatial Distribution . . . 83
4.1.1 Most Frequent Stations . . . . 83
4.1.2 Home Location Estimation . . . . 90
4.2 Cluster Temporal Stability . . . . 95
4.3 Sum m ary . . . .. 103
5 Visitor Travel Behavior 107 5.1 London Visitors . . . 108
5.1.1 United Kingdom Visitor Surveys ... ... 108
5.1.2 Expected Visitor Behavior: a priori Hypothesis . . . 112
5.2 Visitor Oyster Card Travel Behavior . . . 113
5.3 Visitor Travel Profile . . . .. 119
5.4 Sum m ary . . . 121
6 Oyster Card Registration and Churn 124 6.1 Registration Status . . . 125
6.1.1 Registered Oyster Cards . . . 126
6.1.2 Registered User Travel Behavior . . . 127
6.2 Attrition Rates: The Churn Problem . . . 136
6.2.1 2010-2011 Oyster Card Attrition . . . 137
6.2.2 Churned Oyster Cards Travel Characteristics . . . 140
6.3 Sum m ary . . . 142
7 Summary and Conclusions 145 7.1 Summary and Findings . . . 145
7.1.1 Cluster Analysis . . . 146
7.1.2 Spatial Travel Patterns . . . 147
7.1.3 Temporal Stability . . . 148
7.1.4 Visitor Travel Patterns . . . 148
7.1.5 Registration Status . . . 149
7.1.6 Oyster Card Attrition Rates . . . 149
7.2 Recommendations . . . 150
7.3 Limitations and Future Research . . . 151
Appendices 153 A 2012 Within-Cluster Variation and Davies-Bouldin Index . . . 153
B Registered Users and Total Population Differences . . . 155
List of Figures
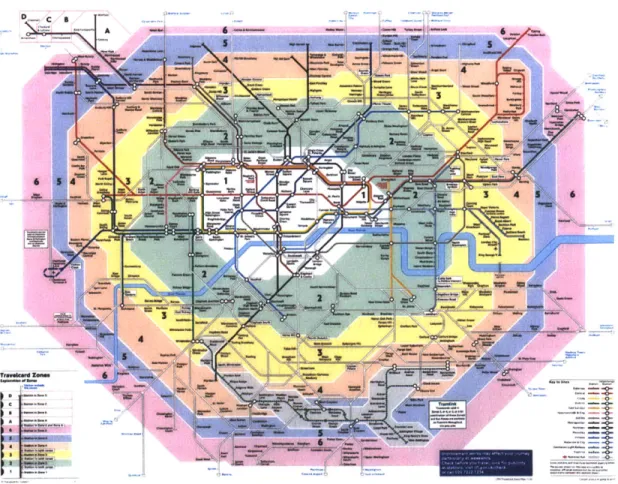
1-1 Schematic travel-zone map of London rail services (source: TfL)
Days of Travel . . . . Average Weekday Journey Start Time . . . .
Average Weekend Journey Start Time . . . .
Weekday Average Activity Duration . . . .
Weekend Average Activity Duration . . . . Different Origin Stops/Stations . . . . Maximum and Minimum Travel Distance . . . . Within-Cluster Variation and DB Index per Number of Clusters
Principal Components showing K-medoids with K = 8 . . . .
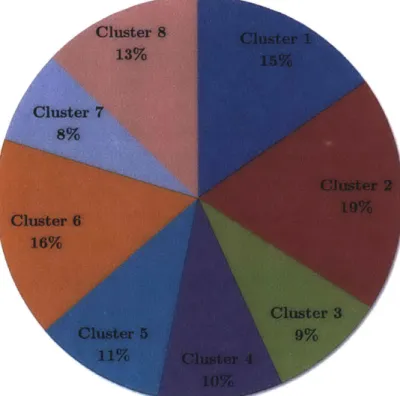
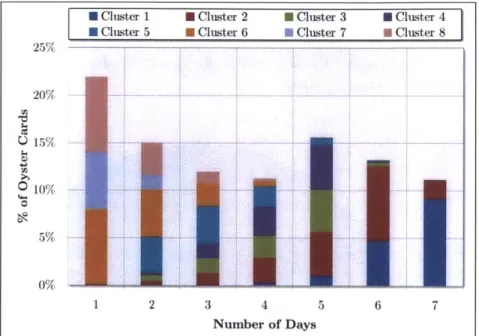
C luster Size . . . . Number of Travel Days by Cluster . . . . Weekday Main Activity Duration by Cluster . . . ..
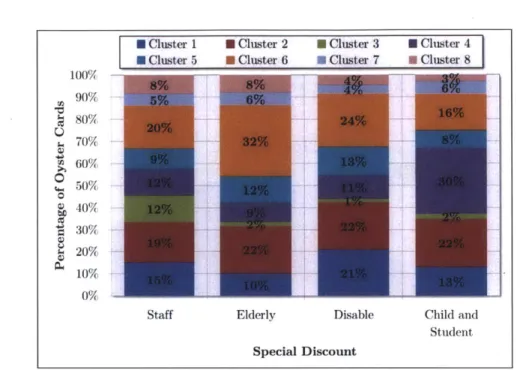
Start Time of First and Last Journey of the Day, Weekdays Fare Discount Distribution by Cluster . . . . Period Pass Distribution by Cluster . . . . Special Discount Distribution by Cluster . . . . Normalized Cluster Centers . . . . Commuters Main Activity Duration . . . . Commuters First and Last Journey Start Time . . . .
Non-Exclusive Commuters Weekend Activity Duration and Sta Non-Commuters Main Activity Duration .. . . . . Non-Commuters First and Last Journey Start Time . . . . Days of Travel per Cluster . . . ... . . . .
rt . . . 23 . . . 54 . . . 55 . . . 56 . . . 57 . . . 57 . . . 58 . . . . 58 K-medoids 62 . . . . 62 . . . . 63 . . . 64 . . . 65 . . . 66 . . . 66 . . . 67 . . . 68 . . . . 72 . . . 75 . . . 75 Times . . 76 . . . 77 . . . 78 . . . 79 3-1 3-2 3-3 3-4 3-5 3-6 3-7 3-8 3-9 3-10 3-11 3-12 3-13 3-14 3-15 3-16 3-17 3-18 3-19 3-20 3-21 3-22 3-23
.
-3-24 Maximum distance traveled per Cluster ... 4-1 4-2 4-3 4-4 4-5 4-6 4-7 4-8 4-9 4-10 4-11 4-12
Most Frequent Weekday Stations by Cluster . . . . Most Frequent Weekend Stations by Cluster . . . . 40 Next Most Frequent Weekend Stations by Cluster International Terminal Entries Cluster Distribution London Regular and Occasional User Entry Locations . London Regular and Occasional User Entry Locations . Greater London Population . . . .
Home Location for Regular User Clusters . . . . Home Location for Occasional User Clusters . . . . Cluster Size Comparison 2011-2012 . . . . Temporal Stability per Cluster . . . . Temporal Stability per Cluster Category . . . .
5-1 Percentage of Visitors by Origin and Purpose . . . .
5-2 Percentage of Visitors by Origin and Length of Stay . . . .
5-3 Days of Travel . . . . 5-4 Average Weekday Journey Stage Start Time . . . .
5-5 Average Weekday Activity Duration (After Rail Trips) . . . . 5-6 Most Frequently Visited Rail Stations . . . .
5-7 Most Frequent Visitor Non-Public Transport Movements . . . 5-8 Most Frequent Non-Visitors Non-Public Transport Movements
5-9 Visitor Cluster Membership . . . . 5-10 Visitor Oyster Cards Distribution by Cluster . . . . 5-11 User Types Cluster Membership . . . . 6-1 Percentage of Registered Oyster Cards per cluster . . . .
6-2 Registered and Total Oyster Cards Cluster Size Percentage . .
6-3 Days of Travel per cluster . . . . 6-4 Journey Start Time -Regular Users . . . .
6-5 Journey Start Time - Occasional Users . . . .
6-6 Main Activity Duration - Regular Users . . . . 6-7 Main Activity Duration - Regular Users . . . .
. . . . 84 . . . . 84 . . . 85 . . . 87 . . . 88 . . . . 89 . . . . 9 1 . . . . 93 . . . . 94 . . . 100 . . . 102 . . . 103 . . . 109 . . . 110 . . . 115 . . . 115 . . . 116 . . . 117 . . . 118 . . . 118 . . . 119 . . . 120 . . . 122 . . . 128 . . . 128 . . . 130 . . . 132 . . . 133 . . . 134 . . . 135 80
LIST OF FIGURES
6-8 Number of Active Oyster Cards over Time .... ... 138
6-9 Oyster Card Attrition over Time . . . 139
6-10 Oyster Card Attrition over Time . . . 140
6-11 October 2011 Attrition over Time . . . 141
6-12 Cluster Attrition Rates over Time . . . 142
A-1 Within-Cluster Variation and DB Index per Number of Clusters -K-medoids154 A-2 Principal Components showing K-medoids with K = 8 . . . 154
1-1 Fleet, Size and Patronage by Public Transport Network . . . . 21
3-1 Partitional Clustering: K-means . . . . 41
3-2 Partitional Clustering: K-medoids . . . . 41
3-3 Database Statistics . . . . 50
3-4 Mode Choice Distribution . . . . 59
3-5 Oyster Card Features . . . . 60
3-6 Summary of Cluster Characteristics . . . . 71
3-7 One-way ANOVA Results for the 2011 Cluster Data . . . . 78
3-8 One-way ANOVA Results for the 2011 Clustering Data - Variable: Days of U se . . . . 79
4-1 Group Average Characteristics Comparison . . . 101
6-1 2012 Oyster Card Registration Statistics . . . 126
6-2 Centroid Differences as Percentage of Total Cluster Centroid . . . 129
6-3 Standard Deviation Differences as Percentage of Total Cluster Standard D eviation . . . 130
6-4 Weeks of Data Analyzed -2010/2011 . . . 138
6-5 Weeks of Data Used - 2011/2012 . . . 141
B-i Absolute Centroid Differences . . . . 155
Chapter 1
Introduction
The analysis of the travel patterns of public transportation users has always been of great interest to transit agencies, since user travel behavior has a significant impact on strategic and operational decisions. Better understanding of the characteristics and needs of passengers, such as regular travel routines, travel purposes, mandatory activities, frequency of travel, and length of trips, can provide additional tools to understand changes that could occur in ridership under particular circumstances or during unexpected events. Technological advances in automated data collection (ADC) systems provide inexpensive means to support the analysis of passenger movements and system performance. The data obtained from Automated Fare Collection systems (AFC) and Automated Vehicle Location (AVL) systems can be used to infer users origins and destinations by matching fare and vehicle location transactions. The potential of data from ADC systems has been explored in several studies recently. A number of methods has been developed, for example to estimate origin-destination (OD) pairs and full journey from such data (see Gordon (2012)). Having access to complete journey information presents a unique opportunity to improve the study of transit users temporal and spatial travel patterns. The definition of travel pattern is usually based on various travel characteristics that need to be measured. The research presented in this thesis develops a methodology to identify public transport passenger travel patterns using Smart Card data. The methodology is quite general and can be applied to any system with AFC and AVL data of sufficient quality to allow the estimation of OD pairs in the public transport network. The methodology is applied
to the London public transport system using their automated fare collection system: Oyster Card. Oyster Card users are assigned to specific groups representing specific travel profiles, which are built using well defined travel and activity patterns.
1.1
Motivation
The identification of homogeneous travel behavior groups has been the subject of research in several prior studies. The research presented in this thesis addressed this problem in the context of public transport users and is motivated by the potential the analysis of public transport user behavior has to better inform studies in the areas of customer experience and transportation planning. The travel profile of each group provides an aggregate characterization of the users of a group as a whole, which can focus survey questions to obtain more detailed information about specific areas of interest. Understanding travel characteristics of specific groups can not only improve customer communications and surveys for customer research purposes but also provide transportation planners with richer passenger demand information in order to improve system performance or better assess network investments.
1.1.1 Customer Experience
The classification of public transport users based on their travel patterns can support the study of the representativeness of specific groups among the total population. An important group for example, includes users whose Oyster Cards are registered in the Transport for London (TfL) system. TfL has additional information about registered users, such their mailing address, email, and/or telephone number; therefore, they are
a group that is relatively easy to reach. However, it is not well understood whether registered users travel behavior is representative of the whole population, if not results of any study conducted using registered users as a sample may be biased. Analyzing the travel characteristics of registered users, knowing their distribution among different travel behavior groups, and comparing their behavior with the rest of the population can determine the representativeness of this group. This allows the generalization and validation of findings from studies based on registered users. It can also help in the the
Chapter 1. Introduction
design of more efficient and better targeted travel surveys for marketing research purposes. Moreover, a characterization of passengers' travel patterns is helpful to personalize email communications among registered users in order to provide them only relevant information. Information about station or line closures, unexpected events, changes in service may be specifically targeted to the affected users. This can also reduce the number of emails users receive, probably increasing the effectiveness of communications and education campaigns.
Visitors are another group of great interest to improve customer experience. 26.3 million overseas and domestic visitors arrived in London during 2011 of which an estimated 88% used the Underground during their visit. The behavior of some visitors can be identified
by analyzing the Visitor Oyster Cards. This is a type of Oyster Card issued to visitors
that can be purchased in advance, and delivered to any country. However, many London visitors buy normal Oyster Cards or paper tickets once they are in London, and there is no direct way to identify them. The identification of this last group of visitors can be facilitated by having a deeper knowledge of the travel behavior of visitors holding Visitor Oyster Cards and comparing it with the behavior of the travel groups identified through the classification process. Exploring the similarities between the travel behavior of Visitor Oyster Card users and other travel groups will also allow determining whether their behavior is unique or part of a broader group that also includes for example, London residents.
Another group of interest correspond to churned or inactive cards. There are a considerable number of Oyster Cards that after certain period of time become inactive and are no longer observed in TfL system. The analysis of Oyster Card attrition rates of different groups will help understanding the underlying reasons for Oyster Card attrition, which can be a first step towards understanding customer attrition. Separating the effect of customer attrition from other effects, such as seasonality, special events, and impact of different projects, could lead to more accurate estimation of passenger demand, which will improve the evaluation of strategic investments or operational planning changes, and
1.1.2
Transportation Planning
From the standpoint of transportation planning, classifying users travel patterns allows the analysis of possible differences in level of service experienced by different passenger segments and the identification of potential biases. It can also provide better understanding of how changes in level of service affect different users and how they respond to those changes.
Knowing the main differences between groups can contribute to a better understanding of the effect of disruptions on travel behavior. Estimation of origin-destination matrices
by type of user provides an opportunity to explore the impact that users with different
travel patterns have on network loads; moreover, the analysis of different groups frequent origins and destinations reveals possible geographic trends.
Finally, understanding the travel characteristics of specific groups may help establish the level of predictability of user trips. Analyzing the frequency of travel of different users allows identifying regular and occasional users, making possible to identify everyday commuters based on the consistency of their trip-making. This distinction between users
can help determine the predictability of travel behavior.
1.2
Research Objectives
This thesis explores the use of automatically collected data to analyze passenger travel patterns on the London public transport system. The analysis is accomplished by developing a segmentation of the London public transport system users based on a number of descriptive variables obtained from the Oyster Card data. Oyster Card users are categorized in clusters and characterized by a specific profile, which is built based on common travel and activity patterns, and sociodemographic characteristics. Each group will have some characteristics in common to several other groups; however, each Oyster Card user belongs to only one group.
More specifically, the main goal of this thesis is achieved by focusing on the following objectives:
Chapter 1. Introduction
" Identify homogenous groups of London public transport users, based on similar
travel behavior and sociodemographic characteristics.
" Distinguish geographic travel patterns of different types of users and find potential
station usage trends.
" Determine travel behavior consistency over time by analyzing group membership
temporal variability.
" Characterize London's visitors travel behavior based on the travel patterns of Visitor
Oyster Card users and their similarities with other travel groups.
* Find a relationship between travel behavior and different card related decisions, such as registration status and card attrition. This allows the identification of possible bias in the travel behavior of specific groups of interest such as registered card users and churned card users.
1.3
Research Approach
This thesis develops and applies a passenger classification method to analyze the travel patterns of public transport users. The review of previous research provides an overview of travel pattern analysis and identifies the relevant variables used in different contexts to understand travel patterns. Given that there is no previously known information about homogeneous travel groups among the population, the most appropriate classification method is clustering. The theoretical background of the clustering method used in this thesis is presented and summarized as part of the classification methodology discussion.
The thesis pursues the objectives stated above with an extensive application using the London public transport users. The analysis is carried out using London's AFC data which is extracted from the Oyster Card database and London bus AVL system, called iBus. The information provided by both databases is joined using the origin-destination inference method developed by Gordon (2012). This inference tool estimates the most likely origins and destinations for those trips where the boarding or alighting point is not recorded in the AFC system, matching AVL and AFC records. The methodology assumes that most passengers begin their next trip close to the destination of their previous trip
and their last trip of the day ends at the origin station/stop where their first trip of that day began. Using this tool and data from one week of a normal period, a network-wide origin-destination matrix of journeys is built to extract travel pattern variables for each user.
The main travel dimensions that are analyzed in this thesis to determine passenger travel profiles include all relevant (and available) user characteristics that define their travel patterns. Researchers have used different approaches to characterize travel patterns, as described in detail in Chapter 2. For this thesis, a multi-dimensional approach is used for the classification with the main variables summarized below.
" Travel Frequency: Travel frequency can be interpreted as an indicator of trip
temporal regularity/variability and a measure of users' level of usage of the system. The travel frequency variables examined include the number of trips per day, and the number of days of travel per week.
" Journey Start Time: The time journeys begin may be an indicator of the purpose of the trip, and the consistency of this start time during the week can also be an indicator of trip regularity. Passengers' start time of the first and last journeys of the day are analyzed for classification purposes.
* Travel Distance: Travel distance is an indicator of user accessibility to different
activity locations. Users' maximum and minimum travel distance are used in the analysis.
" Activity Patterns: Activity refers to actions users perform when they are not
traveling. The activities at the end of each public transport journey impact users' travel choices; therefore, activity patterns should be considered as a travel pattern variable. The main variable explored in this thesis in terms of activity patterns is activity duration between public transport journeys.
* Origin-Destination Frequency: The number of times during a week that a user
frequents an origin or destination is a spatial indicator of travel behavior. Spatial variability contributes toward determining user travel predictability; moreover, this dimension could also reflect travel purpose. For this thesis, users' weekly number of
Chapter 1. Introduction
different origins for the first and last journeys of the day is used to analyze travel behavior.
* Public Transport Mode Choice: The extensive spatial coverage of the complex
London Public transport network allows users to move from one point to another using several mode combinations. Mode choices are influenced by user characteristics such as network knowledge, age, and physical ability. The number of days passengers' choose only rail or only bus is considered as a useful travel behavior characteristic.
9 Sociodemographic Characteristics: The sociodemographic characteristics of
passengers such as age, physical ability, and household income, also define their travel decisions. These characteristics are more difficult to obtain from AFC data; however, the card type can provide some information about the user. For this thesis two features were consider: whether the card is a Travelcard, which is an unlimited use pass that is payed only once and can last from 7 days to a year; or whether the card is a special discount card, which includes student cards, elderly or disabled free passes, and TfL staff passes.
Due to the large amount of data, it is necessary to establish a sampling strategy in order to use an appropriate sample. A minimum sample size is defined according to the variability in the population.
Using the distribution of the descriptive variables, a general analysis and assessment of the population travel patterns provides a broad overview of Oyster Card users travel patterns. The optimal number of clusters is determined based on a measure of the variation within groups. The clusters of users with similar travel behavior are obtained using the K-medoids clustering algorithm.
A comparative analysis between the different travel profiles is used to interpret the main
characteristics of each group. Each group's spatial distribution is analyzed based on their most frequently used stations and the location of their entries and boardings over the day. A home location estimation methodology is developed to identify possible geographic trends.
The temporal stability of travel patterns is an important question. The classification methodology is applied to a sample drawn for 2012 and the characteristics of corresponding clusters are analyzed to identify possible changes. The data also allows the examination of cluster membership stability over time.
The similarities of visitor travel behavior with any particular travel group are explored. Travel patterns inferred from Visitor Oyster Cards are compared with the rest of the population behavior to provide a deeper understanding of visitor behavior and how it relates to travel patterns of the various groups: The distribution of Visitor Oyster Cards among the different groups is analyzed to identify potential tendencies and similarities.
The relationship between travel behavior and card registration status and card attrition is explored. The travel characteristics of registered card users are analyzed and compared to the rest of the population to determine representativeness. The distribution of registered users among groups is estimated and the travel behavior of registered users is tested for similarity with the travel behavior of the cluster they belong to. Oyster Card attrition rates are also analyzed to explore trends in the various groups. Attrition rates are estimated from the number of active cards observed in specific weeks of different months during 2010, 2011, and 2012. The attrition rates of each cluster are compared to identify differences and groups most likely to have higher attrition rates.
1.4
London Background
This section provides a general description of London's public transport system. The section starts with a brief overview of the city of London and its organizational authorities, and continues with a description of the principal elements of the public transport network. The section ends by describing the fare and ticketing structure, which will be helpful to understand some features of the data that will be used in following chapters for passenger classification.
Chapter 1. Introduction
1.4.1
London and the Greater London Authority
London, the capital city of United Kingdom, has a population of approximately 8.1 million inhabitants and possesses one of the largest public transport systems in Europe. Transport for London (TfL) is the government entity in charge of managing most elements of the transportation network in Greater London. TfL is part of the Greater London Authority
(GLA), which was created in 1999 by an act of parliament to govern London regionally
and strategically. The democratically elected Mayor of London is the primary executive arm of GLA and has wide powers over TfL (Greater London Authority, 2013). TfL's main purpose is to carry out the Mayor's Transport Strategy and manage services across London. Under this scheme, TfL is responsible for most aspects of the transport system in London, including planning, delivery, and operation of the public transport system, the roads, and the congestion charging scheme (Transport for London, 2012h).
1.4.2
The Public Transport Network
London has an extensive radial public transport network which, along with Paris, is the largest in Europe. The London public transport system includes several subsystems which are managed by TfL: bus service (London Buses), metro service (London Underground), regional rail (London Overground), light rail (London Tramlink and Docklands Light Railway (DLR)), and ferries (The River Bus). TfL directly operates only the London Underground (LU). The National Rail (NR) is not managed by TfL and is operated through franchise agreements. The remaining services (buses, Overground (LO), Tramlink, DLR and The River Bus) are operated through concession contracts. During 2011 London's public transport system carried more than two billion trips while the ridership on a typical weekday was 3.6 million. On the busiest days of the 2012 Olympic Games more than 4.5 million trips were made. Table 1-1 summarizes the network size in terms of ridership, kilometers, and number of stations. A more detailed description of each public transportation mode in London is presented in the subsequent paragraphs.
'Not managed by TfL
2
Depends on the Train Operating Company (TOC). Each TOC has its own fleet
3
Number of Annual Ridership
stations or stops (millions)
Buses 8,500 buses 20,500 2,200
Underground 525 trains 270 1,100
More than 500
National Rail' tans 2 318 883
trains2
Overground 65 trains 83 120
Tramlink 30 trams 39 29
DLR 145 trains 45 86
The River Bus 13 ferries3
25 3
Table 1-1: Fleet, Size and Patronage by Public Transport Network
The expansive London bus network covers most of the region, so that more than 90 percent of Londoners live within 400 meters of a bus stop. London buses traveled 486 million commercial kilometers during 2011. TfL is responsible for planning the routes, determining level of service, and controlling service quality for the 8,500 buses serving
20,500 stops on over 800 routes in Greater London (Transport for London, 2012b). The
London Underground (LU) is the world's oldest metro system and one of the five most extensive, serving 1,100 million passenger trips annually on a 402 kilometer network of
270 stations on 11 lines. Waterloo and Victoria are the busiest LU stations, used by over 80 million passengers a year (Transport for London, 2012f).
National Rail (NR) provides the long distance intercity rail services, through 29 privately owned Train Operating Companies (TOC), each franchised for a defined term let by the national Department for Transport (DfT). National Rail has 318 stations that connect London with the rest of the UK and serve approximately 833 million passengers a year in London and southeast England. The London Overground (LO) is an above-ground inner suburban orbital rail service with 83 stations, 55 of which are operated by TfL. Since
2007, LO has quadrupled its annual ridership with 120 million passengers carried in 2012
(Transport for London, 2012c).
London Tramlink manages London's tram network, that connects Croydon, Wimbledon, Elmers End, Beckenham and New Addington. Tramlink ridership increased 45% in the
Chapter 1. Introduction
period from 2000 to 2012, serving over 29 million passengers annually on 28 kilometers of track and 39 stops (Transport for London, 2012e). The Docklands Light Railway (DLR) is a driver-less light rail system managed by TfL's London Rail division and operated through a concession. DLR serves the Docklands, east of central London, and the newer Canary Wharf Financial District. Its ridership has increased from 8.2 million passenger journeys in 1993/94 to 86 million in 2011/12. (Transport for London, 2012d).
River Bus is the public transport service operated by London River Services Limited (LRS) that uses TfL's eight piers on the River Thames to license scheduled and chartered passenger services. The scheduled commuter river services are known as Thames Clipper. They are operated by a private company (KPMG) that offers the river's public transport service and sightseeing tours. River transport is fully integrated with the rest of the public transport network and carries approximately 3 million passenger journeys a year (Transport for London, 2012d).
London's public transport is very well integrated. London has approximately 600 stations that provide multi-modal interchanges between all modes of public transport. TfL monitors any changes in transport or land use in order to identify interchange coordination needs (Transport for London, 2013b). Fares are also integrated between bus and Underground for passengers holding unlimited Travelcards; more details about the fare structure are presented in the following section.
1.4.3
Public Transport Fares and Ticketing
The London public transport system currently has two physical payment and revenue systems: magnetic stripe tickets and Oyster Cards. Magnetic stripe tickets have been used since 1964 and presently can be used in any of the seven public transportation modes. Oyster Cards are 'contactless' Smart Cards introduced in 2003, that have long lives and can store travel value. Oyster Cards can be used on buses, Underground, trams, DLR, Overground, Riverboats, and on some National Rail journeys. These Smart Cards are used by touching the reader at the ticket gates at the start and end of their LU, LO, DLR or rail journey. On buses, trams, and river services Oyster Cards only need to be validated at the start of the journey.
The rail fare structure is based on 6 concentric zones, numbered in ascending order from Central London outwards as shown in Figure 1-1. The price of a journey depends on the starting, en route, and ending zones. For example, Zone 1 is the most congested zone; therefore, journeys that travels into, from or through this zone pay the highest fare. The zonal structure does not apply to London Buses and Tramlink that have flat rates charged on a per-boarding basis. Interchanges are free between lines of the same mode (e.g. Underground lines, Overground and DLR), but not between different rail mode lines, between rail and buses, nor between buses or trams.
Chapter 1. Introduction
Seasonal unlimited-use passes, called 'Travelcards', can be added to both Oyster Cards and magnetic stripe tickets, although one-day travel cards can only be bought as a magnetic stripe ticket. Magnetic tickets though, cannot store monthly or annual passes. Travelcards have zonal validity and allow free interchanges between any TfL and National Rail services. Users without a Travelcard can use single paper tickets or 'Pay as You Go' Oyster Cards, which allow the users to add monetary value to their Oyster Card and simply pay according to the completed journeys (Transport for London, 2012g). Single ticket or Pay as You Go fares are higher during peak hours (6:30 to 9:30 and 16:00 to
19:00 Monday to Friday). However, if an Oyster Card user makes many Pay as You Go
journeys in one day, a daily price cap is applied to avoid paying more than the price of an equivalent one-day Travelcard (Transport for London, 2013a).
In order to acquire a monthly or an annual Travelcard Oyster Card users must register their information on TfL's customer system. Any Oyster Card can be registered at an Underground or Overground station, Oyster Ticket Stops, at London Travel Information Centers, or online at TfL's Oyster website (Transport for London, 2012a). Registered Oyster Card users can perform remote online transactions such as view and update their information, add money or renew Travelcards, and view their journey history for the last eight weeks. Additionally, the monetary value stored in a registered Oyster Card can be retrieved in case of loss or theft. Registered Oyster Card users can also receive email updates, notifying them about planned disruptions or service changes (Transport for London, 2012i).
Transport for London also provides discounted Oyster Cards for its staff, elderly and disabled individuals, students and children. TfL's staff travels free, as well as elderly and disabled individuals who hold a special Oyster Card called 'Freedom Pass'. Students from 16 to 18 years old are entitled to discounted fares if they hold an Oyster photocard; children from 5 to 10 years old travel free on all TfL and some National Rail services and children between 11 and 15 years old travel free on some buses and trams and have discounted fares on the rest of the system. Most of these special cards need to be registered on TfL's customer system (Transport for London, 2013c).
the Oyster Card penetration has grown and become the dominant fare medium for TEL services, recording more than 10 million journey transactions every day. More than 43 million cards have been issued since 2003 and over 80 per cent of all public transport journeys made in London use an Oyster Card as fare medium (Transport for London, 2011). TfL keeps records of every Oyster Card transaction for up to 8 eight weeks. Thus, the AFC database has tremendous potential for in depth analyses of the travel patterns of the users of the system, included the ones presented in this thesis.
1.5
Thesis Organization
The thesis is organized into seven chapters as follows. Chapter 2 reviews previous research on ADCS, and travel pattern and travel behavior analysis. Chapter 3 describes the classification methodology and applies it to the London public transport users using Oyster Card data. Chapter 4 describes the spatial travel patterns of each group and analyzes cluster membership stability over time. Chapter 5 provides an overview of London visitor travel patterns and relates this behavior to the identified travel clusters. Chapter 6 analyzes the travel characteristics of registered and churned card users. Chapter
7 summarizes the main research findings and discusses their implications. It also discusses
Chapter 2
Literature Review
Automated Data Collection Systems (ADCS) provide the opportunity to study in detail individual travel patterns. Compared to manual data collection techniques, ADCS provide lower marginal costs, more detailed and disaggregate information, large sample sizes, and real-time data availability. ADCS can be classified into three categories: automatic vehicle location systems (AVL), automated fare collection systems (AFC), and automated passenger counting systems (APC). The potential of ADCS has been explored for planning, managing, and assessing the performance of public transport systems (Wilson et al., 2009). Data collected by these systems allows better understanding of public transport users' travel patterns and travel behavior.
This chapter provides an introduction to the main literature related to the study of travel patterns and travel behavior using both survey and ADCS information. The chapter first describes the two ADCS systems used for this thesis: AVL and AFC, and summarizes previous studies that have shown the benefits of AVL and AFC in Section 2.1. Finally, Section 2.2 provides an overview of previous research that has addressed the problem of analyzing travel patterns or travel behavior of public transport users.
2.1
Automated Data Collection Systems
This section provides information about the main characteristics and potential applications of two of the most commonly used ADCS: AFC and AVL. The analyses presented in this
thesis, directly used data from both systems to classify passengers based on their travel patterns. The following section provides a general description of AFC and AVL and some of their most common applications.
2.1.1
Automated Vehicle Location Systems
All systems that record location information of vehicles or trains in real time are considered
automatic vehicle location and tracking systems. In the case of buses, AVL systems are commonly based on Global Positioning Systems (GPS); on the other hand, urban rail AVL systems track the location of trains using track occupancy information (Wilson et al., 2009). Existing and potential uses of AVL data to improve service planning and operations management are detailed by Furth et al. (2006). They report that although AVL systems have been applied mainly for real-time operations control and monitoring, they have also been used to improve service performance, planning, and scheduling.
AVL systems have been widely used to assess and improve bus service reliability. Camus et al. (2005) used AVL data to develop a new service reliability measure based on delays and applied it to four routes of the Trieste public transport network in Italy. Similarly, Pangilinan et al. (2008) used real-time AVL data to improve reliability for a bus route in Chicago, developing a simulation model to predict the impact on service reliability when real-time AVL information is available. ElGeneidy et al. (2011) used visual means and analytical methods to analyze public transport service reliability and schedule adherence in Metro Transit, Minnesota. They used the results to show ways of identifying causes of decline in reliability. Analyzing different methods for measuring variability and presenting new visual and simulation methods to analyze different scenarios and optimize resource allocation, Sainchez-Martinez (2013) used AVL data from London buses to improve running time variability measurement and analysis tools. Most of the cited research findings demonstrate that using real-time information based on AVL data can provide significant improvements to service reliability.
In a similar manner, AVL systems have been used to estimate, analyze and predict operational variables, such as arrival times, running times, and speeds. Horbury (1999) uses AVL data from Route 18 in London and on-bus survey data to estimate ridership
Chapter 2. Literature Review
at stops along the route and bus speeds. It was found that the speeds and ridership estimated using AVL data were comparable with those obtained by other methods, but AVL provided larger and superior data-sets at very low cost. Similarly, Cortes et al. (2011) used AVL data from Santiago, Chile, to develop a method that allows systematic monitoring of average bus speeds. Chakroborty and Kikuchi (2004) compared bus travel times estimated using AVL data and automobile travel times, implementing a functional
form that predicts the automobile travel time based on bus travel times.
Since this thesis is not focused on the analysis of bus operations but on the travel behavior characteristics of passengers over the entire public transport system, AVL systems are not used on their own. AVL data combined with AFC data are used in order to infer passengers origins and destinations when bus boarding and alighting stops are unknown. More details about this inference methodology are presented in the following paragraphs.
2.1.2
Automated Fare Collection Systems
AFC systems in public transport were introduced to replace or supplement the traditional
tickets with smart cards, allowing customers to retain their cards for longer periods (Blythe, 2004). In some cases, smart card holders can be registered, providing personal information such as home location and demographic characteristics. Therefore, AFC systems open up the possibility to analyze individuals' public transport usage and learn about their travel behavior. A more detailed description of the potential benefits of AFC systems is given in Wilson et al. (2009).
Smart card data has been used by researchers in several studies with diverse objectives. Pelletier et al. (2011) provide a detailed overview of these studies and group them into three levels: strategic, focused on long-term network planning, passenger behavior analysis, and demand forecasting; tactical, related to schedule improvements, and longitudinal and individual travel patterns; and operational, focused on supply-and-demand measures and
AFC system operations. This thesis is an example of a strategic-level study related to
customer behavior analysis, focused on the identification of groups with distinctive travel patterns through smart card data application.
Since several AFC systems do not have exit or alighting validation records, specially in bus systems, different methods have been developed to estimate the most probable alighting point for individual trips using AFC data. Most methods are based on the two assumptions that Barry et al. (2002) proposed to estimate alighting stations in the New York subway system. First, most passengers begin their next trip close to the destination of their previous trip and second, most passengers end their last trip of the day at the origin station or stop where they began their first trip of that same day.
Zhao et al. (2007) used the same assumptions as Barry et al. (2002) with data from the Chicago CTA system to estimate bus boarding locations. Trepanier et al. (2007) used the same approach to estimate bus alightings in Gatineau, but they also use next day transactions and historical travel data to complete missing records. Munizaga and Palma (2012) applied this method to a multimodal public transport system in Santiago, Chile, where the direction of travel is unknown.
This thesis applies the origin-destination inference methodology (ODX) developed by Gordon (2012) for the London public transport system using Oyster Card (London's
AFC system) and iBus (London's AVL system) data. This inference method uses similar
assumptions as Barry et al. (2002), but in this case rail exit station transactions are available therefore, origins and destinations are only estimated for bus journeys. The origin location of the stop is obtained by matching the smart card time of validation and the vehicle trip number to the AVL record of arrival time for that vehicle. To estimate destination locations, the methodology assumes that a customer's alighting location is the closest stop to the passenger's next bus boarding or station entry. More details about ODX methodology are presented in Chapter 3.
2.2
Travel Behavior and Travel Pattern Analysis
Previous researchers have employed various approaches to characterize public transport users' travel behavior and travel patterns, using either survey information or AFC data. Several characteristics of both trips and passengers have been explored to analyze travel behavior; frequency of travel, trip starting time, travel time and distance, activity
Chapter 2. Literature Review
patterns, origin/destination frequency, and mode choice are the most common variables studied. Two main research threads were found on the literature: research addressing the
general travel behavior problem, and research focusing on classification of travel patterns.
2.2.1
General Travel Behavior
Over the years, different approaches have been used to analyze and understand travel behavior. Travel variability, either temporal or spatial, has been commonly addressed to explore passengers travel patterns. Jones and Clarke (1988) analyze day-to-day variability in travel behavior based on three measures: a graphical representation that shows daily differences in activity purposes and duration at the individual level; a similarity index that measures individual day-to-day variability by comparing the trip purposes in the same 15-minute intervals in different days; and a graphical/numerical representation which use different codes for different trip purposes and shows them by time of day. The analysis shows that all the measures are useful for a better understanding of travel variability, all three measures use a "ceteris paribus" criteria which assumes that there are no other effects involved, requiring the introduction of other travel behavior variables to the analysis.
Pendyala et al. (2000) provide a general overview of several studies that have analyzed travel variability. Their goal is to examine and compare measures of travel behavior variability using a survey from Lexington, Kentucky, based on GPS data collection devices installed in the surveyed household vehicles. Frequency of travel (number of journeys with different purposes during different periods of timeO, journey start time, travel distance and time, and purpose of the trips are the variables used to characterize travel behavior during weekdays and weekends. Travel behavior variability is explored by estimating the percentage of individuals that have similar travel variables on all reported days, all but one reported day, and all but two reported days. The results showed that there are only a small percentage of individuals who repeated their behavior on all days regardless of the travel variable being used.
Schlich and Axhausen (2003) compare different methods to measure similarity of travel behavior in order to address the question of how the similarity and variability of travel
behavior can be measured. Based on data from a six-week travel diary, three similarity indeces are compared empirically. First, the repetition index developed by Hanson and Huff (1986) is explored. This index examines the proportion of individuals' activity patterns that can be considered repetitive using as attributes: mode, trip purpose, trip destination, trip distance and arrival time. The repetition is measured by comparing the deviation of the distribution of the attributes with respect to a distribution in which all possible combinations of trips are performed. Second, the similarity index developed by Pas (1983) which compares trips of different days is used. This index is flexible in the trip attributes that compares and allows using different weights for these attributes making it possible to adopt the index for different purposes. Finally, the third index analyzed is the similarity index developed by Jones and Clarke (1988) described above. The results of the comparison of these three indices indicate that daily travel patterns are more variable if the measurement index is trip-based rather than time-budget based.
Liu et al. (2009) use smart card data from Shenzhen, China with the goal of understanding collective temporal and spatial mobility patterns and their relationship to land use. They analyze three characteristics of public transport users' travel behavior: trip start times, number of station entry and exit, and most frequent origin-destination pairs. The analysis of these variables at large scale shows that the mobility patterns in Shenzhen are repetitive over time and are spatially focused in the center of the city during the peak hours. Using similar travel behavior variables, Chakirov and Erath (2011) use one full day of smart data from the entire city-state of Singapore to characterize public transport travel behavior. They analyze three main variables to describe travel behavior: the distribution of all-day journey start times; the waiting times (only in subway stations) estimated as the total recorded travel time minus the in-vehicle travel time obtained from AVL datal; and activity duration (time between consecutive journeys), location, and purpose. The purpose of the activities is inferred based on their durations, for example, activities lasting between 8 and 12 hours are considered work activities. The results not only show the potentials of smart card data for the characterization and analysis of travel patterns, but also present a first approach to an activity location model based on AFC records.
'This measure of waiting time considers only journeys with no interchanges and assumes that all passengers board the first train
Chapter 2. Literature Review
With regard to activity models based on AFC data, Devillaine et al. (2012) and Lee and Hickman (2012) also developed methodologies to infer activity purpose from smart card data using activity durations, activity locations, and other smart card characteristics. The purpose of both papers is to infer passengers' activity duration, location, and purpose using AFC data. The activity duration is estimated as the time between consecutive journeys and the location corresponds to the destination of the last journey; therefore, it depends on the origin-destination inference methodology used in each case. The activity purpose (work, home, study or other) inference methodology is similar in both cases. It is based mainly on the card type (regular card, student, senior, or other), the duration of the activity, the start time of the first stage of the previous journey, and the activity location. For example, an 8 hour activity performed in the Center Business District (CBD) of the city by an adult card user whose last journey started during the morning peak is identified as a work activity. Both papers conclude that AFC data have great potential to infer journey and activity purposes, and note improvements that can be made to the activity models as more information becomes available.
Lathia and Capra (2011) analyze travel behavior in London by comparing characteristics of travel obtained using smart card data and reported in surveys. The goal is to measure the difference between perceived and actual travel behavior using trip frequency, journey start time, travel times, and public transport mode choices as travel behavior variables. They examine two hypotheses:
1. Travelers perceptions of their usage of public transport do not match their actual
behavior
2. Transport operators offer incentives that do not work
The results show that users made less public transit trips than they claimed and associated the notion of regularity with repetitive time of travel and destinations rather than the amount of travel. Users also show more flexible mode choices than they reported, and claim to spend more money in travel fares than they actually do. Finally, fare incentives encouraged users to travel more in the case of holders of unlimited passes with a fixed price, but not in the case of students with special discounts.
Taking a general perspective, Nishiuchi et al. (2013) analyze variations in origin and destination frequency over a period of one month using smart card data from Kochi City, Japan to assess if there is any meaningful relationship between the daily spatial and temporal routines of public transport users. Low and high frequency passenger groups are identified from the distribution of days of travel for the analysis period. The study reveals that different card types have different journey behavior; for example, adult card users who have registered their cards in the system are likely to have more repetitive work trips.
2.2.2
Travel Pattern Classification
This section describes research which aims at analyzing passengers' travel behavior through the classification of their travel patterns. Different classification techniques and variables have been used to identify distinct travel behavior groups, some of which are also used for the classification of passengers in this research. Examples include Hanson and Huff
(1986) who used an out-of-home travel-activity survey from Uppsala, Sweden to classify
individuals in homogeneous travel behavior groups. The travel behavior measures used to classify individuals were: the proportion of out-of-home time spent on different activity purposes, the proportion of single-stop trips, the number of trips per day, and the proportion of walking trips. A K-means clustering algorithm (Jain et al., 2000) identified five groups with different travel characteristics, that were also analyzed using sociodemographic variables (gender, household size, and number of establishments near home). The results show that even though the five clusters of individuals share distinctive travel and sociodemographic attributes, there is considerable intragroup variance with respect to the variables and substantial overlap among groups.
Ma and Goulias (1997) used different travel behavior characteristics to classify passengers from the Puget Sound Transportation Panel (PSTP). Their goal is to measure variability in activity and travel patterns over time, examining the effect of two time-scales (day-to-day and year-to-year). K-means clustering was used as the classification method resulting in two main groups: activity and travel clusters identified at personal and household level (using an average of all household members). Four activity clusters with different characteristics were identified. Frequency of different activity purposes, duration of
Chapter 2. Literature Review
activities, trip frequency by travel mode, number of trip chains, and total travel time were used as clustering variables. Another four travel clusters were identified using only trip frequency by travel mode, number of trip chains, and total travel time as clustering variables. The results showed that travel patterns have a higher degree of regularity than activity patterns, which may be explained by the transportation system constraints. It was also shown that even though person- and household-based activity and travel patterns are very similar, there is less variation at the household-level than an a person-by-person basis.
Agard et al. (2006) used smart card data to characterize user travel behavior in Gatineau, Quebec. They explore the similarities in travel patterns using the start time of trips as the main travel characteristic. The main objective of this study was to demonstrate that data mining techniques can help identify and characterize market segments among public transport users. Using a K-means classification algorithm, they classified users into four groups according to the repetition of the starting period of each journey: two groups of users with regular activities starting at peak hours and only during the first part of the day, two groups of users with low travel frequency and no clear travel pattern. The composition of these clusters was analyzed in terms of card type (adult, student, or elderly), showing that the regular groups are mainly composed of adults and students. The variability of cluster membership over 12 weeks was analyzed to test cluster membership stability. The clustering process was repeated for each of these 12 weeks and the share of users changing from one cluster to another was analyzed. It was shown that with the exception of students, most adults belonging to one of the two regular travel groups remain in the same cluster for all weeks.