Publisher’s version / Version de l'éditeur:
Vous avez des questions? Nous pouvons vous aider. Pour communiquer directement avec un auteur, consultez la première page de la revue dans laquelle son article a été publié afin de trouver ses coordonnées. Si vous n’arrivez pas à les repérer, communiquez avec nous à [email protected].
Questions? Contact the NRC Publications Archive team at
[email protected]. If you wish to email the authors directly, please see the first page of the publication for their contact information.
https://publications-cnrc.canada.ca/fra/droits
L’accès à ce site Web et l’utilisation de son contenu sont assujettis aux conditions présentées dans le site LISEZ CES CONDITIONS ATTENTIVEMENT AVANT D’UTILISER CE SITE WEB.
Paper (National Research Council of Canada. Division of Building Research); no.
DBR-P-867, 1979-12
READ THESE TERMS AND CONDITIONS CAREFULLY BEFORE USING THIS WEBSITE. https://nrc-publications.canada.ca/eng/copyright
NRC Publications Archive Record / Notice des Archives des publications du CNRC :
https://nrc-publications.canada.ca/eng/view/object/?id=a58821ca-7912-4a88-8375-bc18c2d61425 https://publications-cnrc.canada.ca/fra/voir/objet/?id=a58821ca-7912-4a88-8375-bc18c2d61425
NRC Publications Archive
Archives des publications du CNRC
This publication could be one of several versions: author’s original, accepted manuscript or the publisher’s version. / La version de cette publication peut être l’une des suivantes : la version prépublication de l’auteur, la version acceptée du manuscrit ou la version de l’éditeur.
For the publisher’s version, please access the DOI link below./ Pour consulter la version de l’éditeur, utilisez le lien DOI ci-dessous.
https://doi.org/10.4224/40001686
Access and use of this website and the material on it are subject to the Terms and Conditions set forth at
Safety factors for fire loads
Lie, T. T.
N21
d
*r, .
National Research
Consdl
ncrtional
-0.867
I$
council-a
c i e m -
SAFETY FACTORS FOR FIRE LOADS
by T. T. Lie
Reprinted from
Canadian Journal of Civil Engineering Vol. 6, No. 4, December 1979
pp. 617-628
DBR Paper No. 867
Division of Building Research
This publication is being distributed by the Division of Building Research of the National Research Council of Canada. It should not be reproduced in whole or in part without permis- sion of the original publisher. The Division would be glad to be of assistance in obtaining such permission.
Publications of the Division may be obtained by mailing the appropriate remittance (a Bank, Express, or Post Office Money Order, or a cheque, made payable to the Receiver General of Canada, credit NRC) to the National Research Council of Canada, Ottawa. KIA 0R6. Stamps are not acceptable. A list of all publications of the Division is available and may be obtained from the Publications Section, Division of Building Research, National Research Council of Canada, Ottawa. K I A 0R6.
,
[,I\,~I[/[I~~@[;~~
h i g o 9
oid
9 i 8II~I~/
,
- - - -
-
--
- -
Safety factors for fire loads
T. T. LIE
Division of Building Research, National Research Council of Canada, Ottawa, Ont., Canada KIA OR6
Received November 9, 1978 Revised manuscript accepted August 14, 1979
A mathematical model is described that enables the evaluation of the expected fire cost and life losses for buildings. Optimum safety factors for fire loads are derived by minimizing the fire cost expectation, subject to a constraint on expected life losses. A sensitivity study shows the important variables that determine the optimum fire load safety factor. Results are compared with code requirements and suggestions are made for improving fire resistance design from the point of view of safety and cost.
Can. J . Civ. Eng., 6,617-628 (1979)
It is known that exposure to fire reduces the strength of load-bearing members such as columns,
I beams, and walls in buildings. If the fire load is
sufficiently high, a point may be reached at which the member can no longer perform its load-carrying function during fire exposure and the building may collapse. By providing adequate fire protection, however, excessive loss of strength of a member can be prevented.
Provision of appropriate fire protection is par- ticularly important in tall buildings, where evacua- tion routes are long and the population usually large. People may therefore have to remain in the building for a considerable time during a fire. This large population not only increases evacuation time
: but also the number of people at risk. In addition,
I
the value of the building and its contents may be very
I high. Spread of fire through a tall building or col-
lapse of the building may therefore result in very
I large losses in life and property. Another problem
encountered in tall buildings is the increased number of locations where fire may originate.
The increased probability of occurrence of fire and the greater value at risk with building height implies that, for the same level of safety, more extensive fire protection measures are required in tall than in low buildings. In this paper a mathematical model is described that enables the determination of optimum fire protection measures on the basis of effectiveness and cost. The influence of the factors that determine these measures are examined using the model, and safety factors are derived for the fire resistance of structural members in buildings.
I
Description of ModelTo assess the degree of safety provided in a build- ing it is necessary to be able to measure safety levels quantitatively. Such a measure is loss expectation, which can be defined as the probable loss of human lives or property during the planned life of a building.
A method of determining monetary loss expectation for fire has already been described (Lie 1972b). It is similar, in principle, to that used for evaluating losses by accidental mechanical loads (Johnson 1953;
Freudenthal 1956 ; Turkstra 1967 ; Benjamin 1968 ;
Hanai 1974). This paper extends the previous study to include a model for life losses. In addition, the possibility of structural failure caused by fires sub- sequent to the first, previously ignored, is taken into account.
As the method of deriving the probability of struc- tural failure and the monetary loss expectation has been described in detail in previous studies (Lie
1972b; Burros 1975), only the formulas will be presented in this paper, with a brief description of the models and the assumptions used in their con- struction. The method of deriving the life loss expectation, however, has not been dealt with pre- viously and will be described in detail.
Probability of Failure by Fire
Usually, a building is divided into fire-resisting compartments in order to confine a fire to the com- partment in which it starts. If the fire grows inside a compartment, the heating of structural members exposed to it becomes more severe. In general, only fires that have grown to large size are severe enough to cause failure of structural members. It is assumed that this is the case when fire has reached the fully developed stage, i.e., when all combustible material in the fire compartment is burning. In the event of such a fire, failure of the building depends on its fire resistance and fire load. If, by chance, the fire resis- tance of the structure is lower than that necessary to resist the fire load, the structure will fail.
In order to relate the probability of failure to the fire load and the fire resistance of the structure the
following assumptions are made :
1 . Fire load W follows a log-normal distribution,
with a standard deviation ow and mean value W,.
0315-1468/79/040617-12$01 .OO/O
618 CAN. J . CIV. ENG. VOL. 6. 1979 2. Fire resistance R of a structure can be expressed
in terms of the fire load it can resist; the fire load the structure can actually resist follows a log-normal
distribution with standard deviation o, and mean
value R,.
3. W and R are independent variables.
Under the assumption that the probability of occurrence of fire follows a Poi&bqdistribution, it can be shown by derivation (Lie 1 W b ; Burros 1975) that the probability of structural failure p,, during the planned service life of a building,- t,, is given. by
or
pff = 1 - exp (-atD)
where p, = conditional probability of structural
failure, given a large fire; p = mean number of large
fires per unit area of the building per unit time;
AF = floor area of the building; and a = p,pAF =
mean number of failures per unit time.
The conditional probability of structural failure in [ l ] is given by [2] p, =
3
erfc5
where erfc =(:)
' I 25'
exp(
-
g)
df - m andHere (In R), = mean of In R ; (In W), = mean of
In W; o,,
,
= standard deviation of In R ; ando,,
,
= standard deviation of In .W.Equation [3] can be written in the form (Ben- jamin and Cornell 1970; Allen 1975)
where n = fire load safety factor, i.e., the ratio of the
mean fire resistance (expressed in terms of fire load) to the mean of the fire load expected in a specific
building; V, = coefficient of variation of fire load;
and V, = coefficient of variation of fire resistance. Monetary Loss Expectation
Monetary losses caused by fire in buildings include loss of the whole or part of the building and its contents, indirect losses such as that from loss of production, cost invested in fire suppression, pre- vention, and insurance operation, and cost of repair
(Lie 1972~). In estimating the fire loss expectation
for a building the following assumptions are made:
1. Losses are proportional to the area involved in the fire. If the building is divided into Nc equal compartments and NL is the number of compart- ments involved in the fire, the loss is proportional to
NLINc.
2. With structural failure, replacement of a part or the whole of the building is necessary. Because normally it makes a difference whether a building is lost at the beginning of its service life or at the end, it is assumed that the value of the damage to the building itself is equal to that of the depreciated value of the building at the time of the fire. For simplicity a linear depreciation is assumed.
3. Where there is no structural failure, the loss is
restricted to damage to one compartment and it is
assumed that it will be repaired. As losses will be
I
relatively small (if the fire is confined to one com- r
partment), it is sufficient to take these losses into account only for the first fire.
Loss expectation can be derived by means of a
I
method previously described (Lie 1972b). Accor- ding to this method the planned service life of a building is divided into small time intervals. The loss expectation for each time interval is determined by multiplying the probability of failure in the time interval under consideration by the value that is at risk. By converting all loss expectations to their value at the time of construction and integrating these losses the total loss expectation can be found. Using this method it can be shown that the monetary loss expectation, E, is given by
[5] E = K , [l - exp (-(a
+
i)tD)]I
+
K2 [1-
exp (-
(P,+
i)tD)l+
K3where
I
and p, = PA,; a = pip,; NL = number of compart-
ments lost by fire; Nc = number of compartments in
the building; m = ratio of the sum of loss of con-
tents and indirect losses to building cost; f = cost of
building per unit floor area, exclusive of cost of fire
safety measures; CT = cost of fire safety measures
per unit floor area of the building; I = ratio of cost
of repair to building cost; and i = interest rate minus
mean inflation rate. Life Loss Expectation
people to be lost during the planned service life of a building as a result of structural failure from fire, depends on the probability of failure and the number of people in the building when failure occurs. The expected number of people at the time of failure is derived in the following way.
Assuming that the building carries full occupant load (the number of people per unit floor area for which the building is designed), the population of the whole building at the start of a fire can be given by where R = occupant load; As = area of one storey of the building; and h = height of the building expressed in total number of storeys.
It is further assumed, as in current evacuation studies1 (Pauls 1974), that in the event of fire people are evacuated at a constant rate r. If there is struc- tural failure, therefore, the number of people evacuated between the start of the fire and the time of failure, ti, will be tir. Thus, the number of people still in the building at the time of failure will be
Time of failure, ti, depends on the effectiveness and reliability of the structural fire protection provided; the rate of discharge of people, r, depends on the effectiveness and reliability of the measures taken to evacuate people from the building.
At present there is insufficient information for evaluating tir. Therefore, let y denote the proportion of people remaining in the building at the time of failure; then the number of people in the building at the time of failure
It is assumed that this number of people will be lost if there is structural failure and the whole building collapses. Because of the tendency of people to move away from the fire area it will be assumed that the loss will be negligible if only a part of the building collapses.
The life loss expectation is obtained by multi- plying life losses C , by the probability of their occurrence. Using [ I ] and [7], it follows that the life loss expectation EL during the planned service life of a building is given by
[8]
EL
= yRA,qh[l-
exp (-at,)] Acceptable Safety LevelProtection of the lives of occupants of buildings is of primary importance. The more protection pro-
'M. A. Galbreath. National Research Council of Canada, , Ottawa. Unpublished information.
I
vided, the safer the building. It is not possible, how- ever, to make buildings perfectly safe and a certain low probability of occurrence of life loss has to be accepted. To determine the degree of protection to be provided, an acceptable level of safety must be speci- fied. One method of determining such a level is to compare the risk of death by fire with the risk in- volved in other activities such as bus or rail travel, swimming, smoking, etc. Values of risk for various activities can be found in the literature (Allen 1968; Goodwin and Hutchinson 1977; Otway et al. 1970; Pugsley 1966; Witteveen and Twilt 1974). The risk people run when they travel 100 times a year by bus or rail is approximately 1 death per 10' per year; the risk of walking alongside roads is, on an average, about 5 per 10' per year, and that of climbing stairs about the same; the risk of automobile travel is approximately 3 per lo4 per year, and that of smoking about the same.
The risk of fire varies from country to country (International Fire Statistics 1973), but at present it is in the range of 1-5 deaths per 10' per year. This is of the same order of magnitude as the risk of travel by bus or train, the risk of walking alongside roads, or the risk of climbing stairs. These common daily activities are done without much thought of safety. The present average fire risk, therefore, might be one that the community would accept.
Although other values may be assigned to the acceptable safety level, in this study it is assumed that the target safety level is a life loss expectation of 1 per lo5 per year. Fire safety measures that provide this level of safety will at least ensure that, in future, average fire losses will not exceed present ones.
Optimization of Fire Cost Expectation Fire cost expectation may be defined as the sum of the fire loss expectation and the cost of expenditures for fire safety measures. From a monetary point of view fire safety measures are optimal if this sum is minimal. The optimum fire safety measures, how- ever, may not be sufficient from the point of view of life losses, so that in optimizing fire cost expectation a constraint with respect to life losses has to be included. Safety measures are regarded as optimum if the following conditions are satisfied :
1. They provide an adequate level of safety to people, here assumed to be at least equivalent to a specified target life loss expectation.
2. The sum of property loss expectation and ex- penditures for safety measures is minimal.
As with protection measures in several other areas of safety, those for fire safety can be divided into active and passive categories (Baldwin and Thomas 1974). In the present paper active measures are de-
620 CAN. J. CIV. ENG. VOL. 6 , 1979
TABLE 1. Values of variables used in calculations
Floor area of one storey (A,) 2000 m2 Service life of building (tD) 50 years
Loss of contents and indirect losses (m) 3 times building cost Cost of repair (t) 5 times building cost Interest rate (i) 7% per year Coefficient of variation of fire load ( V w ) 0.7 Coefficient of variation of fire resistance ( V R ) 0.4 Frequency of occurrence of fire (p)
No special active measures, such as
sprinklers or detection 2 x lo-' per m2 floor area per year With active measures 1 x lo-' per m2 floor area per year Cost of sprinkler protection (C.,,) 2% of building cost
Cost of structural fire protection (C,,,,) 0.4% of building cost per unit in- crease of safety factor Cost of building $500 per m2
Number of compartments lost in case of
structural failure (NL) All (NL = N,)
Fraction of building population still in the
building in the event of structural failure (y) 0.01
Target safety level 1 life loss per lo5 per year Occupant load
(a)
0.1 person per m2 floor areafined as those that control the probability of occur- rence of a large fire. Typical active measures are installation of sprinklers and detection systems.
If active measures fail and the fire becomes large, structural failure can be prevented by passive measures, here defined as those that control the conditional probability of failure of a structure, i.e., the probability of failure should a large fire occur. One of the best known passive measures is provision of structural fire protection.
The fire loss expectation can also be lowered by controlling the value at risk. During a fire, this can be achieved through evacuation of the occupants and utilization of specially protected areas to which people can be directed and where property can be stored.
If the cost and effectiveness of safety measures are known, it is possible to select, from a number of proposals, a particular measure or combination of measures that will satisfy the previously mentioned conditions. This will be the most economical of the proposed measures, and the expected cost of fire will be the optimum fire cost expectation. The fire cost expectation can be calculated from the equation:
I91
Q
=+
(nCpas+
Cact)A~fwhere Q = monetary fire cost expectation; n = fire load safety factor; C,,, = cost of passive measures per unit increase of the fire load safety factor (frac- tion of building cost); Cac, = cost of active measures (fraction of building cost); and f = cost of building per unit floor area.
Effect of Safety Measures on Losses In the following the effect of various safety mea- sures on life loss expectation and monetary fire cost expectation will be examined, using [8] and [9]. Several of the variables in these equations can vary over a wide range and data on the values of some of them are still meagre. The order of magnitude of the variables or the range in which they lie, however, are approximately known. Using available data, values have been selected in this study that are assumed to represent a standard case. In this case it is also assumed that each storey of the building is a fire resisting compartment. The selected values are given in Table 1. They may be regarded as realistic although, due to their variability and the limited accuracy with which they are known, deviations may be expected in practice from the selected values. How these deviations affect the results and the bases for the selected values will be discussed in later sections.
Influence of Evacuation I
Evacuation procedures are based on rapid removal of occupants from the fire area to safer areas. This ' may result in total or partial evacuation or transfer to refuge areas in buildings. Total evacuation is the simultaneous movement of people from a building to outside at grade level. This usually does not present any problem in low buildings, but in taller ones the exits may not be sufficient to handle the entire building population simultaneously. In this case the most effective way is to move the occupants outside in phases. This is known as phase or partial
LIE 62 1 evacuation. Another form of partial evacuation is
movement of people to areas of refuge specially protected against penetration of heat and smoke.
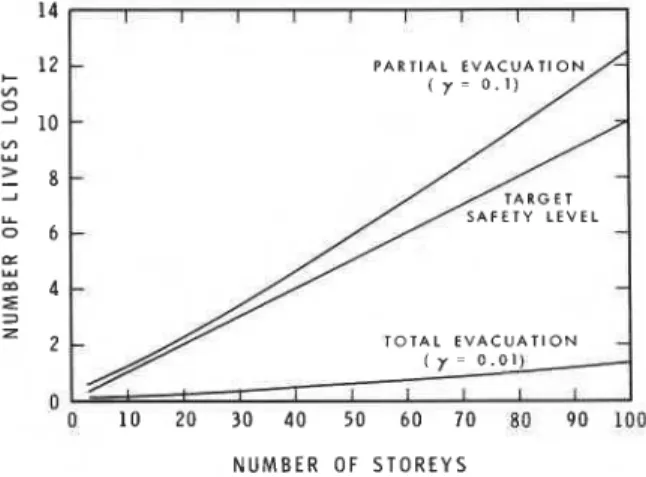
In order to examine the effect of rate of evacuation on life loss expectation, two levels of evacuation of the building will be considered. Although other values may be assigned to the degree of vacation, it is assumed in the following that for total evacuation
1% (y = 0.01) of the original population will still be in the building should structural failure occur, and
for partial evacuation, 10% (y = 0.1).
In Fig. 1 the influence of total and partial evacua- tion on the expectation of life losses during-the service life of the building (50 years) is shown as a function of building height. In the calculation of life loss ex- pectation it has been assumed that the economic optimum of fire resistance has been provided and that the buildings are not sprinklered. For com- parison, the life loss expectation corresponding to the target safety level of one fatality per 100 000 is also shown (Fig. 1). It may be seen that for total evacua- tion expected losses are far below target losses. If a substantial number of people remain in the building during a fire, the loss expectation will increase con- siderably. The results indicate that in this case provi- sion of the target safety level for people might not be economical or even feasible and that owing to risk of building failure it is essential to remove occupants rapidly from the entire building. In the following it will be assumed that sufficient means of egress has been provided to permit most of the building popu-
lation (y = 0.01) to be evacuated before fire-exposed
structural members are significantly weakened.
Influence of Active and Passive Measures
Each of the measures to reduce fire loss expecta- tion, i.e., active or passive measures or evacuation,
-
TOTAL E V A C U A T I O N-
( 7 = 0 . 0 1 ) I I I I I I 0 1 0 20 30 40 50 60 70 BO 90 100 N U M B E R O F S T O R E Y SFIG. 1. Expected life losses during service life of building as a function of building height for total and partial evacuation.
can be utilized individually or in combination. Which measures should be chosen depends on the level of safety desired, the effectiveness of each measure, and the cost. The value of these parameters depends on several factors, including type of building, materials used, and the effectiveness of the measures.
Statistics indicate that sprinklers reduce the number of large fires by a factor of 2 or more2 (Ramachandran 1969; Rogers 1977), and that cost varies from about 1-3% of the building cost (Rama- chandran 1969; Harrison 1974; Marryatt 1972). In this study it will be assumed that sprinklers reduce the probability of occurrence of a large fire by a factor of 2 and that cost is 2% of the building cost.
The cost of structural fire protection is, according to estimates, a small percentage of the building cost (Fry 1964; Silcock 1968), but it varies with the materials used as protection and the type of con- struction to be protected. Here it will be assumed that the cost of structural fire protection is 0.4% of the cost of the building per unit increase of the fire load safety factor.
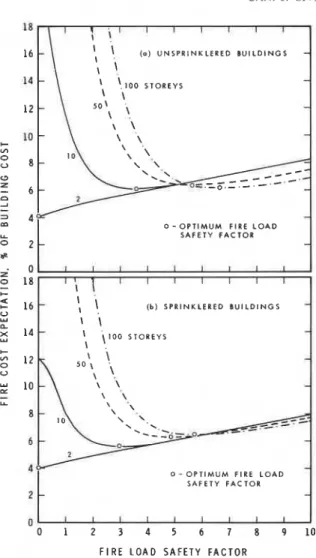
In Fig. 2 a and b the influence of the fire load safety factor on fire cost expectation is shown for buildings of various heights. The curves in Fig. 2a are for unsprinklered buildings, those in Fig. 2b for sprin- klered ones. It may be seen that for two-storey buildings the cost expectation increases with the safety factor, indicating that provision of fire resis- tance in these buildings is not economically justified. In practice, however, a minimum must be provided to allow people to evacuate the building. For higher buildings, provision of fire resistance is economically beneficial. There is an optimum value of the fire load safety factor for which the fire cost expectation is minimal.
Provision of sprinkler protection reduces the optimum safety factor. According to the data in Fig.
2 a and b, installation of sprinklers justifies a reduc-
tion in fire resistance requirements of about 15-20%. In addition, sprinkler protection reduces the life loss expectation, as shown in Table 2. These reductions indicate that sprinkler protection is beneficial, even in low ones, for buildings in which each storey is a fire resistive compartment. In the following it will be assumed, therefore, that the buildings are sprinklered.
Influence of Variables on Safety Factor In the preceding section a set of values for the variables of the model was selected to represent standard conditions. In practice, they vary depending
2M. A. Galbreath. National Research Council of Canada,
622 CAN. J. CIV. EI VG. VOL. 6 , 1979
-
'
, ( 0 ) U N S P R l N K L E R E D B U I L D I N G S-
\ \,-
'
!100 STOREYS-
-
-
-
I 0 - O P T I M U M FIRE L O A D ( b ) SPRINKLERED B U I L D I N G S x 14 Y 0 - O P T I M U M FlRE L O A D SAFETY F A C T O R-I
F l R E L O A D S A F E T Y F A C T O RFIG. 2. Fire cost expectation as a function of fire load safety factor for various building heights (unsprinklered and sprinklered buildings).
TABLE 2. Influence of sprinklers on life loss expectation (assuming the optimum fire re-
sistance is provided)
Expected number of life losses during service life of building
(50 years) Number of
storeys Unsprinklered Sprinklered
2 0.16 0.08 10 0.12 0.10 50 0.60 0.53 100 1.28 1.14
upon circumstances, for example, type of building, its contents, occupancy, etc. To obtain information on how the results are affected by deviations from the assumed standard values, their influence was examined in more detail. Extreme values were estimated, one representing the upper limit of the
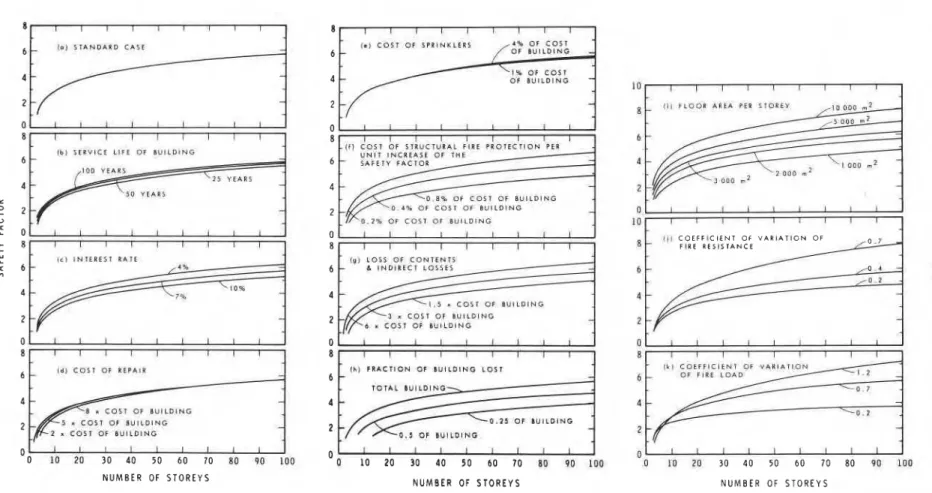
variables and one the lower limit. Using these, the optimum safety factors were evaluated for a large number of conditions. The influence of the variables under consideration is shown in Figs. 3 and 5, where the optimum fire load safety factor is given as a function of building height for various values of variables. Figure 3a shows the curve for the standard set. It begins at a value of the safety factor of about 1.2 for a three-storey building and increases, initially rather steeply with building height to about 10 storeys, and then more gradually for higher buildings. For buildings lower than three storeys the optimum safety factor is zero. In all cases, however, a minimum fire resistance must be provided to allow people to leave.
Cost of Building
Because, in the model, all costs and losses are expressed as a ratio of building cost, the optimum fire load safety factor depends on these ratios only. As a rule the safety factor increases with building value. How variation in the cost and loss ratios affects the optimum fire load safety factor is shown in the following sections.
Occu~ant Load
T& occupant load does not affect the optimum safety factor if means of egress are provided that are consistent with occupant load. If means of egress are inadequate it might not be feasible to the target safety level in tall buildings, as explained before (Fig. 1).
Service Life of Building
The results in Fig. 3b show that the optimum safety factor increases with the planned service life of the building, although this influence is very small.
Interest Rate
The influence of interest rate on the optimum safety factor is shown in Fig. 3c. It is more pro- nounced than that of service life of the building, but it is still small. A deviation of 3% from the standard rate of interest (7%) gives a maximum difference in safety factor of about 10%.
Cost of Repair
The influence of cost of repair on the optimum safety factor is shown in Fig. 3d. For buildings lower than four storeys it is substantial, but for higher buildings it is small. Because of the high cost of repair (Lie 19723) it is usually not economical to provide structural fire protection in very low build- ings for the purpose of saving the building.
Cost of Sprinklers
As shown in Fig. 3e the influence on the optimum safety factor of the cost of sprinklers, or in more
-
- -- (.I C O S T OF S P l l l t J ~ L E R S O F I U I L D I N G OF I U I L D I N G 10 I I I I I I I l I 2 I l l F L O O R A R E A P E 1 S 1 0 4 E Y 111 0 0 0 r r P 6-
\ ~ I O 0 0 , 2-
L 2o o n m 2 2 --
0 4 % O F C O S l O F B U I L D I N G 0 I I I 1 I l I L I 0 . 2 % OF C O S T OF 8 U I L D I N G 10 I 1 I I I I I I I (11 C O E F F I C I E N T 0 6 V A R I A T I O N O F FIRE R E S I S T A N C E o,., 7 4 c l I N T E R E S T RATE 101 L O S S O f C O N T E N T S /0.4-
r / o 2-
-
m 4 --
I 3 r COST O F I U I L D I N G 4 r C O S T OF W I L D I N G 2-
Ih) F R A C T I O N O f 1 U I L O I N O L O S T 1 L 1 C O E F F I C l t N T O F V A R l A l l O N O F FIRE L O A O 0 10 20 30 4 0 5 0 6 0 70 80 90 100 0 10 20 30 4 0 5 0 60 70 80 (10 100 0 10 20 30 4 0 50 6 0 70 80 90 100 N U M B E R OF S T O R E Y S N U M B E R O F S T O R E Y S N U M B E R O F S T O R E Y SFIG. 3. Optimum fire load safety factor as a function of building height for various conditions.
624 CAN. J. CIV. ENG. VOL. 6 . 1979
general terms the cost of active fire protection, is very ability of fire resistance becomes important in de-
small. termininp, the ovtimum safetv factor.
Cost of Structural Fire Protection
How the cost of structural fire protection affects the optimum safety factor is shown in Fig. 3J: In general, the higher the cost the lower the optimum safety factor. A deviation from the standard cost (0.4% of cost of building per unit increase of the fire load safety factor) by a factor of 2 affects the opti- mum safety factor by about 25% for low buildings and by about 15% for higher ones.
Loss of Contents and Indirect Losses
The influence of loss of contents and indirect losses is shown in Fig. 3g, where optimum safety factors are given for values of these losses of, respectively, 1.5, 3 (standard loss), and 6 times the cost of the building. It may be seen that a deviation in losses by a factor of 2 from the standard loss affects the optimum safety factor by about 15% for higher buildings and by about 30% for low ones.
Fraction of Building Lost
It is possible to set a bound on the fraction of the building that may be lost should a fire occur. How the fraction of the building lost affects the optimum safety factor is shown in Fig. 3h. The curves suggest that it is beneficial to divide a building into two or more areas in such a way that fire in one area would almost certainly not affect other areas. This can be achieved, for example, by provision of fire separa- tions with a high fire resistance or by installing roof vents to remove the heat developed in a fire. In return it is justified to substantially reduce the fire resistance of those components that are not essential for the prevention of spread of fire from one area to another.
Floor Area of the Building
The influence of floor area on the optimum safety factor of a building is shown in Fig. 3i. Because in practice there is a wide range of floor areas, the variation of the safety factor owing to variation of floor area may be substantial. According to the curves in Fig. 3i a deviation from the standard floor area (2000 m2 per storey) by a factor of 2 affects the optimum safety factor by roughly 20%; and devia- tion from the standard floor area by a factor of 4 affects the safety factor by roughly 40%.
Variability of Fire Resistance
The influence of variability of fire resistance on the optimum fire load safety factor is shown in Fig. 3j. For low buildings the influence is relatively small, but it increases with building height. For buildings higher than about 10 storeys the influence of vari-
variability
OF
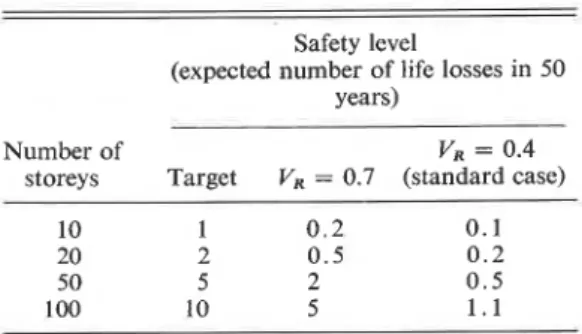
fire resistance is caused by many uncertainties inherent in the design and construction of fire resistant buildings. Such factors include errors in analyses, quality of the materials used, uncertaintie; with regard to material properties, and quality of workmanship. At present only meagre data exist concerning the variability of fire resistance of structural members (Lie 1972b). Calculated results indicate, however, that if a safety factor is incorpor- ated in the design corresponding to that of the standard case (coefficient of variation = 0.4), sub- stantial variabilities can be permitted before the safety level becomes less than the target safety level. This is illustrated in Table 3, where the life loss expectation for standard variability (V, = 0.4) and for a higher variability ( V R = 0.7) are compared with the target life loss expectation.Some factors may give rise to very high variability in fire resistance and it is apparent that they may lead to unacceptable risks. These include:
a. Variability in thickness of protection. This is one of the most common causes of variability in fire performance and can be prevented by inspection.
b. Unprotected openings in walls and floors. This also can be prevented by inspection.
c. Sudden loss of protection. One of the main causes of loss of protection is unequal expansion or shrinkage of protection and protected material and, as a consequence, a falling off of protection. Deterior- ation of the material and spalling may also cause sudden loss of protection.
d. Excessive lateral displacement of load-bearing walls and columns during fire exposure.
e. Excessive restraint of thermal expansion causing early failure of a member
Variability of Fire Load
How variability of fire load affects the optimum safety factor is shown in Fig. 3k, where it may be seen that the influence of variability of fire load is
TABLE 3. Influence of variability of fire resistance on life loss expectation
Safety level
(expected number of life losses in 50 years)
Number of VR = 0.4
storeys Target VR = 0.7 (standard case) 10 1 0 . 2 0.1 20 2 0 . 5 0 . 2
50 5 2 0.5 100 10 5 1 . 1
LIE 625
more pronounced for high buildings than for low ones. Recent fire load survegs in offices (National Academy of Sciences 1977) show that for these occupancies a coefficient of variation of fire load of 0.7 (standard case) is a reasonable value. Variability is mainly caused by the many uses to which spaces or rooms are put. In an office building, for example, offices, lobbies, conference rooms, filing, storage, and library spaces have different fire loads.
According to the curves in Fig. 3k the optimum safety factors are much lower if variability is low, suggesting that a substantial gain in safety and reduction in property loss can be obtained by controlling variability of fire load. For the types of building considered in the present study, i.e., those in which each storey is a fire resisting compartment, it means that fire load concentrations creating large differences in fire load from storey to storey must be avoided. Fire load concentrations in one or more rooms in a storey, however, will not significantly affect the safety of the building, provided the fire load in the storey as a whole remains approximately the same as that in other storeys. It should be noted that although variability of fire load has substantial in- fluence on the fire load safety factor and thus on the design fire load, it is the mean fire load that is of primary importance in determining the design fire load.
Fire Frequency
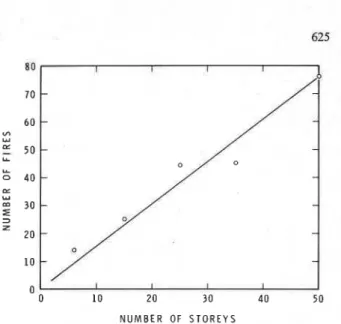
In practice, the extent of the fire protection mea- sures that have to be taken in a building is related to "fire risk." So far, however, there has been no clear definition of what precisely constitutes fire risk. In this study it will be defined as the expected average annual loss from fire during the planned service life of a building capitalized at the time of the con- struction of the building. An important factor that determines fire risk is the expected rate of occurrence of fire in the building. In a previous study (Lie 19423) it was postulated that the number of fires in a building during its service life is proportional to the floor area of the building and to its service life. For a given building this number is determined by a proportionality factor p, which may be termed the fire frequency. The value of this factor depends predominantly on occupancy, but it is also affected by the extent to which active fire protection measures are provided in the building, for example, sprinkler protection and detection.
A later survey of fire occurrence in about 1700 offices of various sizes and heights confirmed the validity of the assumption that the number of fire occurrences is approximately proportional to floor
N U M B E R OF S T O R E Y S
FIG. 4. Number of fires per year per 1000 buildings as a function of building height.
area (Wiggs 1973). This is illustrated in Fig. 4 where the number of fires pez<year per 1000 buildings is plotted as a function of building height.
Assuming that roughly 1 of 10 reported fires becomes large,3 it can be estimated, using the results of the survey, that for sprinklered offices the fire frequency is approximately 1 x per m2 per year. In the present study this value has been used for the standard case.
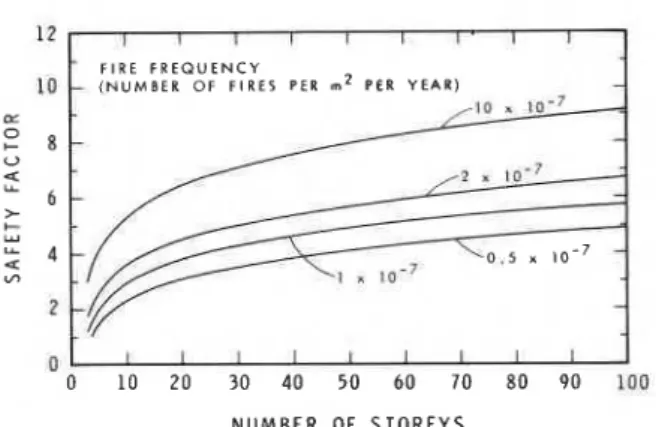
How fire frequency affects the optimum safety factor is shown in Fig. 5. Because the fire frequency for various occupancies varies in a wide range, its influence on the optimum safety factor is substantial. For example, the frequency of occurrence of fire is greater for residential buildings than for offices. For industrial buildings it may be a factor of 10 higher than that for offices (Rogers 1977), and consequently the optimum safety factors for these buildings are considerably higher than those for offices.
To determine the appropriate fire protection for buildings, knowledge of the fire frequency is essen- tial. Although data on fire frequencies are still meagre, the results of the survey of offices (Wiggs 1973) provide useful information. In addition, anothe; attempt has been made to obtain values of fire frequencies for various types of occupancies, using data of Naval on-shore fires (Lee and Collins 1977).
Comparison with Code Requirements
One way to verify the validity of the mathematical model is to compare calculated results with informa- tion obtained from past experience. At present the
3A. M. Phillips. National Research Council of Canada, Ottawa. Unpublished information.
626 CAN. J. CIV. ENG. VOL. 6 . 1979 I I I I I I I I T
-
FIRE F R E Q U E N C Y - ( N U M B E R O F F I R E S P E R rnZ P E R Y E A R ) - 1 0 = 1 0 - 7-
/ ?.
tn-7-
L 0 . s.
1 0 - 7-
-
t I I I l I I I I N U M B E R O F S T O R E Y SFIG. 5. Optimum fire load safety factor as a function of building height for various fire frequencies.
NUMBER OF STOREYS
FIG. 6. Comparison optimum fire resistances according to model with code requirements for various building heights.
only existing information based on past experience is that incorporated in building codes. In this study a number of North American codes (Harrison 1974), including the National Building Code of Canada (1977), have been selected for comparison. As the model and the values used in it (Table 1) are rep- resentative of office buildings, the comparison will be made for these.
Codes express fire resistance in terms of the hours a member is capable of resisting exposure to a standard fire (see, for example, American Society for Testing and Materials 1977), whereas the model uses the fire load the member can resist as a measure of fire resistance. It will be necessary, therefore, to convert one measure into the other. For simplicity it will be assumed that every unit of the fire load safety factor is equivalent to 1 hour's standard fire re~istance.~ How the optimum fire resistance, according to the model, compares with code requirements is shown in Fig. 6. For building heights of three to six storeys the model and NBC requirements are in close agree-
41n general, the conversion of hours standard fire resistance into critical fire load depends on several factors, for example, type of occupancy, type of exposed member, and dimensions of openings through which air, necessary for combustion of the fire load, can enter the fire compartment. For office buildings supported by protected steel having windows of intermediate size, for example, the assumption that every unit of the fire load safety factor is equivalent to 1 hour's standard fire resistance is realistic (Lie 1978).
ment. For buildings lower than three storeys the NBC specifies 314 h standard fire resistance, whereas the model demands no fire resistance. As has been shown, fire resistance for very low buildings is un- economical, but a minimum has to be provided to allow people to evacuate the building before the structure is significantly weakened. Because normally not more than 10-15 min are required to evacuate a low building (and taking into account the fact that provision of fire resistance is uneconomical), it seems justified to relax existing requirements for one- and two-storey buildings.
For buildings higher than six storeys the NBC requires at least 2 hours' fire resistance. According to the model the fire resistance has to be increased with building height in order to provide optimum protection. For very tall buildings there is a sub- stantial discrepancy between the NBC and the model. If the model is compared with other North American codes, however, it agrees reasonably well with the Uniform Building Code (UBC) 1973 for building heights in the range of 7-15 storeys, and with the New York City Local Law No. 5 (NYC) 1973 for building heights in the range 16-35 storeys. For buildings higher than about 3 5 4 0 storeys the model indicates that fire resistances of about 5 h are appropriate for key members, whereas existing North American Code requirements do not go higher than 4 h.
The soundness of increasing fire resistance with building height can be shown. It is obvious that, on an average, the more storeys a building comprises the more locations there will be for fires to start. In addition, the value a building represents increases with the number of storeys. As a consequence, fire loss expectation increases progressively with number
NUMBER OF STOREYS I
FIG. 7. Illustration of progressive increase of property and life loss expectation with building height.
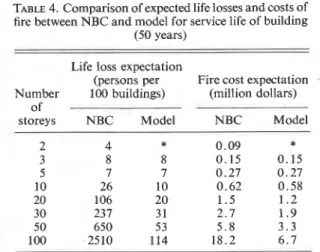
TABLE 4. Comparison of expected life losses and costs of fire between NBC and model for service life of building
(50 years) Life loss expectation
(persons per Fire cost expectation
Number 100 buildings) (million dollars)
of
storeys NBC Model NBC Model
*Accordine to the model the ovtimum fire resistance is zero. but a minimum h& lo be provided ro blow people to evacuate rhebuild- ing. The loss and cost expectations depend on the selected min~mum fire resistance.
of storeys, and it is justified, therefore, to increase the fire resistance of a building with its height. The progressive increase of loss expectation with building height is illustrated in Fig. 7, where expected property and life losses during the service life of a building (50 years) are plotted as a function of building height for a fire resistance of 1 h.
In Table 4 the expected life losses and costs of fire (sum of property losses and cost of fire protection) for a building in which fire resistance is provided according to the NBC are compared with loss and cost expectations for a building in which fire resis- tance is that recommended by the model. The results suggest that considerable savings in future life and property losses can be obtained by implementing fire resistance requirements derived from the mathe- matical model.
Conclusions
With the aid of mathematical models the iustifiable
i fire protection for buildings can be determined. Fire
protection measures can therefore be optimized more
I
accurately than is possible by present methods, which are based entirely on judgement and experience. How close the optimum measures can be approached will depend, naturally, on the accuracy with which the values of the factors that determine these measures are known.The results of the present study indicate that: 1. Sprinkler protection in large undivided areas is beneficial, irrespective of the height of the building. It reduces both fire cost and life loss expectation.
2. Structural fire protection is not economically beneficial for buildings lower than three storeys. For such buildings only a minimum fire resistance has to be provided to allow people to evacuate the building.
3. Because loss expectation increases substantially
with building height, it is justified to provide fire
resistance that continuously increases with the height of the building.
4. Of the variables known for a specific building, height and storey floor area are the most important factors that determine optimum fire resistance.
5. Of the variables that have to be determined statistically, the most important factors that deter- mine the optimum fire resistance are mean fire load and fire frequency. These factors are strongly de- pendent on occupancy and much can be gained by obtaining information on these factors for various occupancies.
Variability of fire load and fire resistance are additipnal important factors, although their influence is considerably less than that of fire load and fire frequency.
Acknowledgement
This paper is a contribution from the Division of Building Research, National Research Council of Canada, and is published with the approval of the Director of the Division.
ALLEN, D. E. 1968. Discussion of choice of failure probabilities
by C. J. Turkstra. ASCE Journal of the Structural Division, 94(ST9), pp. 2169-2173.
1975. Limit states design-a probabilistic study. Cana- dian Journal of Civil Engineering, 2, pp. 36-49.
AMERICAN SOCIETY FOR TESTING A N D MATERIALS. 1977. Stan-
dard methods of fire tests of building construction and mate- rials. American Society for Testing and Materials, book of ASTM standards, Part 18, ASTM E119-76.
BALDWIN, R., and THOMAS, P. H. 1974. Passive and active fire
protection-the optimum combination. Fire Technology, 10,
pp. 140-146.
BENJAMIN, J. R. 1968. Probabilistic model for seismic force
design. ASCE Journal of the Structural Division, 94(ST5), Proceedings Paper 5950, pp. 1175-1 196.
BENJAMIN, J. R., and CORNELL, C A. 1970. Probability, statis-
tics and decision for civil engineers. McGraw-Hill Book Co., New York, NY. pp. 266-267.
BURROS, R. H. 1975. Probability of failure of building from fire.
ASCE Journal of the Structural Division, 101(ST9), Pro- ceedings Paper 11567, pp. 1947-1960.
FREUDENTHAL, A. M. 1956. Safety and the probability of
structural failure. Transactions of the American Society of Civil Engineers, 121, pp. 1337-1397.
FRY, J. F. 1964. The cost of fire. Fire, 56, pp. 591-594.
GOODWIN, P. B., and HUTCHINSON, T . B. 1977. The risk of
walking. Transportation, 6, pp. 217-230.
HANAI, M. 1974. Optimum design based on structural reli- ability. Japan, U.S. Joint Seminar on Reliability Approach in Structural Engineering, Japan Society for the Promotion of Science and the U.S. National Science Foundation. Tokyo, pp. 133-146.
HARRISON, G. A . 1974. The high-rise fire problem. CRC Critical
Reviews in Environmental Control, 4, pp. 483-505.
INTERNATIONAL FIRE STATISTICS. 19737 Fire Journal, 67, pp.
50-5 1.
JOHNSON, A. I. 1953. Strength, safety, and economical dimen-
sions of structures. Royal Institute of Technology, Stock- holm, Sweden, Medd. No. 12, pp. 129-131.
LEE, L. T., and COLLINS, J. D. 1977. Engineering risk manage-
ment for structures. ASCE Journal of the Structural Division, 103 (ST9), pp. 1739-1756.
628 CAN. J. CIV. ENG. VOL. 6, 1979
LIE, T. T. 1972a. Fire and buildings. Applied Science Publishers Ltd., London, England. 284 p.
19726. Optimum fire resistance of structures. ASCE Journal of the Structural Division, 98(ST1), Proceedings Paper 8638, pp. 215-232.
1978. Fire resistance of structural steel. Engineering f
Journal, 15, pp. 116-125.
MARRYATT, H. W. 1972. ASCE-IABSE: International Confer-
ence on Planning and Design of Tall Buildings, 16, pp. h
681-687.
N A T ~ ~ N A L ACADEMY OF SCIENCES. 1977. Fire and live loads in
buildings. Committee on Fire and Live Loads in Buildings of the Building Research Advisory Board, National Academy of Sciences, Washington, DC.
NATIONAL BUILDING CODE OF CANADA. 1977. Associate
Committee on the National Building Code, National Research Council of Canada, Ottawa, Canada.
OTWAY, H. J., BATTAT, M. E., LOHRDING, R. K., TURNER,
R. D., and CUBITT, R. L. 1970. A risk analysis of the Omega
West Reactor. Los Alamos Scientific Laboratory, University of California. 34 p.
PAULS, J . L . 1974. Building evacuation and other fire-safety
measures: some research results and their application to building design, operation and regulations. 5th Annual Con- ference, Environmental Design Research Association, Uni- versity of Wisconsin.
P ~ G S L E Y , A. 1966. The safety of structures. Edward Arnold
Ltd., London, England. pp. 86-88.
RAMACHANDRAN, G. 1969. An assessment of the economic
value of sprinklers. Ministry of Technology and Fire Offices' Committee, Joint Fire Research Organization, Fire Research Station, Internal Note No. 345, Borehamwood.
ROGERS, F. E. 1977. Fire losses and the effect of sprinkler
protection of buildings in a variety of industries and trades. Building Research Establishment, Fire Research Station, Borehamwood, CP 9/77.
SILCOCK, A. 1968. Fire protection of buildings-what does it
cost? Fire, 60, pp. 461-462.
TURKSTRA, C . J . 1967. Choice of failure probabilities. ASCE
Journal of the Structural Division, 93(ST6), Proceedings Paper 5678, pp. 189-200.
WIGGS, R. C. 1973. BOMA international office building fire survey. Skyscraper Management, 58(6), p. 14.
WITTEVEEN, J., and TWILT, L . 1974. Principles of fire en-
gineering design. Fire Safety in Constructional Steelwork, European Convention for Constructional Steelwork.
i I Kl, K2 K3 m n Nc NL P P f P f f Pm = PAF
Q
r R Rm t~ t ffire during the planned service life of the building, converted into their value at the time of completion of the build- ing
= cost of building per unit floor area, exclusive of cost of fire safety measures
= height of the building expressed in number of storeys
= interest rate minus mean inflation rate
= ratio of cost of repair to building cost
= coefficients
= ratio of the sum of loss of contents and indirect losses to building cost
= fire load safety factor (ratio of mean fire resistance to mean fire load)
= number of compartments
= number of compartments lost by fire
= mean number of large fires per unit floor area of the building per unit time
= conditional probability of failure,
given a large fire
= probability of failure by fire during planned service life of building
= mean rate of occurrence of large fires in the building
= expected monetary cost of fire (sum of
monetary losses and cost of fire safety measures), during the planned service life of the building, converted into its value at the time of completion of the building
= rate of evacuation (number of people leaving the building per unit time) = fire resistance
= mean value of fire resistance = planned service life of the building = time of failure of the building counted
from the start of the fire
Nomenclature V-R = coefficient of variation of fire resistance
A F = floor area of the building
A s = floor area of a storey
CL = number of people in the building at the
time of failure
CT = total cost of fire safety measures per
unit floor area of the building
ex,
= cost of active measures (fraction ofbuilding cost)
cp,, = cost of passive measures per unit in-
crease of the fire load design factor (percentage of building cost exclusive of cost of measures)
EL = expected life loss due to failure of the
structure by fire during the planned service life of the building
E = expected monetary losses caused by
= coefficient of variation of fire load = fire load
.
= mean value of fire load= pfpm = mean number of failures per unit time
= fraction of the population still in the building at the time of failure
= standard deviation of fire resistance = standard deviation of fire load
= time of fire counted from completion of the building
In {n[(vw2
+
l)/(vR2+
1)]1'2)-
-
(2 In [(l
+
Vw2)(1+
VR2)]}1/2= occupant load (the number of people per unit floor area for which the building is designed)