Publisher’s version / Version de l'éditeur:
The Astrophysical Journal, 852, 2, p. 108, 2018-01-12
READ THESE TERMS AND CONDITIONS CAREFULLY BEFORE USING THIS WEBSITE. https://nrc-publications.canada.ca/eng/copyright
Vous avez des questions? Nous pouvons vous aider. Pour communiquer directement avec un auteur, consultez la première page de la revue dans laquelle son article a été publié afin de trouver ses coordonnées. Si vous n’arrivez pas à les repérer, communiquez avec nous à PublicationsArchive-ArchivesPublications@nrc-cnrc.gc.ca.
Questions? Contact the NRC Publications Archive team at
PublicationsArchive-ArchivesPublications@nrc-cnrc.gc.ca. If you wish to email the authors directly, please see the first page of the publication for their contact information.
Archives des publications du CNRC
This publication could be one of several versions: author’s original, accepted manuscript or the publisher’s version. / La version de cette publication peut être l’une des suivantes : la version prépublication de l’auteur, la version acceptée du manuscrit ou la version de l’éditeur.
For the publisher’s version, please access the DOI link below./ Pour consulter la version de l’éditeur, utilisez le lien DOI ci-dessous.
https://doi.org/10.3847/1538-4357/aaa12a
Access and use of this website and the material on it are subject to the Terms and Conditions set forth at
A detailed observational analysis of V1324 Sco, the most
gamma-ray-luminous classical nova to date
Finzell, Thomas; Chomiuk, Laura; Metzger, Brian D.; Walter, Frederick M.;
Linford, Justin D.; Mukai, Koji; Nelson, Thomas; Weston, Jennifer H. S.;
Zheng, Yong; Sokoloski, Jennifer L.; Mioduszewski, Amy; Rupen, Michael P.;
Dong, Subo; Starrfield, Sumner; Cheung, C. C.; Woodward, Charles E.;
Taylor, Gregory B.; Bohlsen, Terry; Buil, Christian; Prieto, Jose; Wagner, R.
Mark; Bensby, Thomas; Bond, I. A.; Sumi, T.; Bennett, D. P.; Abe, F.;
Koshimoto, N.; Suzuki, D.; Tristram, P. J.; Christie, Grant W.; Natusch, Tim;
Mccormick, Jennie; Yee, Jennifer; Gould, Andy
https://publications-cnrc.canada.ca/fra/droits
L’accès à ce site Web et l’utilisation de son contenu sont assujettis aux conditions présentées dans le site LISEZ CES CONDITIONS ATTENTIVEMENT AVANT D’UTILISER CE SITE WEB.
NRC Publications Record / Notice d'Archives des publications de CNRC:
https://nrc-publications.canada.ca/eng/view/object/?id=9fd3743c-5935-4a21-bd1c-ef6167868b8d https://publications-cnrc.canada.ca/fra/voir/objet/?id=9fd3743c-5935-4a21-bd1c-ef6167868b8d
A DETAILED OBSERVATIONAL ANALYSIS OF V1324 SCO, THE MOST GAMMA-RAY LUMINOUS CLASSICAL NOVA TO DATE
Thomas Finzell1, Laura Chomiuk1, Brian D. Metzger2, Frederick M. Walter3, Justin D. Linford4,5, Koji Mukai6,7, Thomas Nelson8, Jennifer H. S. Weston9, Yong Zheng2, Jennifer L. Sokoloski2, Amy Mioduszewski10,
Michael P. Rupen11, Subo Dong12, Sumner Starrfield13, C.C. Cheung14, Charles E. Woodward15, Gregory B. Taylor16, Terry Bohlsen17, Christian Buil18, Jose Prieto19,20, R. Mark Wagner21,22, Thomas Bensby23, I.A. Bond24, T. Sumi25, D.P. Bennett26, F. Abe27, N. Koshimoto28, D. Suzuki25, P. J. Tristram29, Grant W. Christie30,
Tim Natusch30, Jennie McCormick31, Jennifer Yee32, and Andy Gould22 Draft version November 22, 2017
ABSTRACT
It has recently been discovered that some, if not all, classical novae emit GeV gamma rays during outburst, but the mechanisms involved in the production of the gamma rays are still not well un-derstood. We present here a comprehensive multi-wavelength dataset—from radio to X-rays—for the most gamma-ray luminous classical nova to-date, V1324 Sco. Using this dataset, we show that V1324
Sco is a canonical dusty Fe-II type nova, with a maximum ejecta velocity of 2600 km s−1 and an
ejecta mass of few ×10−5 M
⊙. There is also evidence for complex shock interactions, including a
double-peaked radio light curve which shows high brightness temperatures at early times. To explore why V1324 Sco was so gamma-ray luminous, we present a model of the nova ejecta featuring strong in-ternal shocks, and find that higher gamma-ray luminosities result from higher ejecta velocities and/or mass-loss rates. Comparison of V1324 Sco with other gamma-ray detected novae does not show clear signatures of either, and we conclude that a larger sample of similarly well-observed novae is needed to understand the origin and variation of gamma rays in novae.
Keywords: novae, cataclysmic variables, gamma rays: stars
1Department of Physics and Astronomy, Michigan State Uni-veristy, 567 Wilson Road, East Lansing, MI 48824-2320, USA
2Columbia Astrophysics Laboratory, Columbia University, New York, NY 10027, USA
3Department of Physics and Astronomy, Stony Brook Univer-sity, Stony Brook, NY 11794-3800, USA
4Department of Physics, The George Washington University, Washington, DC 20052, USA
5Astronomy, Physics, and Statistics Institute of Sciences, The George Washington University, Washington, DC 20052, USA
6CRESST and X-ray Astrophysics Laboratory, NASA/GSFC, Greenbelt, MD 20771, USA
7Department of Physics, University of Maryland, Baltimore County, 1000 Hilltop Circle, Baltimore, MD 21250, USA
8School of Physics and Astronomy, University of Minnesota, 116 Church Street SE, Minneapolis, MN 55455, USA
9Green Bank Observatory,P.O. Box 2, Green Bank, WV 24944 USA
10National Radio Astronomy Observatory, P.O. Box O, So-corro, NM 87801,USA
11National Research Council of Canada, Herzberg Astronomy and Astrophysics Programs, Dominion Radio Astrophysical Ob-servatory, Canada
12Kavli Institute for Astronomy and Astrophysics, Peking University, Yi He Yuan Road 5, Hai Dian District, Beijing 100871, China
13School of Earth and Space Exploration, Arizona State Uni-versity, Tempe, AZ 85287-1404, USA
14Space Science Division, Naval Research Laboratory, Wash-ington, DC 20375-5352, USA
15Minnesota Institute for Astrophysics, School of Physics and Astronomy, University of Minnesota, 116 Church Street S.E., Minneapolis,MN 55455
16Department of Physics and Astronomy, University of New Mexico, Albuquerque, NM, USA
17Mirranook Observatory, Boorolong Rd Armidale, NSW, 2350, Australia
18Castanet Tolosan Observatory, 6 place Clemence Isaure, 31320 Castanet Tolosan, France
19N´ucleo de Astronom´ıa de la Facultad de Ingenier´ıa, Univer-sidad Diego Portales, Av. Ej´ercito 441, Santiago, Chile
20Millennium Institute of Astrophysics, Santiago, Chile
21LBT, University of Arizona, 933 N. Cherry Ave, Room 552, Tucson, AZ 85721, USA
22Department of Astronomy, The Ohio State University, Columbus, OH 43210, USA
23Lund Observatory, Department of Astronomy and Theoret-ical Physics, Box 43, SE-221 00 Lund, Sweden
24Institute of Information and Mathematical Sciences, Massey University, Private Bag 102-904, North Shore Mail Cen-tre, Auckland, New Zealand
25Department of Earth and Space Science, Graduate School of Science, Osaka University, Toyonaka, Osaka 560-0043, Japan 26Laboratory for Exoplanets and Stellar Astrophysics, NASA/Goddard Space Flight Center, Greenbelt, MD 20771, USA
27Institute for Space-Earth Environmental Research, Nagoya University, Nagoya 464-8601, Japan
28Department of Earth and Space Science, Graduate School of Science, Osaka University, Toyonaka, Osaka 560-0043, Japan 29Mt. John University Observatory, P.O. Box 56, Lake Tekapo 8770, New Zealand
30Auckland Observatory, Auckland, New Zealand
31Farm Cove Observatory, Centre for Backyard Astrophysics, Pakuranga, Auckland, New Zealand
32Harvard-Smithsonian Center for Astrophysics, 60 Garden Street, Cambridge, MA 02138 USA
1. INTRODUCTION
Classical novae are the result of a thermonuclear run-away taking place on the surface of a white dwarf and are fueled by matter accreted onto the white dwarf from a companion star. These outbursts give rise to an in-crease in luminosity across the electromagnetic
spec-trum, and eject ∼ 10−3 − 10−7M
⊙ at velocities >
103 km s−1(Gallagher & Starrfield 1978; Prialnik 1986;
Yaron et al. 2005; Shore 2012; Starrfield et al. 2016).
1.1. Novae at GeV Energies
Nova outbursts have been detected in the GeV gamma-ray regime with the Fermi Gamma Ray Space Telescope and its Large Area Telescope (LAT; see e.g. Cheung et al. 2010, 2012a,b, 2015, 2016; Hays et al. 2013; Ackermann et al. 2014). They show gamma-ray luminosities (> 100
MeV) of 1034−1036erg s−1, lasting for 2–8 weeks around
optical maximum (Ackermann et al. 2014; Cheung et al. 2016).
The presence of gamma rays implies that there are relativistic particles being generated in the nova event. There are two potential classes of processes for produc-ing gamma rays from relativistic particles: leptonic and hadronic. In the leptonic class, electrons are acceler-ated up to relativistic speeds, and produce gamma rays via inverse Compton and/or relativistic bremmstrahlung processes (Blumenthal & Gould 1970; Vurm & Metzger 2016). In the hadronic process, it is ions that are being accelerated to relativistic speeds; these particles collide
with a dense medium to produce π0mesons, which then
decay to gamma rays (Drury et al. 1994). The likely source of the accelerated particles is strong shocks, which can accelerate particles to relativistic speeds via the dif-fusive shock acceleration mechanism (Blandford & Os-triker 1978; Bell 1978; Metzger et al. 2014).
The first nova detected by Fermi /LAT was V407 Cyg, and it received considerable attention (Abdo et al. 2010; Aliu et al. 2012; Chomiuk et al. 2012a; Esipov et al. 2012; Mukai et al. 2012; Nelson et al. 2012; Orlando & Drake 2012; Shore et al. 2012; Martin & Dubus 2013). Given that V407 Cyg has a Mira giant secondary with a dense wind (a member of the symbiotic class of systems), a model to explain the gamma rays was proposed wherein a shock was generated as the nova ejecta interacted with the dense ambient medium. A similar model was pro-posed to explain the inferred presence of relativistic par-ticles in another star with a giant wind, RS Oph (Tatis-cheff & Hernanz 2007).
These models, however, could not explain subsequent novae detected by Fermi /LAT: V1324 Sco, V959 Mon, V339 Del (Ackermann et al. 2014) and V1369 Cen and V5668 Sgr (Cheung et al. 2016). These systems do not have a detectable red-giant companion (see, e.g., Finzell et al. 2015; Munari et al. 2013; Munari & Henden 2013; Hornoch 2013; although note that the underlying binary of V5668 Sgr has yet to be identified). While it is theo-retically possible for these novae to have high density cir-cumstellar material despite not having a red-giant com-panion (Spruit & Taam 2001), no evidence has yet been found for substantial circumstellar material around cat-aclysmic variables (Harrison et al. 2013). Therefore, the non-detection of red-giant companions implies that these novae have main-sequence companions with low-density
circumstellar material.
It is in fact much more likely that the shocks are be-ing produced within the ejecta, due to different com-ponents of the ejecta colliding with one another (inter-nal shocks). There has already been long standing ev-idence for internal shocks in classical novae from X-ray observations (e.g., O’Brien et al. 1994; Mukai & Ishida 2001). One idea for generating internal shocks in novae was put forward by Chomiuk et al. (2014a), supported by radio imaging. First, the binary interacts with the puffed-up nova envelope, resulting in a relatively slow flow with density enhancement along the binary orbital plane. Later, a separate, fast wind is launched from the white dwarf. When these two outflows collide with one another, they produce shocks. Progress has been made on the theoretical front, by constraining the shock con-ditions necessary to explain both the thermal and non-thermal emission observed in gamma-ray detected novae, and finding them consistent with condition expected in novae (Metzger et al. 2014; Vlasov et al. 2016; Metzger et al. 2016; Vurm & Metzger 2016).
1.2. V1324 Sco
The goal of this paper is to use a multi-wavelength analysis of the gamma-ray detected nova V1324 Sco, in order to assess the causes and energetics of the shocks that yield GeV gamma rays. V1324 Sco was originally discovered at optical wavelengths by the Microlensing Observations in Astrophysics collaboration (MOA; Wag-ner et al. 2012). From their high-cadence monitoring of the Galactic bulge, MOA noticed a transient appear on 2012 May 22.8 UT at RA = 17h50m53.90s and Dec
= −32◦37′20.46′′ (J2000). Between 2012 May 22–2012
June 1, this source brightened only gradually, and its brightness was modulated with a periodicity of ∼1.6 hr. Starting on 2012 June 1, the source brightened much more rapidly (see Section 2), and a spectrum obtained on 2012 June 4 identified the transient as a classical nova (Wagner et al. 2012). In retrospect, the gradual bright-ening over the week prior to June 1 is likely a nova “pre-cursor” event; similar events have been observed in a handful of other novae but remain poorly understood (Collazzi et al. 2009). The precursor event is outside the scope of this paper and will be the subject of Wagner et al. (2017, in preparation), although it can be see in Figure 1.
Shortly thereafter, the transient was found to be asso-ciated with GeV gamma rays, as detected by Fermi /LAT in its all-sky survey mode (Cheung et al. 2012b). The gamma rays were detected during the time range 2012
Jun 15–July 2 with an average flux, ∼ 5 × 10⁻⁷ photons
cm−2 s−1 (>100 MeV; Ackermann et al. 2014).
Acker-mann et al. also point out that the spectrum of V1324 Sco may extend to higher energies than the other gamma-ray detected novae, although the spectral analysis suffers from poor statistics above a few GeV.
Multi-wavelength observations were initiated during the period of gamma-ray detection, including observa-tions at radio (Chomiuk et al. 2012b; Section 3), in-frared (Raj et al. 2012), and X-ray wavelengths (Page et al. 2012; Page & Osborne 2013; Section 5). High-resolution spectra observed during the nova outburst allowed our team to measure absorption features, en-abling an estimate of reddening and placing a lower
-50.0 -30.0
-10.0
-5.0-3.0
3.0 5.0
10.0
30.0 50.0 100.0
300.0 500.0
Days Past 1 June 2012
6
8
10
12
14
16
18
20
I magnitude
A
B
C
D
E
Detected by Fermi
Phases of the Light Curve
Early Time Rise
Steep Optical Rise
Flattening of Optical Light Curve
Dust Event
Power Law Decline
Figure 1. I band light curve for V1324 Sco, generated using the MOA data set. The plot starts 49 days before primary optical rise, at the first date where a single observation (as opposed to a stacked observation) yields a 5σ detection. The dashed lines delineate the different phases of the light curve evolution, as described in Section 2. The gray shaded region denotes the time period when V1324 Sco was detected in gamma rays. Thanks to the extremely well-sampled MOA data set, we can see all of the different evolutionary phases of the optical light curve, as discussed in section 2.2. Note, that the X-axis takes the date of the primary optical rise (2012 June 1) to be day 0, so the plot starts on a negative value.
limit on the distance (Finzell et al. 2015). We estimate E(B − V ) = 1.16 ± 0.12. Three-dimensional redden-ing maps of the Galaxy (Schultheis et al. 2014) imply that V1324 Sco is > 6.5 kpc away (see also Munari et al. 2015 for similar results). V1324 Sco’s location near or beyond the Galactic bulge implies that it is signifi-cantly more gamma-ray luminous than other gamma-ray
detected novae (Lγ &2×1036erg s−1in the energy range
100 MeV–10 GeV, exceeding other novae by & order of magnitude; Finzell et al. 2015; Ackermann et al. 2014). We can also use this distance estimate to infer the nature of the nova host system; no underlying binary is detected
in the VVV survey down to mK< 16.6 mag (Minniti et
al. 2010), implying that the binary contains a dwarf star and not a red giant (Finzell et al. 2015).
While previous work has established the context of V1324 Sco, our goal here is to present a detailed picture of the nova outburst itself, to understand how gamma-ray producing shocks formed. Section 2 gives an overview of the outburst, as traced by UV/optical/near-IR (UVOIR) photometry. In Section 3 we present our radio data, and discuss a first peak in the radio light curve that is a strong indicator of shocks. We then use the second peak in the radio light curve to estimate the ejecta mass and kinetic energy of the outburst. In Section 4 we present the optical spectra and use them to constrain the kine-matics and filling factor of V1324 Sco’s outburst. In Sec-tion 5 we detail the X-ray limits and discuss how they are consistent with observations at other wavelengths. In Section 6 we summarize that V1324 Sco is—in all non-gamma-ray observations—a classical nova. We discuss how classical novae can produce a range of gamma ray luminosities, and the conditions that might lead to the highest gamma-ray luminosity observed from a nova to date. Finally, we conclude the paper in Section 7 by
summarizing our findings for V1324 Sco.
2. UVOIR PHOTOMETRY
In this section, we present the UVOIR light curve and describe the basic phases of the nova outburst evolution for V1324 Sco.
2.1. Observations and Reduction
V1324 Sco falls within one of the fields that the MOA Collaboration continually observes with the MOAII 1.8
meter telescope at Mt. Johns Observatory in New
Zealand. V1324 Sco was initially detected in 2012 April by their high-cadence I-band photometry (Wagner et al. 2012). The initial detection showed a slow monotonic rise in brightness between April 13 - May 31, followed by a very large increase in brightness starting June 1 (Fig-ure 1; Wagner et al. 2012). For the rest of this paper, we take 2012 June 1 to be day 0, or the start of the nova outburst. We also adopt the convention throughout this paper that all dates with − or + denote days before or after 2012 June 1, respectively.
All initial high-cadence observations, taken as part of the regular MOA program, were taken in the I-broad band, and were reduced using standard procedures (see Bond et al. 2001 for details). The MOA survey em-phasizes rapid imaging of the Galactic bulge fields; on a clear night an individual field will be imaged every ∼40 minutes. The result of this high time cadence photome-try can be seen in Figure 1. It should be noted that the primary purpose of the high-cadence observations is dif-ference imaging; as a result, the individual values should only be used to measure changes, not as an absolute mea-surement (Bond et al. 2001).
Table 1
Table of Photometric Data
Observation Date JD t − t0a Filter Mag Mag Error Observer/Group Telescope/Specific Filterb (Days)
2012 Apr 13 2456030.07502 -48.92499 I 18.700 0.150 MOA MJUO-Ibroad 2012 Apr 13 2456030.95591 -48.04410 I 18.770 0.090 MOA MJUO-Ibroad 2012 Apr 13 2456030.95714 -48.04287 I 18.590 0.090 MOA MJUO-Ibroad 2012 Apr 13 2456030.99663 -48.00338 I 18.800 0.110 MOA MJUO-Ibroad 2012 Apr 14 2456031.05194 -47.94807 I 18.760 0.090 MOA MJUO-Ibroad 2012 Apr 14 2456031.06304 -47.93697 I 18.900 0.110 MOA MJUO-Ibroad 2012 Apr 14 2456031.07414 -47.92587 I 18.850 0.090 MOA MJUO-Ibroad 2012 Apr 14 2456031.08652 -47.91348 I 18.860 0.110 MOA MJUO-Ibroad 2012 Apr 14 2456031.09762 -47.90238 I 19.030 0.110 MOA MJUO-Ibroad 2012 Apr 14 2456031.10976 -47.89024 I 18.660 0.070 MOA MJUO-Ibroad 2012 Apr 14 2456031.12211 -47.87789 I 18.930 0.120 MOA MJUO-Ibroad 2012 Apr 14 2456031.13321 -47.86679 I 18.890 0.100 MOA MJUO-Ibroad 2012 Apr 14 2456031.14435 -47.85566 I 18.830 0.100 MOA MJUO-Ibroad 2012 Apr 14 2456031.15670 -47.84331 I 18.860 0.090 MOA MJUO-Ibroad 2012 Apr 14 2456031.16781 -47.83220 I 18.950 0.110 MOA MJUO-Ibroad 2012 Apr 14 2456031.17893 -47.82108 I 18.890 0.090 MOA MJUO-Ibroad 2012 Apr 14 2456031.19127 -47.80874 I 18.910 0.090 MOA MJUO-Ibroad 2012 Apr 14 2456031.20237 -47.79764 I 18.880 0.120 MOA MJUO-Ibroad 2012 Apr 14 2456031.21348 -47.78653 I 18.850 0.090 MOA MJUO-Ibroad 2012 Apr 14 2456031.22585 -47.77416 I 18.880 0.100 MOA MJUO-Ibroad 2012 Apr 14 2456031.23825 -47.76176 I 18.750 0.090 MOA MJUO-Ibroad 2012 Apr 14 2456031.25182 -47.74818 I 18.870 0.090 MOA MJUO-Ibroad 2012 Apr 14 2456031.96000 -47.04001 I 18.610 0.080 MOA MJUO-Ibroad 2012 Apr 14 2456031.96123 -47.03877 I 18.700 0.080 MOA MJUO-Ibroad 2012 Apr 14 2456031.99908 -47.00093 I 18.880 0.120 MOA MJUO-Ibroad 2012 Apr 15 2456032.05184 -46.94817 I 18.740 0.100 MOA MJUO-Ibroad 2012 Apr 15 2456032.07405 -46.92596 I 18.840 0.130 MOA MJUO-Ibroad 2012 Apr 15 2456032.08742 -46.91258 I 18.920 0.100 MOA MJUO-Ibroad 2012 Apr 15 2456032.09855 -46.90146 I 18.810 0.100 MOA MJUO-Ibroad 2012 Apr 15 2456032.10966 -46.89035 I 18.770 0.090 MOA MJUO-Ibroad 2012 Apr 15 2456032.12200 -46.87801 I 18.880 0.150 MOA MJUO-Ibroad 2012 Apr 15 2456032.13311 -46.86690 I 18.740 0.100 MOA MJUO-Ibroad 2012 Apr 15 2456032.14421 -46.85580 I 18.850 0.100 MOA MJUO-Ibroad 2012 Apr 15 2456032.15655 -46.84346 I 18.740 0.090 MOA MJUO-Ibroad 2012 Apr 15 2456032.16869 -46.83132 I 18.780 0.090 MOA MJUO-Ibroad 2012 Apr 15 2456032.17989 -46.82012 I 18.910 0.090 MOA MJUO-Ibroad 2012 Apr 15 2456032.19224 -46.80777 I 18.960 0.100 MOA MJUO-Ibroad 2012 Apr 15 2456032.20335 -46.79666 I 18.890 0.080 MOA MJUO-Ibroad 2012 Apr 15 2456032.21445 -46.78556 I 18.800 0.080 MOA MJUO-Ibroad 2012 Apr 15 2456032.22683 -46.77317 I 18.840 0.070 MOA MJUO-Ibroad 2012 Apr 15 2456032.23920 -46.76081 I 18.840 0.100 MOA MJUO-Ibroad 2012 Apr 15 2456032.25030 -46.74971 I 18.820 0.080 MOA MJUO-Ibroad 2012 Apr 15 2456032.26264 -46.73736 I 18.960 0.190 MOA MJUO-Ibroad
... ... ... ... ... ... ... ...
Note. — All of these data, as well as data from AAVSO and Walter et al. (2012), can be found online.
a Taking t
0to be 2012 June 1.0
bWe abbreviate the different facilities used by the MOA and MicroFUN groups as: MJUO: Mt. John University Observatory; AUCK:
Auckland Observatory; CTIO: SMARTS 1.3 Meter Telescope.
triggered by the MicroFUN group33, who believed that
the transient was a potential microlensing event. Apart from the standard I-broad band filter, the MicroFUN follow up observations also used V and I Bessel filters. Other observations were made in B, V , and I filters us-ing the Small & Moderate Aperture Research Telescope System (SMARTS) 1.3 Meter telescope and Auckland Observatories.
Along with the MOA and MicroFUN data we also present multi-color photometry from Fred Walter’s on-going Stony Brook/SMARTS Atlas of (mostly) Southern Novae (see Walter et al. 2012 for further information on this dataset), as well as data from American Association
of Variable Star Observers (AAVSO)34. The SMARTS
data uses the ANDICAM instrument on the 1.3 meter 33http://www.astronomy.ohio-state.edu/~microfun/ 34https://www.aavso.org/data-download
telescope, and provide both optical (B, V , R, I) and near-IR (J, H, K) filters going from day +35 to day +124, while the AAVSO data use optical (V , B, R) fil-ters, and go from day +7 to day +445.
Finally, we incorporate the UV data taken contempo-raneously with the X-ray observations. The UV data comes from the Ultraviolet/Optical Telescope (UVOT; see Roming et al. 2005 for further details) on board Swift. Each observation was taken using the UVM2 filter, which
is centered on 2246 ˚A and has a FWHM of 498 ˚A (Poole
et al. 2008). These observations were taken at the same time as the X-ray observations (see Section 5), stretch-ing from day +22 to day 520; however, we only include observations where V1324 Sco was detected.
A portion of the UVOIR data set is presented in Ta-ble 1; the entire data set can be found in the online pub-lication. Multi-band photometry is plotted in Figure 2. Note that no attempt has been made to standardize the
photometry from different observatories.
2.2. Timeline of the Optical Light Curve
We present an overview of the different phases in the evolution of the optical light curve, to help orient the reader to the different qualitative variations. These dif-ferent phases come from the classification scheme laid out in Strope et al. (2010)—with the exception of the early time rise. Throughout this overview we will reference Figure 1 and Figure 2; note that while Figure 2 features multiple bands, it has significantly lower time resolution than Figure 1.
2.2.1. Early-Time Rise (Days −49 to 0)
The first MOA 5σ detection of V1324 Sco occurred on 2012 April 13. Following this, there was a monotonic increase in brightness that lasted until 31 May 2012. The total increase in brightness during this period was ∆I ≈ 2.5 mags (about ∼ 0.05 mags per day). This early-time rise can be seen as phase A of Figure 1.
This type of early-time rise has been observed twice before—in V533 Her and V1500 Cyg (Robinson 1975; Collazzi et al. 2009)—but no theory has been put forward to explain the phenomenon. It is worth noting that most novae lack pre-eruption photometry. Sky monitors like the Solar Mass Ejection Imager (SMEI) (Hounsell et al. 2010) and ASAS-SN (Shappee et al. 2014) have relatively shallow limiting magnitudes, preventing them from see-ing such faint early time rises. It is only with the type of dedicated, deep, high cadence observations like those of MOA that we can observe such a rise. Catching such an early time rise is unusual, and deserves a thorough analysis that goes beyond the scope of this paper. We therefore defer the discussion of this period to Wagner et al. (2017, in preparation).
2.2.2. Onset of the Steep Optical Rise (Days 0 to +10)
The slow monotonic rise was followed by a rapid in-crease in brightness; between day 0 and day +2 the
brightness increased by ∼ 2.2 mag day−1. Between
days +2.8 and +3.3 the rate of increase dropped to
∼ 1.1 mag day−1, and then between days +5.6 and +9.2
the rate dropped further to ∼ 0.3 mag day−1.
The next time V1324 Sco was visited, on day +12.9, the light curve appears to have flattened out. During the period, day 0 to day +9.2, the I band flux increased by a total of ∼9.1 magnitudes, with most of that rise occurring during the first ∼3 days. This rise can be seen as phase B of Figure 1. Note that the large uncertainty in measurement on day +2 is the result of binning the measurements during the steep optical rise.
2.2.3. Flattening of the Optical Light Curve (Days +10 to +45)
The dramatic increase in the optical flux was fol-lowed by a period with a much smaller change in bright-ness. This flattening in the light curve is not unique to V1324 Sco; Strope et al. (2010) show 15 examples of nova light curves with a similar flattening around peak, 10 of which also show a dust event. This “flat top” can be seen as phase C of Figure 1.
Note that the apparent fluctuations in the MOA light curve during this period are likely an artifact of observ-ing an unusually bright source (i.e., saturation). The
light curve around maximum is better represented by the CTIO photometry shown in Figure 2. The light curve shows a very gradual, gentle rise to a maximum, I = 8.2 mag on day +21. The light curve then gradually de-creases until about day +45, when a rapid decrease in flux is brought on by a dust event.
It is during the flattening of the optical light curve that we see both the gamma-ray emission as well as the beginning of the initial radio bump (see section 6.2 for further details).
2.2.4. Dust Event (Days +45 to +157)
The flattening of the optical light curve was followed by another rapid change in brightness, this time downwards. There was a very clear steep decline in optical and near-IR flux that took place from day +46 to day +78, and a subsequent recovery from day +79 to day +157. Only the MOA I band data had the cadence and sensitivity necessary to capture the minimum of the decrease; the I-band flux dropped by ∼ 8.5 magnitudes in the span of ∼ 30 days (Phase D in Figure 1). Figure 2 shows that this decline in flux occurred all the way out to the near-IR (although the decrease was much less in the near-near-IR bands, i.e. only ∼ 3.9 mags in K band). This decline in flux that preferentially affects the bluer light is the signature of a nova dust event.
A dust event occurs in a nova when the ejecta achieve conditions that are conducive to the condensation of dust—e.g., cool, dense, and shielded from ionizing radi-ation (Gallagher 1977; Gehrz 1988). The newly formed dust has a large optical depth; as a result a new, cooler, photosphere is created at the site of dust condensation.
2.2.5. Power Law Decline (Days +157 to End of Monitoring)
Following the post-dust event rebound, the magni-tude evolution followed a power law decline, with I ∝
(t − t0)0.2 (where t0 is 2012 June 1). This decline
con-tinues until the final observation from April 2014, when V1324 Sco fell below the MOA detection threshold. In Figure 1, the power-law decline is phase E, between day +228 and +730.
2.3. Discussion of the UVOIR light curve
In the optical regime, V1324 Sco is photometrically a
D (Dusty) class nova (Strope et al. 2010), because of the
extraordinary dust event that took place between days +46 to +157. Other D class novae include FH Ser, NQ Vul, and QV Vul (Strope et al. 2010). Among D-class novae, the speed of V1324 Sco’s photometric decline is
quite typical. V1324 Sco’s t2value—that is, the time for
a nova to decline by 2 magnitudes from maximum in V
band—is t2 ≈ 24 days. This is consistent with other D
class novae, all of which are of order tens of days (see Strope et al. 2010 and references therein).
In the case of V1324 Sco, the dust event includes a drop in flux all the way out to the near-IR. This suggests that the change in temperature from optical maximum was significant, and that the dust photosphere was cold. A fit to the near-IR colors at the epoch closest to the I band minimum suggest that the dust photosphere was < 1000 K. While dust events are quite common in novae—Strope et al. (2010) gives 16 examples of other such novae—there
5.0
7.5
10.0
12.5
15.0
17.5
B
ri
g
h
tn
es
s
(m
a
g
)
uvm2-5
B
V
R
I
J
H
K
3.0
10.0
30.0
100.0
Days Past 1 June 2012
1
2
3
4
5
C
ol
or
In
d
ex
(m
a
g
)
B-V
V-R
R-I
I-J
J-H
H-K
Figure 2. Top panel: Light curves of V1324 Sco in the optical/near-IR bands. Bottom panel: Evolution of optical and near-IR colors. The gray shaded region denotes the time period when V1324 Sco was detected in gamma rays. Using this figure we can see how the dust event hits the bluer bands first and then moves to redder wavelengths as time progresses. We can also see that the dust event caused a drop in brightness all the way out to the near-IR (JHK) wavelength regime.
are only a few novae with dust dips showing comparably cool photospheres (e.g. QV Vul and V1280 Sco; Gehrz et al. 1992; Sakon et al. 2015).
If the shocks in novae are dense and radiative (as pre-dicted by Metzger et al. 2014, 2015), then they are ideal locations for dust formation (Derdzinski et al. 2016). Ra-diative shocks can also explain the observed gamma-ray luminosity and non-detection in X-rays (Section 5; Met-zger et al. 2014). When compared to other gamma-ray detected novae in the AAVSO database (Kafka 2016), V1324 Sco had an unusually dramatic dust event. For example, there is no sign of dust formation in V959 Mon (Munari et al. 2015), and V339 Del showed signatures of dust formation at infrared wavelengths, but the event did not have a profound effect on the optical light curve (Gehrz et al. 2015; Evans et al. 2017). Derdzinski et al. (2016) find that some of these variations could be at-tributable to viewing angle, if dust preferentially forms along the orbital plane as would be expected in the geom-etry suggested by Chomiuk et al. (2014a). In addition, Evans & Rawlings (2008) point out that novae on CO white dwarfs are more likely to produce dust than no-vae on ONe white dwarfs. Observations of dust (or lack
thereof) in these three gamma-ray detected novae can be reconciled if V1324 Sco is viewed at an edge-on incli-nation and hosts a CO white dwarf, while V959 Mon’s binary hosts a ONe white dwarf viewed at high inclina-tion (Page et al. 2013; Shore et al. 2013), and V339 Del hosts a CO white dwarf but is observed at low inclination (Schaefer et al. 2014; Shore et al. 2016).
The origin of “flat tops” in novae remains something of an open question. In luminous red novae like V1309 Sco (which eject several orders of magnitude more mass than classical novae), Ivanova et al. (2013) proposed that a plateau around maximum is caused by a recombination front, much as in Type IIP supernovae (Chugai 1991). In this case, the light curve flattening near maximum is explained as a photosphere radius that does not change substantially in Eulerian coordinates (but shrinks in La-grangian coordinates) and has roughly constant temper-ature, due to the fact that the ejecta are cooling and recombining.
Another possible explanation for flat-topped light curves was developed in the case of T Pyx and pro-posed by Nelson et al. (2014) and Chomiuk et al. (2014b), where there is multi-wavelength evidence that the bulk
of the ejecta remained in a quasi-hydrostatic configura-tion around the binary until the end of the “flat top” period. In this nova, it appears that 1–2 months pass before the ejecta are accelerated to their terminal ve-locity and are expelled from the environs of the binary, although the physical origin of the delay remains a mys-tery (it is, perhaps, attributable to binary interaction with the quasi-static envelope).
It should be noted that, of the gamma-ray detected novae, at least two—V1369 Cen and V5668 Sgr—had similar flattening of the optical light curve near maxi-mum (Cheung et al. 2016), though both exhibited large (∆V > 1 Mag) fluctuations in brightness during their period of flattening (unlike V1324 Sco; Figure 2). In both systems, the evolution of optical spectral line pro-files around maximum imply that several episodes of mass ejection transpire over the course of the variegated plateau (Walter et al. 2012). These systems support the idea that flat-topped light curves in novae may be a sig-nature of complex, prolonged mass loss—the sort of mass loss which will produce shocks and gamma rays.
3. RADIO DATA
Radio emission from novae is a crucial tool in under-standing nova energetics, as the opacity at radio frequen-cies is directly proportional to the emission measure of the ionized ejecta—defined for some line of sight z as
EMz=R n2edz. Therefore, we can map out the density
profile of the ejecta just by watching the evolution of the radio emission (Seaquist & Palimaka 1977; Hjellming et al. 1979; Seaquist & Bode 2008; Roy et al. 2012). The early time radio light curve can also show unexpected be-havior that can be used to constrain shocks in the nova event (Taylor et al. 1987; Krauss et al. 2011; Chomiuk et al. 2014a; Weston et al. 2016a,b).
3.1. Observations and Reduction
We obtained sensitive radio observations of V1324 Sco between 2012 June 26 and 2014 December 19 with the Karl G. Jansky Very Large Array (VLA) through pro-grams S4322, 12A-483, 12B-375, 13A-461, 13B-057, and S61420. Over the course of the nova, the VLA was op-erated in all configurations, and data were obtained in the C (4–8 GHz), Ku (12–18 GHz), and Ka (26.5–40 GHz) bands, resulting in coverage from 4–37 GHz. Ob-servations were acquired with 2 GHz of bandwidth and 8-bit samplers, split between two independently tunable 1-GHz-wide basebands. The details of our observations are given in Table 2.
At the lower frequencies (C band), the source J1751-2524 was used as the complex gain calibrator, while J1744-3116 was used for gain calibration at the higher frequencies (Ku and Ka bands). The absolute flux den-sity scale and bandpass were calibrated during each run with either 3C48 or 3C286. Referenced pointing scans were used at Ku and Ka bands to ensure accurate point-ing; pointing solutions were obtained on both the flux calibrator and gain calibrator, and the pointing solution from the gain calibrator was subsequently applied to our observations of V1324 Sco. Fast switching was used for high-frequency calibration, with a cycle time of ∼2 min-utes. Data reduction was carried out using standard rou-tines in AIPS and CASA (Greisen 2003; McMullin et al.
2007). Each receiver band was edited and calibrated in-dependently. The calibrated data were split into their two basebands and imaged, thereby providing two fre-quency points.
An observation in A configuration (the most extended VLA configuration) from 2012 Dec 16 suffered severe phase decorrelation at higher frequencies. Despite ef-forts to self calibrate, we could not reliably recover the source and we therefore do not include these measure-ments here.
In each image, the flux density of V1324 Sco was mea-sured by fitting a Gaussian to the imaged source with the tasks JMFIT in AIPS and gaussfit in CASA. We record the integrated flux density of the Gaussian; in most cases, there was sufficient signal on V1324 Sco to allow the width of the Gaussian to vary slightly, but in cases of low signal-to-noise ratio, the width of the Gaus-sian was kept fixed at the dimensions of the synthesized beam. Errors were estimated by the Gaussian fitter, and added in quadrature with estimated calibration errors of 5% at lower frequencies (<10 GHz) and 10% at higher frequencies (>10 GHz). All resulting flux densities and uncertainties are presented in Table 2. V1324 Sco ap-peared as an unresolved point source in all observations. Next, we discuss the different phases of the radio light curve evolution. The radio emission is shown in Figure 3 (radio light curve) and Figure 4 (radio spectral energy distributions).
3.2. Initial Radio Maximum and Shock Emission
V1324 Sco was detected during the first radio observa-tion (day +25), coincident with the end of the gamma-ray emission. In subsequent radio observations the light curve rose steeply to a first maximum, peaking on day +72. This initial peak is in contrast with the second max-imum, which peaked around day +300 (see Figure 3).
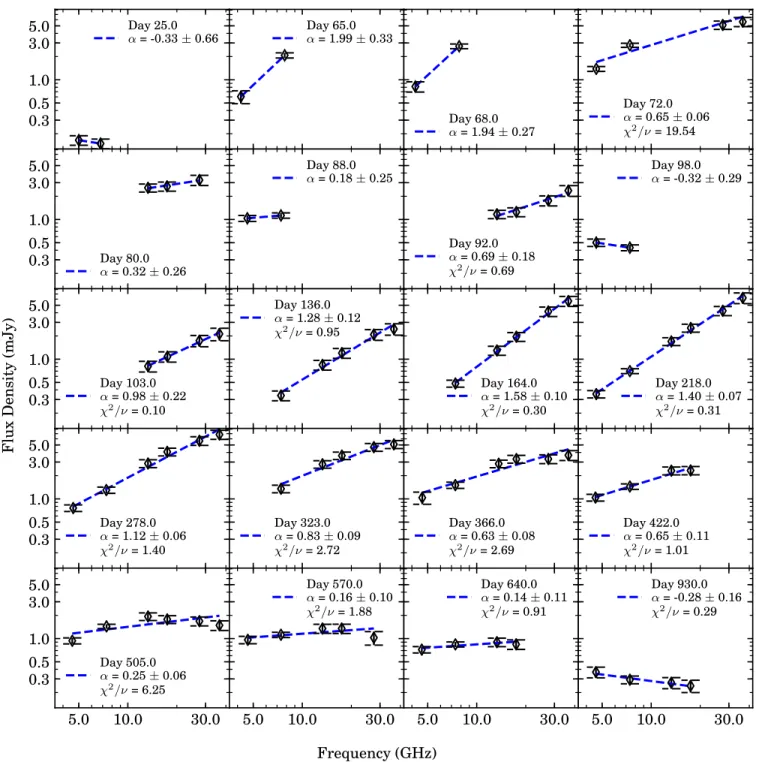
The radio spectrum on the rise to initial maximum started out consistent with flat (albeit with a large error bar): α = −0.3 ± 0.7 on day +25 (where α is defined as
fν∝ να, fνis the flux density, and ν is the observing
fre-quency; see Figure 4). The radio spectrum then rapidly transitioned to α = 2.0 ±0.3 on day +65 (the time of ini-tial maximum), implying optically thick emission. The spectrum then flattened out again (α = 0.6 ± 0.1 on day +72).
During this initial radio peak, the light curve rises
steeply, as fν ∝ t2.9, assuming day 0 is 2012 June
1. This is steeper than expected for expansion of an
optically-thick isothermal sphere (fν ∝ t2; Seaquist &
Bode 2008), and could indicate that this maximum is dominated by thermal emission increasing in tempera-ture or non-thermal emission.
To further investigate the nature of this initial radio maximum, we can use the brightness temperature, which is a proxy for surface brightness. Brightness temperature parameterizes the temperature that would be necessary if the observed flux originated from an optically-thick ther-mal blackbody. The equation for brightness temperature is given by
Tb(ν, t) =
Sν(t)c2D2
2πkbν2(vejt)2, (1)
30.0 50.0 100.0 300.0 500.0
Days Past 1 June 2012
0.30 0.50 1.00 3.00 5.00
F
lu
x
D
en
si
ty
(m
J
y
)
4.6 GHz 7.3 GHz 13.5 GHz 17.5 GHz 27.5 GHz 34.8 GHzFigure 3. Radio light curve for V1324 Sco, spanning day +22 to day +930 (using June 1 2012 as day 0). The initial maximum takes place between day +25 to day +136, while the second radio peak occurs around day +300 − 400. The time range of GeV gamma-ray detections is highlighted in grey.
the time since explosion, vej is the ejecta velocity, ν is
the observing frequency, and kb is the Boltzmann
con-stant. Typical brightness temperatures of thermal
emis-sion from novae are ∼ 104 K (Cunningham et al. 2015).
If the measured brightness temperature is far in excess of
∼ 104K, it is a solid indication of synchrotron emission.
Figure 5 shows estimates of the brightness tempera-ture as a function of time, using the distance lower limit of 6.5 kpc from Finzell et al. 2015 and a velocity of
1,000 km s−1 (the velocity of the slow flow as estimated
from optical spectroscopy; Section 4.3). Two observa-tion epochs (days 80 and 92) were removed due to the lack of low-frequency observations, which usually set the maximum brightness temperature. Note that a larger
distance would increase these values, while a larger vej
would decrease them. If we instead assume a velocity of
2,600 km s−1 (the velocity of the fast flow; Section 4.3),
the brightness temperature estimates will decrease by a factor, ∼7.
During the initial radio maximum, we see that the
brightness temperature substantially surpasses 104 K,
registering at 5 × 10⁵ K (assuming 1,000 km s−1
out-flow velocity, and still ∼ 105 K if we assume the faster
outflow). Such brightness temperatures are very diffi-cult to produce with thermal emission alone, and can be most easily explained as synchrotron emission (Taylor et al. 1987; Weston et al. 2016b).
This type of initial radio bump has been seen in several other nova, including QU Vul (Taylor et al. 1987), V1723 Aql (Krauss et al. 2011; Weston et al. 2016a), and V5589
Sgr (Weston et al. 2016b) and we are beginning to de-velop theories to explain such behavior. These previous works, along with theoretical analysis by Metzger et al. (2014) and Vlasov et al. (2016), postulate that the ini-tial radio maxima could be either synchrotron emission or (unusually hot) thermal free-free emission.
To explain the initial maximum as thermal emission, rather extraordinary conditions are needed. Both Taylor et al. (1987) and Metzger et al. (2014) invoke a strong shock as a means for generating hot, free-free emitting gas. Note that the gas would not only need to be hot
(> 105 K), but also dense, as it would need to be
opti-cally thick to produce the initial maximum. Such large amounts of high temperature gas would also produce significant X-ray emission, which was not observed in V1324 Sco. This could be explained if there is a high column density of material absorbing the X-ray emit-ting region (see Section 5). However, for low-velocity
(vsh . 1500 km s−1) shocks expanding into dense
me-dia, like internal shocks in novae, cooling is very efficient
and drives the post-shock gas temperature to T ∼ 104K
(Metzger et al. 2014; Derdzinski et al. 2016). This makes
it difficult to achieve the ∼ 105− 106K gas necessary for
the initial radio bump to be explained by thermal emis-sion.
A non-thermal explanation for the initial radio maxi-mum is preferred by Vlasov et al. (2016), as synchrotron emission is an elegant explanation for brightness
tem-peratures substantially in excess of 104 K. A peak in
0.3 0.5 1.0 3.0 5.0 Day 25.0 α = -0.33 ± 0.66 Day 65.0 α = 1.99 ± 0.33 Day 68.0 α = 1.94 ± 0.27 Day 72.0 α = 0.65 ± 0.06 χ2/ν = 19.54 0.3 0.5 1.0 3.0 5.0 Day 80.0 α = 0.32 ± 0.26 Day 88.0 α = 0.18 ± 0.25 Day 92.0 α = 0.69 ± 0.18 χ2/ν = 0.69 Day 98.0 α = -0.32 ± 0.29 0.3 0.5 1.0 3.0 5.0 Day 103.0 α = 0.98 ± 0.22 χ2/ν = 0.10 Day 136.0 α = 1.28 ± 0.12 χ2/ν = 0.95 Day 164.0 α = 1.58 ± 0.10 χ2/ν = 0.30 Day 218.0 α = 1.40 ± 0.07 χ2/ν = 0.31 0.3 0.5 1.0 3.0 5.0 Day 278.0 α = 1.12 ± 0.06 χ2/ν = 1.40 Day 323.0 α = 0.83 ± 0.09 χ2/ν = 2.72 Day 366.0 α = 0.63 ± 0.08 χ2/ν = 2.69 Day 422.0 α = 0.65 ± 0.11 χ2/ν = 1.01 5.0 10.0 30.0 0.3 0.5 1.0 3.0 5.0 Day 505.0 α = 0.25 ± 0.06 χ2/ν = 6.25 5.0 10.0 30.0 Day 570.0 α = 0.16 ± 0.10 χ2/ν = 1.88 5.0 10.0 30.0 Day 640.0 α = 0.14 ± 0.11 χ2/ν = 0.91 5.0 10.0 30.0 Day 930.0 α = -0.28 ± 0.16 χ2/ν = 0.29 F lu x D en si ty (m J y ) Frequency (GHz)
Figure 4. The evolution of the radio spectral energy distribution for V1324 Sco. At every epoch with measurements at three or more frequencies we fit either a power-law or double power-law to the flux values. The best fit solution was selected based on reduced chi-squared value closest to 1.
emission suffering free-free absorption (or perhaps via the Razin-Tsytovich effect; see also Taylor et al. 1987). In this scenario, on the rise to maximum, the spectral in-dex is predicted to be α = 2, the light curve peaks when optical depth is of order unity, and during the optically-thin decline from maximum, the spectral index would be α = −0.5 to −1.0 (Vlasov et al. 2016). While such evo-lution of the spectral index is widely seen in supernovae (e.g., Chevalier 1982; Weiler et al. 2002), the spectral in-dex evolution during V1324 Sco’s first radio maximum looks quite different. The spectral index never drops be-low α ≈ 0.2 (day +88; Figure 4). See the top panel of
Figure 14 in Vlasov et al. (2016) for an illustration of how free-free absorbed synchrotron emission provides a problematic fit to the radio spectral energy distribution during the decline from V1324 Sco’s initial radio maxi-mum.
Similar radio spectral index evolution, combined with high brightness temperatures, have now been seen in sev-eral other novae, and a synchrotron explanation is fa-vored over a thermal one (Taylor et al. 1987; Krauss et al. 2011; Weston et al. 2016b; Vlasov et al. 2016). However, the physical explanation for a relatively flat (non-negative) spectral index on the decline from initial
30.0 50.0 100.0 200.0 300.0 500.0 Days Past 1 June 2012
3.0E+03 5.0E+03 1.0E+04 3.0E+04 5.0E+04 1.0E+05 3.0E+05 5.0E+05 B ri g h tn es s T em p er a tu re (K )
Figure 5. The early time radio bump (day 30 to 50) has maxi-mum brightness temperatures far exceeding that of the canonical 104K thermally emitting ejecta—which can be seen as the dashed black line. The first radio observation, on day +25, occurred while the source was still gamma-ray bright. Note that the observation epochs taken on days 88 and 92 were omitted due to a lack of low-frequency observations.
maximum, when the emission is expected to be optically thin, remains a mystery. Perhaps yet-unexplored physics is affecting the energy spectrum of non-thermal leptons in novae, making the spectrum flatter than predicted by models of diffusive shock acceleration (Bell 1978; Bland-ford & Ostriker 1978). Regardless of a thermal or syn-chrotron origin, the initial radio maximum in V1324 Sco is a clear indication of shocks in the months following outburst.
3.3. Second Radio Maximum and Determination of
Ejecta Mass
After this initial radio bump, a second radio maximum occurred, starting sometime around September 15 2012 (day +106). It first appeared at high frequencies and progressed toward lower frequencies. During this second radio maximum, V1324 Sco peaked at 6.8 mJy at high frequency (36 GHz) on day +278, and peaked at ∼ 1.0 mJy for low frequency (4.5 GHz) on day +422.
The evolution of the second radio maximum is con-sistent with the “standard” picture of radio emission in
novae—namely thermal emission from the 104K
expand-ing ejecta (Seaquist & Palimaka 1977; Hjellmexpand-ing et al. 1979). This portion of V1324 Sco’s radio light curve is similar to the other novae that have been studied in the radio (e.g., Seaquist & Palimaka 1977; Hjellming et al. 1979; Chomiuk et al. 2012a; Nelson et al. 2014; Weston et al. 2016a).
The spectral index is steep on the rise to second max-imum, reaching α = 1.6 on day +164 (once there has been time for the initial radio bump to fade away). By day +323, there is clear evidence that the radio spectrum is flattening at higher frequencies (Figure 4). This spec-tral turnover cascades to lower frequencies, until by day +640, the radio spectrum is consistent with optically-thin free free emission (α = −0.1). This spectral in-dex evolution is consistent with expectations for free-free emission from expanding thermal ejecta (Seaquist & Bode 2008).
The power-law rise to second maximum is also consis-tent with expectations for an isothermal sphere
expand-ing at constant velocity (fν∝ t2; Seaquist & Bode 2008).
The rise to second maximum at 7.5 GHz is well approx-imated by a power law with index 2 (assuming that day 0 is 2012 June 1). The rise to second maximum at 17.5 GHz is a bit shallower (power law index of 1.7), and this difference is likely attributable to the more substantial effect of the first radio maximum on the light curve be-tween days +100–200 (Figure 3).
We therefore modeled the second radio bump as ther-mal emission from the expanding nova ejecta. We fit the radio data observed after day +106 using the stan-dard model of Hjellming et al. (1979). Specifically, we utilize a homologously expanding “Hubble flow” model, where the fastest ejecta are found at largest radii and throughout the ejecta, v ∝ r. The ejecta are bounded at an inner and outer radius, and we refer to the ratio be-tween these as ξ. In bebe-tween these inner and outer radii,
we estimate an r−2 density profile (for more details on
this model, see Seaquist & Palimaka 1977). The other physical quantities that go into the Hubble flow model are ejecta mass, maximum ejecta velocity, filling factor, temperature, and distance. More details on this radio light curve model and interplay between these variables can be found in Appendix A.
Figure 6 shows the fit to the second peak in the radio light curve using this model. The reduced chi-squared
value fit for this model is χ2/ν = 3.36. The fitting
scheme was error weighted, which partially explains why the highest and lowest frequencies are not fit as well. Further, by construction the model has a spectral index of α = 2.0 during the rise, as this is the spectral index of optically thick thermal emission in the Rayleigh-Jeans tail. As can be seen in Figure 4, we never observe a spectral index this high; during the rise to second opti-cal maximum, we observe α = 1.0 − 1.6. This discrep-ancy between observed and predicted spectral index is common among novae (Roy et al. 2012; Chomiuk et al. 2014a; Nelson et al. 2014; Wendeln et al. 2017), and cur-rently lacks a suitable explanation. Clearly, V1324 Sco is another data point illustrating that this discrepancy requires more attention.
Despite discrepancies in the spectral index on the rise, the flux density and timescale of the second peak reveal important information on the mass and energetics of the explosion. We can derive physical parameters for the
ejecta—ejected mass (Mej) and total ejecta kinetic
en-ergy (KEej), as well as the distance—from the model fit,
with some assumptions. We assume the canonical
tem-perature of photoionized gas—104 K (Osterbrock 1989;
Cunningham et al. 2015). This ejecta temperature is not only theoretically predicted, but has been observed in resolved radio images of novae (e.g., Taylor et al. 1988; Hjellming 1996). We also take the maximum ejecta
ve-locity to be 2600 ± 260 km s−1(see Section 4.2), and a
volume filling factor of fV = (2.1 ± 0.7) × 10−2 (see
Ap-pendix B).
The physical quantities derived from the light curve fit are:
D = 14.8 ± 1.6 kpc; (2)
Mej= (1.8 ± 0.6) × 10−5 M⊙; (3)
KEej= (3.8 ± 2.0) × 1045 ergs. (4)
Uncer-200.0 300.0 500.0
t (Days Post-Outburst)
0.100 0.300 0.500 1.000 3.000 5.000F
lu
x
(m
jy
)
4 Ghz 7 Ghz 13 Ghz 17 Ghz 27 Ghz 36 GhzFigure 6. Best fit model to just the second bump portion of the radio light curve (see Figure 3 for the entirety of the radio light curve). The best fit parameter values and the resultant physical values can be found in Section 3.3. The reduced chi-squared value fit for this model is χ2
red= 3.36. The fitting scheme was error weighted, which (partially) explains the relatively poor fits to the highest and lowest frequencies. There is the further issue of the fact that none of the data have the canonical optically thick spectral index of α = 2.0, which the model expects (see Figure 4).
tainty in filling factor have been propagated through this estimate and are included in the error bars. For both the derived distance and the total kinetic energy,
the dominant source of uncertainty comes from vmax;
KEejhas a very strong dependence on the maximum
ve-locity (KEej ∝ v4max). The uncertainty in the derived
mass is dominated by the uncertainty in the filling
fac-tor measurement (although uncertainty in vmax is still
non-negligible).
Let us now consider how these derived values depend on our assumptions. In equation A2, we see that for a
fixed Te and vmax, Mej/√fV is also fixed. The filling
factor can therefore be understood as a factor that only affects the derived ejecta mass, and has no other effect on the radio light curve. If the filling factor were to decrease by an order of magnitude, it would decrease the derived ejecta mass by a factor of ∼3.
We now consider how ejecta mass depends on distance.
Equation A1 implies that at least one of D, vmax, and Te
needs to be left free to vary in order to provide a suitable
fit to a light curve. If we fix D and instead let vmaxvary,
we find
vmax= DΨ1/2Te−1/2. (5)
(see Appendix A for a discussion of Ψ). We can fix D at the minimum possible distance, D = 6.5 kpc (Finzell
et al. 2015), and maintain Te= 104 K; then the implied
maximum ejecta velocity is 1150 km s−1(consistent with
the velocity of the P Cygni absorption trough in early spectra; Figure 7). The lack of observed velocities >2600
km s−1implies that V1324 Sco is not located further than
15 kpc away, unless its thermal ionized ejecta are
some-how substantially cooler than 104 K (which we consider
very unlikely; e.g., Cunningham et al. 2015). A velocity
of 1145 km s−1in turn implies an ejecta mass almost an
order of magnitude lower, 2.3 × 10⁻⁶ M
⊙.
It should be noted that, during the dust event, we expect some fraction of the nova ejecta to cool, recom-bine, and become neutral. Since neutral particles won’t emit free-free emission—or, at least for atoms with sig-nificant dipole moments, they will emit sigsig-nificantly less free-free emission than ionized particles—we don’t expect this mass to show up in the radio emission. However, the bulk of the second radio maximum occurs after the dust event, when the ionization of the gas should be increas-ing from a minimum around day +70 and approachincreas-ing a
photoionized equilibrium with temperature, 104K
(Cun-ningham et al. 2015).
Despite uncertainties, radio light curves remain one of the most robust ways to estimate the ejecta masses of classical novae (Seaquist & Bode 2008). We conclude that, given measured ejecta velocities in excess of 2000
km s−1 and the lower limit on the distance, our
mea-surements imply an ejecta mass for V1324 Sco of a few
×10−5 M
Table 2
VLA Observations of V1324 Sco
Julian Date 4.5 GHz Fluxa, b 7.8 GHz Flux 13.3 GHz Flux 17.4 GHz Flux 27.5 GHz Flux 36.5 GHz Flux
t − t0 Config.
(245000+) (UT) (mJy) (mJy) (mJy) (mJy) (mJy) (mJy)
6104.3 6/26/2012 25.0 B 0.165 ± 0.023 0.149 ± 0.021 – – – – 6106.1 6/28/2012 27.0 B – – – – – <0.822 6144.1 8/5/2012 65.0 B 0.605 ± 0.115 2.074 ± 0.160 – – – – 6147.1 8/8/2012 68.0 B 0.817 ± 0.124 2.720 ± 0.191 – – – – 6151.2 8/12/2012 72.0 B 1.385 ± 0.100 2.803 ± 0.171 – – 5.133 ± 0.636 5.647 ± 0.766 6159.2 8/20/2012 80.0 B – – 2.574 ± 0.307 2.690 ± 0.364 3.246 ± 0.489 2.639 ± 0.533 6167.0 8/28/2012 88.0 B 1.036 ± 0.092 1.128 ± 0.089 – – – – 6171.1 9/1/2012 92.0 B – – 1.169 ± 0.144 1.250 ± 0.165 1.760 ± 0.261 2.370 ± 0.377 6177.9 9/7/2012 98.0 BnA 0.502 ± 0.055 0.431 ± 0.038 – – – – 6182.1 9/12/2012 103.0 BnA – – 0.810 ± 0.128 1.080 ± 0.165 1.738 ± 0.290 2.126 ± 0.392 6215.0 10/15/2012 136.0 A <0.218 0.338 ± 0.049 0.843 ± 0.121 1.201 ± 0.174 2.085 ± 0.332 2.460 ± 0.415 6243.8 11/12/2012 164.0 A 0.228 ± 0.055 0.484 ± 0.050 1.297 ± 0.174 1.955 ± 0.256 4.153 ± 0.582 5.667 ± 0.838 6297.6 1/5/2013 218.0 A 0.353 ± 0.039 0.701 ± 0.051 1.699 ± 0.198 2.539 ± 0.301 4.240 ± 0.574 6.230 ± 0.983 6357.5 3/6/2013 278.0 D 0.761 ± 0.075 1.300 ± 0.121 2.877 ± 0.337 4.071 ± 0.469 5.660 ± 0.725 6.821 ± 0.917 6402.3 4/20/2013 323.0 D 0.963 ± 0.216 1.352 ± 0.153 2.810 ± 0.313 3.637 ± 0.403 4.677 ± 0.543 5.089 ± 0.605 6445.4 6/2/2013 366.0 DnC 1.037 ± 0.186 1.507 ± 0.139 2.855 ± 0.322 3.283 ± 0.379 3.290 ± 0.429 3.680 ± 0.538 6501.3 7/28/2013 422.0 C 1.041 ± 0.105 1.446 ± 0.118 2.318 ± 0.270 2.337 ± 0.286 3.017 ± 0.659 3.160 ± 0.811 6584.0 10/19/2013 505.0 B 0.937 ± 0.084 1.440 ± 0.093 1.933 ± 0.218 1.773 ± 0.206 1.682 ± 0.222 1.486 ± 0.213 6649.7 12/23/2013 570.0 B 0.963 ± 0.106 1.120 ± 0.087 1.350 ± 0.182 1.350 ± 0.186 1.027 ± 0.205 1.098 ± 0.304 6719.5 3/3/2014 640.0 A 0.719 ± 0.068 0.841 ± 0.064 0.899 ± 0.114 0.843 ± 0.119 0.696 ± 0.143 0.529 ± 0.132 7009.8 12/18/2014 930.0 C 0.368 ± 0.058 0.293 ± 0.034 0.268 ± 0.044 0.244 ± 0.044 <0.282 <0.365
Note. — Taking t0to be 2012 June 1
a Detections are defined as flux > 5σ. Non-detections are given as the 5σ upper limits.
−3000 −2000 −1000 0 1000 2000 3000 Velocity (km/s) A rb it ra ry F lu x +3 Days +7 Days +13 Days +17 Days +19 Days +21 Days +23 Days +24 Days +35 Days +43 Days +45 Days +353 Days
Figure 7. Evolution of the Hα line as a function of time. We take day 0 to be June 1 2012. All velocities have been corrected to the heliocentric frame. The blue dashed line indicates v = 0 km s−1, while the red dashed lines—used to help guide the eye—give v = ±1500 km s−1. The y−axis is arbitrary flux; these relative flux values are not to scale. Note the expansion of the velocity profile starting sometime between day +7 and +13, and continuing until day ∼ +35.
4. OPTICAL SPECTRA
Optical spectroscopy of novae are very rich and com-plex, but our primary goal for V1324 Sco is to understand the kinematics and energetics of the ejecta. Therefore, in this section we particularly focus on the gas kinematics and filling factor of the gas (which are crucial for esti-mating the ejecta mass from radio light curves; Section 3.3).
4.1. Observations and Reduction
All spectroscopic observations—including date, tele-scope, and observer—are listed in Table 3. Spectra are shown in Figures 8, 9, and 10. Note that all plots have been corrected to put spectra into the heliocentric frame.
The details of the data reduction for the UVES and MIKE data can be found in Finzell et al. (2015) and Wal-ter et al. (2012) for the RC Spectrograph data. The SOAR Goodman data were taken using a 400 l/mm
grat-ing centered at 5000 ˚A, and were reduced using the
stan-dard procedure in IRAF 35 with optimal extraction and
wavelength calibration using FeAr arcs.
An optical spectrum was obtained on 2013 May 20.4 UT (day 353) using the 8.4 m Large Binocular Tele-scope (LBT) and Multi–Object Double Spectrograph (MODS1). Observing conditions were photometric but the seeing as measured from two independent sources
ranged from 1.8−1.9′′ at the start of the observation.
MODS1 utilized a 0.′′8 entrance slit (so there was some
loss of light at the entrance slit) and G400L (blue
chan-nel; 3200–5800 ˚A) and G670L (red channel; 5800–10000
˚
A) gratings giving a final dispersion of 0.′′5 per pixel.
The combined spectrum covers the range 3420–10000 ˚A
at a spectral resolution of 3.5 ˚A. The spectra of quartz–
halogen and HgNeArXe lamps enabled the removal of pixel–to–pixel and other flatfield variations in response and provided wavelength calibration respectively. Spec-tra of the spectrophotometric standard star BD+33 2642 were obtained to measure the instrumental response function and provide flux calibration of the V1324 Sco spectra. The spectra were reduced using a set of custom routines to remove the bias from the detectors and pro-vide flatfield correction and then using IRAF for spectral extraction and wavelength and flux calibration.
In the case of the spectra taken by C. Buil and T. Bohlsen, both observers used a LISA spectrograph at-tached to commercially available telescopes of different sizes (0.28 meter Celestron for Buil; 0.22 meter Vixen VC200L for Bohlsen). More information about their
ob-servations can be found on their websites36,37.
4.2. Spectroscopic Evolution
As seen in Figure 7, there were strong P-Cygni absorp-tion profiles starting at least as early as day +3. The
Hα emission component peaked at ∼ −180 km s−1 on
day +3, and had a FWHM of ∼ 800 km s−1. The
en-tirety of Hα, including both the emission feature and the
P-Cygni absorption, extended out to −1100 km s−1 in
the blue, or 900 km s−1 from the line center. We take
the P-Cygni absorption profile to be coming from the fastest material, meaning that—at this early time—the
maximum expansion velocity was ∼ 900 km s−1. The
second most prominent features in the early spectra—
aside from the Hydrogen lines—are the FeIIlines, all of
which showed P-Cygni profiles. This is evident in Fig-ures 8 and 9, which show the time evolution of the blue
(3850−4950 ˚A) and red (5700−6400 ˚A) spectral regions,
respectively.
The spectrum obtained on day +13 shows the Hα line profile clearly broadening (Figure 7). Note that this is also the time when the light curve flattens out, and stays 35IRAF is distributed by the National Optical Astronomy Ob-servatories, which are operated by the Association of Universities for Research in Astronomy, Inc., under cooperative agreement with the National Science Foundation. See Tody (1993).
36http://www.astrosurf.com/buil/index.htm 37http://users.northnet.com.au/~bohlsen/Nova/
4000 4200 4400 4600 4800
Wavelength (Angstroms)
0.0 0.5 1.0 1.5 2.0 2.5 3.0 3.5A
rb
it
ra
ry
F
lu
x
H β H γ U n id en ti fi ed F e II F e II F e II F e II F e II Fe II F e II F e II H ǫ C a II C a II S i II +3 Days +19 Days +23 Days +31 Days +35 Days +45 DaysFigure 8. Evolution of the blue (3850 − 4950 ˚A) spectral region. All wavelengths have been corrected to the heliocentric frame. None of these spectra have been corrected for telluric features. See Table 3 for details on the telescopes and instruments used for the different spectra. Note that GeV gamma-rays were observed during the second, third, and fourth spectra (days +14 − 31; Ackermann et al. 2014).
at roughly constant brightness for the next month (Sec-tion 2.2). Between days +13–35, we see emission wings
of the Hα line expand to ±2600 km s−1 from the line
center. We also see the P Cygni absorption trough move blueward during this time. We discuss the physical im-plications of this line broadening further in Section 4.3.
Just a few days after the Magellan MIKE spectrum (day +45), V1324 Sco underwent a massive dust dip last-ing for ∼ 50 days. Although the light curve did eventu-ally rebound out of the dust dip, there was only a brief window of . 25 days before V1324 Sco went into so-lar conjunction. As a result our spectroscopic coverage did not pick back up until 20 May 2013—355 days after outburst—well into the nebular phase. As seen in Fig-ure 12 the strongest lines in the nebular phase are the
[O III] lines at 5007 and 4959 ˚A, followed by Hα and
[FeVII] at 6084 ˚A.
4.3. Discussion of Optical Spectra
V1324 Sco is a FeII type nova (Williams et al. 1991),
due to the prominence of the Fe II spectral features—
second only to the Balmer features—during optical
max-imum. The Fe II type classification is common among
D type novae, including FH Ser, NQ Vul, and QV Vul
(see Strope et al. 2010 and references within). It is also notable that all Fermi -detected novae to date have been
of the Fe II type—see V1369 Cen (Izzo et al. 2013),
V5668 Sgr (Williams et al. 2015), V339 Del (Tajitsu et
al. 2015), and V5856 Sgr (Luckas 2016; Rudy et al. 2016). Looking at Figure 7, it is clear that the Balmer line pro-file changes as a function of time. This type of line propro-file evolution is common amongst novae (Payne-Gaposchkin 1957; McLaughlin 1960; for some recent examples see e.g., Surina et al. 2014; Skopal et al. 2014; Shore et al. 2016). The spectroscopic velocities for Hα and Hβ are plotted in Figure 11, along with the photometric light curve for comparison purposes. Velocities quoted are half-width at half-maximum (HWHM) measured for Hα and Hβ. Because a number of the spectra taken by
Wal-ter et al. were either blue (3650–5420 ˚A) or red (5620–
6940 ˚A), we chose to use both of these features to
maxi-mize the number of velocity measurements. The HWHM was measured by fitting a Gaussian profile to the emis-sion lines using the IRAF routine splot. Uncertainties in HWHM were found by adding in quadrature both the uncertainty in the line measurement—found by measur-ing the line multiple times in splot—and the (average) dispersion of the spectrum.
In V1324 Sco, the width of the Balmer lines increases around the time that gamma rays are first detected (day +14). The HWHM velocity then varies, but stays at a
large value (.1500 km s−1) over the time period when
gamma rays are observed (until day +31, shown as top panel in Figure 11). Another spike is seen in the velocity evolution around day +40, and then the velocity appears to decline as the nova transitions to its nebular phase.
5700 5800 5900 6000 6100 6200 6300 6400
Wavelength (Angstroms)
0 1 2 3 4 5A
rb
it
ra
ry
F
lu
x
F e II Fe II F e II N a D S i II S i II S i II S i II [O I] [O I] [O I] +3 Days +19 Days +21 Days +35 Days +35 Days +43 Days +45 DaysFigure 9. Evolution of the red (5700 − 6400 ˚A) spectral region. All wavelengths have been corrected to the heliocentric frame. None of these spectra have been corrected for telluric features. The UVES spectrum taken on day +3 has contamination from telluric absorption lines between 6280 ˚A and 6320 ˚A . See Table 3 for details on the telescopes and instruments used for the different spectra. Note that GeV gamma-rays were observed during the second and third spectra (days +14 − 31; Ackermann et al. 2014).
The profile evolution of the Balmer lines implies that there is relatively slow-moving material in the outer parts of the ejecta, surrounding faster internal material. This conclusion is common in studies of classical novae, and is by no means peculiar to V1324 Sco (e.g., McLaughlin 1960; Friedjung 1966; O’Brien et al. 1994). In V1324 Sco, P Cygni profiles apparent in early spectra imply that the outer, slow component is expelled at ∼1,000 km
s−1 (day +3 in Figure 11). Over the next couple weeks,
a faster component of ejecta becomes visible, reaching
velocities of ∼2,600 km s−1. The delayed appearance
of this fast component implies that it must be internal to the slow component (possibly because it is launched later, or over a longer period of time). Inevitably, the internal fast component will catch up with the external slow component, producing shocks (and gamma rays; see Section 6.2). Therefore, from the line profile evolution of V1324 Sco, we estimate that the differential velocity in
the shock is ∼1,600 km s−1.
It is unclear if the temporal correspondence between the broadening of the optical emission lines and the ap-pearance of gamma rays is meaningful or coincidental. The optical emission lines of novae typically broaden in the weeks following optical maximum, as they transition from the principal line profile to show diffuse-enhanced line systems (McLaughlin 1960). It is possible that the fast, internal component is present in the nova practically
since the start of outburst, but only becomes visible as the outer parts of the ejecta expand and drop in optical depth. However, the temporal coincidence between op-tical line broadening and gamma-ray turn-on is striking, and could hint that the fast component is not launched until ∼13 days into the outburst. Similar evolution can be seen in the Hα profile of another gamma ray nova, V339 Del. Figure 4 of Skopal et al. (2014) show that the wings of the Hα profile began to increase on 2013 August 18 (date of the first gamma-ray detection).
We can also use the spectroscopic observations to de-termine properties of the ejecta density in V1324 Sco. Specifically, we use the late-time (nebular) spectroscopy to measure density inhomogeneities (i.e., clumpiness) in the ejecta, which we parameterize in terms of the
vol-ume filling factor (fV). Such inhomogeneities must be
taken into account in order to get a proper mass esti-mate, and we incorporate the filling factor in our radio ejecta mass derivation in Section 3.3. For detailed cal-culations of V1324 Sco’s filling factor, see Appendix B.
We use measurements of the [OIII] lines to find a filling
factor of fV = (2.1 ± 0.7) × 10−2 . This is similar to the
filling factor measured in the gamma-ray detected nova
V339 Del (fV = 0.07 − 0.2; Shore et al. 2016).
We also use the O I lines measured on day +45—
permitted transitions at 7774 ˚A and 8446 ˚A, and the