HAL Id: hal-02923681
https://hal.archives-ouvertes.fr/hal-02923681
Submitted on 8 Oct 2020
HAL is a multi-disciplinary open access
archive for the deposit and dissemination of
sci-entific research documents, whether they are
pub-lished or not. The documents may come from
teaching and research institutions in France or
abroad, or from public or private research centers.
L’archive ouverte pluridisciplinaire HAL, est
destinée au dépôt et à la diffusion de documents
scientifiques de niveau recherche, publiés ou non,
émanant des établissements d’enseignement et de
recherche français ou étrangers, des laboratoires
publics ou privés.
from laboratory evaluation of the fatigue life to
accelerated full-scale test
Mai Lan Nguyen, Cyrille Chazallon, Medhi Sahli, Georg Koval, Pierre
Hornych, Daniel Doligez, Armelle Chabot, Yves Le Gal, Laurent Brissaud,
Eric Godard
To cite this version:
Mai Lan Nguyen, Cyrille Chazallon, Medhi Sahli, Georg Koval, Pierre Hornych, et al.. Design of
reinforced pavements with glass fiber grids: from laboratory evaluation of the fatigue life to accelerated
full-scale test. 6th APT Conference, Université Gustave Eiffel, Sep 2021, Nantes, France. pp.329-338
in Lecture Notes in Civil Engineering (LNCE), 2020, �10.1007/978-3-030-55236-7_34�. �hal-02923681�
This is a pre-print of a contribution published in Accelerated Pavement Testing to Transport Infrastructure Innovation - Proceedings of the 6th APT Conference. In: Chabot A., Hornych P., Harvey J., Loria-Salazar L. (eds) Accelerated Pavement Testing to
Transport Infrastructure Innovation, Lecture Notes for Civil Engineering, vol. 96: 389-398.
Springer, Cham.
The final authenticated version is available online at: https://doi.org/10.1007/978-3-030-55236-7_34
Design of reinforced pavements with glass fiber
grids: from laboratory evaluation of the fatigue
life to accelerated full-scale test
Mai Lan Nguyen1, Cyrille Chazallon2, Mehdi Sahli2,3, Georg Koval2, Pierre Hornych1, Daniel Doligez4, Armelle Chabot1, Yves Le Gal5, Laurent Brissaud5, Eric Godard5.
(1) IFSTTAR, Bouguenais, France
(2) ICUBE, UMR 7357, CNRS, INSA Strasbourg, Université de Strasbourg, France (3) Epsilon, France
(4) 6D Solutions, France (5) COLAS SA, France
Abstract In this paper we present the results of the national French project
SolDuGri dealing with pavement reinforcement by glass fiber grids. In this pro-ject, an accelerated pavements test (APT) was performed on 6 pavement sections to evaluate the in situ performance of the reinforcement on their lifetime. The tests consisted in building test sections with four different types of grids, and two different compacted asphalt concrete layers above (hot mix asphalt and warm mix asphalt). A total number of 2.2 million of 65 kN dual wheel loads was applied on these pavement sections and their performance was evaluated using in situ instru-mentation, pavement monitoring tests and laboratory tests on recovered speci-mens. In parallel and in addition to static debonding tests, four points bending (4PB) fatigue tests were carried out in the laboratory on reinforced and non-reinforced beams. Two reference glass fiber grids were used, one with a high ten-sile strength of 100 kN/m and one with a lower tenten-sile strength of 50 kN/m. La-boratory fatigue tests were performed with 2 positions of the reinforcement in the beams to evaluate the effect of reinforcement for any position of the grid in the beam. Based on the results of the 4PB fatigue tests, a methodology is proposed to evaluate the lifetime of the full-scale test sections, and the predictions are com-pared with the results of the APT experiment showing good agreement.
1 Introduction
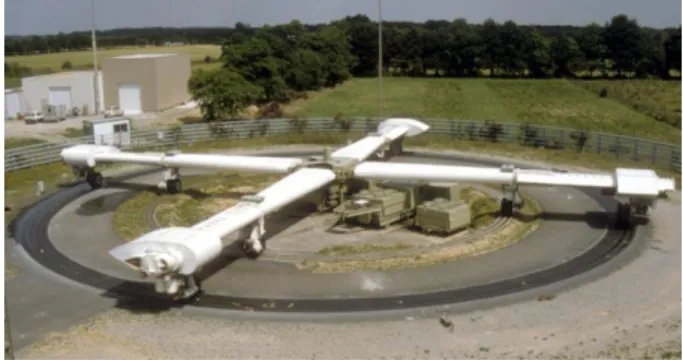
In the framework of the SolDuGri project, an accelerated pavements test (APT) was conducted on the pavement fatigue carrousel of IFSTTAR in Nantes (Figure 1). Its objective was to evaluate and compare the in situ performance and the life-time of different pavement sections with and without reinforcement using glass fi-ber grid.
In parallel, four points bending (4PB) fatigue tests were carried out in the la-boratory on reinforced and non-reinforced beams. Two positions of the reinforce-ment in the beams were tested to evaluate the effect of reinforcereinforce-ment in function of the position of the grid in the beam. Based on the results of the 4PB fatigue tests, a methodology is proposed to evaluate the lifetime of the full-scale test sec-tions, and the predictions are compared with the results of the APT experiment.
This paper presents the main features and results of the laboratory evaluation of fatigue life and of the APT experiment.
Fig 1. View of the accelerated pavement testing facility at IFSTTAR.
2 Laboratory Evaluation of Fatigue Life
After the first 4PB experimental program presented in (Arsenie et al. 2017), a second one was carried out in the SolDuGri project (Godard et al. 2019, Chazallon et al. 2020). Based on the principle of the standard fatigue test (EN 12697-24, 2012), four and six specimens were tested for each of the three strain levels for grid reinforced asphalt (GRA) and unreinforced asphalt (URA) samples respec-tively.
2.1 4PB Device and Sample Preparation
The 4PB device (figure 2a) used in this work was designed in order to test asphalt concrete beams (630x100x100 mm3) reinforced with glass fibre grids, following the European fatigue standard. Unreinforced asphalt (URA) and geogrid
rein-3
forced asphalt (GRA) samples, made with the same materials as the ones tested in full-scale experiment, were made in the laboratory. Two geogrids were symmetri-cally positioned at h = 25 mm (respectively h = 15 mm) and h = 75 mm (respec-tively 85 mm) of the beam height (figure 2b) in order to test the influence of the position of the grid.
(a) (b)
Fig. 2 Four point bending test: a) Test device, b) Three-layered asphalt specimen, reinforced with
two geogrids at 25 mm and 75 mm from the bottom surface
2.2 4PB Fatigue Test Results
In the French pavement design approach, the fatigue life of bituminous materials is defined by the fatigue law of Eq.1
(1)
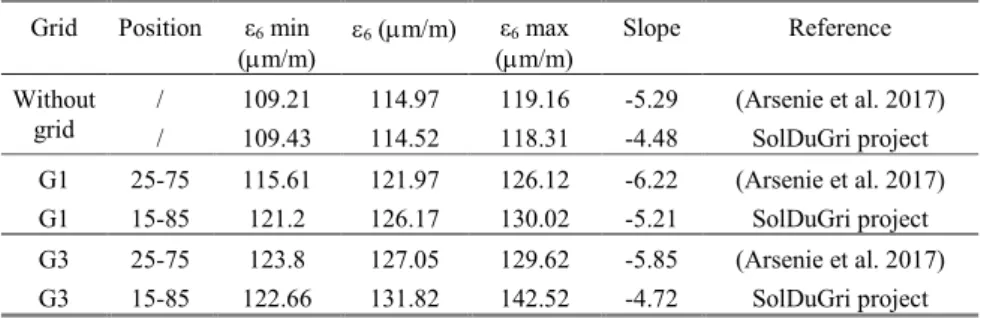
Where N is the number of load cycles, ε6 is the strain level leading to failure for 1 million load cycles and b the exponent of the fatigue law. The values of parame-ters 6 and b obtained for all test configurations are listed in Table 1, with a confi-dent interval of 95%. Results obtained for URA samples are very close between the first experimental program and the SolDuGri project.
Table 1 Synthesis of fatigue resistance obtained from 4PB tests
Grid Position ε6 min
(m/m) 6 (m/m) ε6 max (m/m) Slope Reference Without grid / 109.21 114.97 119.16 -5.29 (Arsenie et al. 2017) / 109.43 114.52 118.31 -4.48 SolDuGri project G1 25-75 115.61 121.97 126.12 -6.22 (Arsenie et al. 2017) G1 15-85 121.2 126.17 130.02 -5.21 SolDuGri project G3 25-75 123.8 127.05 129.62 -5.85 (Arsenie et al. 2017) G3 15-85 122.66 131.82 142.52 -4.72 SolDuGri project
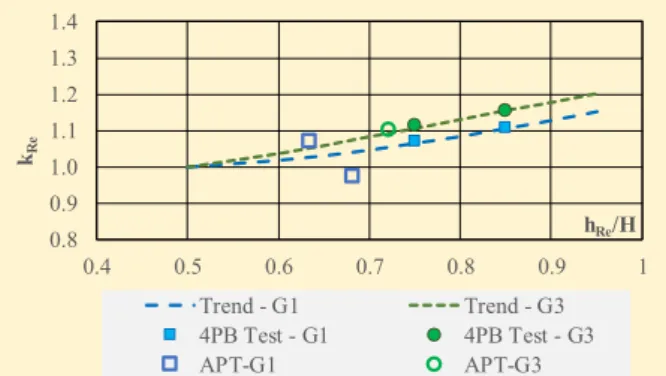
This similarity of the results allowed to use the results from both programs to determine a reinforcement coefficient kRe, which is defined as ratio between the fatigue life of GRA and URA samples. Then, the value of kRe was related with the grid position in the samples, by means of the ratio between the reinforced layer thickness and the total thickness of the asphalt layers. The experimental values of kRe for grids G1 and G3 are plotted in Figure 3, together with trend curves.
Fig. 3 Relationship between reinforcement coefficient and asphalt thickness ratio
3 Full-Scale Accelerated Test
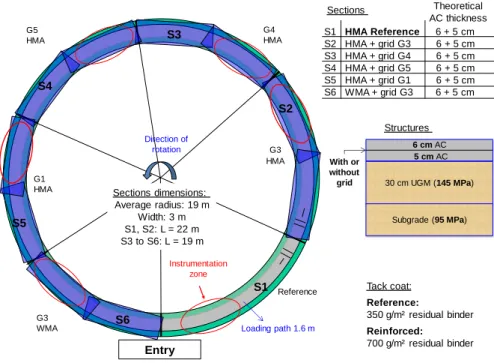
Six different pavement sections were tested simultaneously on the circular fa-tigue carrousel (Figure 4). The APT is first described before giving its main re-sults.
3.1 Description of the APT experiment
The test sections include one reference unreinforced structure constructed with a hot mix asphalt (HMA), four other structures constructed with the same HMA re-inforced with four different grids and one last structure constructed with a warm mix asphalt (WMA) reinforced with the same grid used in the second structure. These sections were placed at the same radius of 19 m on the circular test track and are between 19 m (S3 to S6) and 22 m long (S1 and S2). Each section is di-vided into two half-sections, one with and the other without instrumentation. Each half section has only one straight grid, which covers the wheel path on this sec-tion.
The reference unreinforced pavement structure was designed using the French pavement design method (FPDM) (NF P98-086), to get fatigue damage at the end of the experiment. It has two asphalt layers of 6 cm and 5 cm for surface and base layers respectively. The subbase layer is made of unbound granular material (UGM). The subgrade consists of 2.6 m of silty sand above a concrete substratum. All five reinforced structures have the same design as the reference one.
0.8 0.9 1.0 1.1 1.2 1.3 1.4 0.4 0.5 0.6 0.7 0.8 0.9 1 kRe hRe/H Trend - G1 Trend - G3 4PB Test - G1 4PB Test - G3 APT-G1 APT-G3
5
Fig. 4 Plan of six pavement sections tested in the SolDuGri project.
Two asphalt materials were used for the surface and base layers, one is a HMA and the other is a WMA. They have the same formulation of a standard semi-coarse asphalt concrete (SCAC 10 class 3 according to EN 13108-1).
Four different glass fiber grids were chosen for the study. The first three grids (G3, G4 and G5) have the same tensile strength of 100 kN/m, and are coated with three different resins. The fourth grid (G1) has a tensile strength of 50 kN/m and is coated with the same resin as G3.
The tack coat between the asphalt layers is a classical cationic rapid setting bi-tumen emulsion, classified as C69B3 according to EN 13808. The application rate was 350 g/m2 and 700 g/m2 for unreinforced or reinforced pavements respectively. A total traffic of 2.2 million equivalent loads (65 kN dual wheel half-axle load) was applied on the experimental pavement structures from May 2018 to February 2019. Pavement behavior was monitored using embedded sensors (strain gauges, thermocouples) and measurements made on the pavement surface (surface deflec-tion, rut depth, crack monitoring).
3.2 Synthesis of APT results
This paragraph presents a synthesis of the APT results. Due to an important vol-ume of data, results presented in this paper are limited to the reference section S1
Tack coat: Reference: 350 g/m² residual binder Reinforced: 700 g/m² residual binder Reference G3 HMA G4 HMA G1 HMA G3 WMA Instrumentation zone G5 HMA S1 S2 S3 S4 S5 S6 Entry Loading path 1.6 m Direction of rotation 30 cm UGM (145 MPa) 6 cm AC Structures Subgrade (95 MPa) S1 HMA Reference 6 + 5 cm S2 HMA + grid G3 6 + 5 cm S3 HMA + grid G4 6 + 5 cm S4 HMA + grid G5 6 + 5 cm S5 HMA + grid G1 6 + 5 cm S6 WMA + grid G3 6 + 5 cm Sections Theoretical AC thickness Sections dimensions: Average radius: 19 m Width: 3 m S1, S2: L = 22 m S3 to S6: L = 19 m 5 cm AC With or without grid
and two reinforced sections, each built with a grid of different stiffness (S5 and S6 with grids G1 and G3 respectively).
Performance of section S6b was affected by the fact that it is the end of the test track where construction equipment get out and is not considered in the evalua-tion.
3.2.1 Deflection measurements
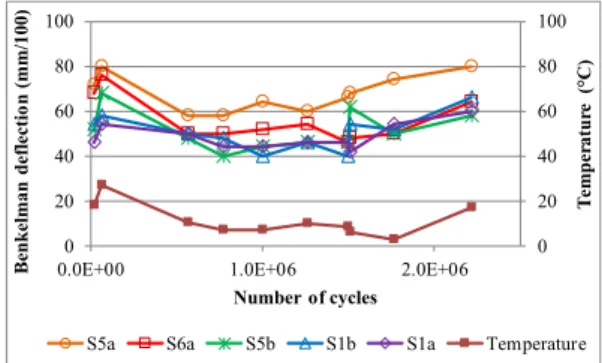
Deflections measured by Benkelman beam at slow speed of the load (about 1m/s) for each section are plotted in Figure 5. Their evolution follows temperature varia-tion during the test (30 mm/100 for less than 30°C). Deflecvaria-tion in secvaria-tion 5a is the highest. The other sections have similar deflections.
Fig. 5 Evolution of deflections during the APT test from Benkelman beam (“a” and “b” stand for
sections with and without instrumentation respectively)
3.2.2 Pavement cracking and rut depth monitoring
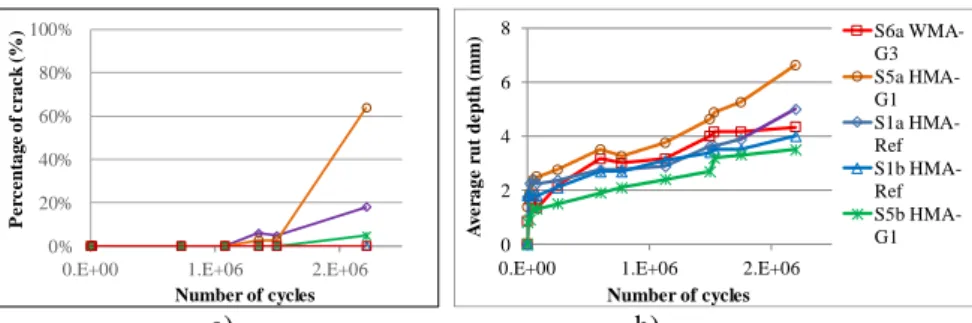
Percentage of cracking on the surface of each section was determined using the crack mapping process (Nguyen et al. 2020b). It is the ratio between the total crack length and the section length. Figure 6a shows that : sections S1b and S6a present the best fatigue behaviour, without any visible crack observed at the end of the experiment; section S5b presents also good fatigue behaviour, reaching a level of cracking of less than 5%; sections S1a and S5a present the worst behaviour, with levels of cracking of 19% and 63% respectively after 2.2 million load cycles.
Average rut depth in each section was determined based on rut depths meas-ured every meter on the pavement surface along the test track. Figure 6b shows that generally all sections had the same trend of rut depth development up to 1.5 millions cycles. After that, rut continued to develop in sections S5a and S1a, while it stabilized in the other three. Among all these five sections, S5b has the lowest rut depth during the APT test. It is followed by three similar sections S1a, S1b and 6b. Section S5a has the highest rut depth.
The high level of cracking and rutting in reinforced section S5a can be ex-plained by the fact that it has several artificial defects (from the instrumentation) and the lowest asphalt thickness.
0 20 40 60 80 100 0 20 40 60 80 100
0.0E+00 1.0E+06 2.0E+06
T emp er atur e ( C) Ben kel man defl ectio n (mm/100 ) Number of cycles
7
a) b)
Fig. 6 Evolution during the APT test of: a) Pavement surface cracking, b) Rut depth
3.2.3 Associated laboratory tests
In parallel to the APT test, asphalt materials were extracted from full-scale pave-ment sections for different laboratory evaluations.
The stiffness modulus of asphalt concrete (without reinforcement), measured by two points bending tests, is close to 12000 MPa at 15°C and 10Hz for both the hot and warm mixes used in the SolDuGri project.
The mechanical behavior at the interface between asphalt layers and the grids was evaluated by means of several test methods (Godard et al. 2019, Gharbi et al. 2017 2020). The results showed clearly a reduction of interface bonding strength in reinforced specimens compared to unreinforced ones.
3.3 Proposal of design procedure for new pavement reinforced
with glass fiber grid
3.3.1 Principle of pavement design procedure
According to the FPDM, for asphalt pavement with thick asphalt layers, two de-sign criteria are applied: a rutting criterion limiting the maximum vertical strain at the top of the subgrade and a fatigue criterion limiting the maximum tensile strain at the bottom of the asphalt layer (Eq. 2). However the second criterion is more relevant for evaluation of pavement lifetime, which is expressed as follow:
(2)
where t,max = maximum calculated tensile strain at the bottom of the asphalt layer, b is the slope of the fatigue line; NE the number of equivalent standard loads; k, kr, kc, and ks are coefficients related respectively with the correction of tempera-ture, the risk of failure, the calibration of the model and the bearing capacity of the foundation just below the asphalt layer; = ε6.kRe where ε6 is the fatigue re-sistance; kRe is introduced to take into account the reinforcement effect when using a grid.
According to Nguyen et al. (2017), a harmonization coefficient kh, equal to 1.1, must be added to the right part of “Eq. 1” for correction of APT results. This
coef-0% 20% 40% 60% 80% 100%
0.E+00 1.E+06 2.E+06
P e rc e n ta g e o f c ra c k ( % ) Number of cycles 0 2 4 6 8
0.E+00 1.E+06 2.E+06
A v e ra g e r u t d e p th ( m m ) Number of cycles S6a WMA-G3 S5a HMA-G1 S1a HMA-Ref S1b HMA-Ref S5b HMA-G1
ficient is introduced to take into account some favorable experimental conditions of APT tests, such as the reduced dynamic load variations, and the limited dura-tion of the tests, which does not simulate long-term pavement aging.
3.3.2 Effects of fatigue resistance and asphalt layers interface bonding
Based on the above results from laboratory and full-scale tests, the behavior of new asphalt pavement structure reinforced by a grid can be considered as follow:
on one side, adding the grid should, in the long term, improve the pave-ment fatigue resistance;
on the other side, the presence of the grid could also reduce the apparent stiffness of the asphalt layer, by reducing the density of the asphalt mate-rial right above the grid and by affecting the strain transfer across the in-terlayer.
The first effect can be taken into account by the reinforced fatigue resistance, noted .
The second effect has several evident consequences: a decrease of the asphalt layer modulus and an increase of the maximum tensile strain at the bottom of the asphalt layer among others. For this effect, two approaches may be used for the design procedure of new reinforced pavement. They are based on the considera-tion or not of an “equivalent” interface layer:
A1 (without equivalent interface layer): to take into account the presence of the grid, a reduced apparent modulus is assigned to the asphalt layer. Only the tensile strain at the bottom of the lowest asphalt layer is consid-ered in the design procedure.
A2 (presence of an equivalent interface layer): this equivalent interface layer can be described using a shear stiffness modulus or a thin interface layer with a reduced apparent modulus.
In this paper, only analysis using the approach A1 is presented.
3.3.3 Calibration of design parameters using inverse analysis
Table 2 presents input data based on APT results. The actual thicknesses of pave-ment layers were determined based on levelling measurepave-ments during construction and on core specimens extracted at the end of the full-scale test. The average thickness of the homogeneous zone in each section is given in table 2. For instru-mented sections, in order to take into account the presence of embedded sensors at the bottom of the asphalt layer, the thickness of the base layer was reduced by 0.8 cm (position of the middle of the sensors from the bottom of the asphalt layer).
The Young modulus of the asphalt layers is the same for the surface and base layers in each section. According to the approach A1, this value was reduced by 500 MPa and 1000 MPa for asphalt layer in sections S5 and S6 reinforced grids G1 and G3 respectively. This reduction is consistent with results from modulus measurements in the 4PB laboratory tests and from backcalculation of FWD
9
measurements on the full-scale structures. These results are not detailed in this pa-per due to its limited length.
Based on these input data, the maximum tensile strain (t,max) at the bottom of the asphalt layer was calculated for each section using the Alizé-LCPC pavement design software. Then, with these values, and knowing the number of loads ap-plied in the APT test (NE), Eq.2 was used to back-calculate the calibration coeffi-cient of each structure. In this calculation, the risk of failure of each section was assumed equal to the percentage of cracking of that section. With these assump-tions, coefficients of calibration equal to 1.3, 1.35 and 1.4 were obtained for sec-tion S1 (HMA without grid), S5 (grid G1) and S6 (grid G3) respectively.
Table 2 Synthesis of input data and calibrated design parameters
Parameter S1a*-Ref. S1b-Ref. S5a*-G1 S5b-G1 S6a*-G3 Surface thickness h1 (cm) 6.1 6.8 6.4 6.6 8 Base thickness h2 (cm) 4.4 4.7 3 3.8 3.1 Thickness ratio (h1/H) 0.68 0.64 0.72 AC modulus at 15°C - 10 Hz (MPa) 12000 12000 11500 11500 11000 Subgrade modulus (MPa) 100 110 100 110 96
t,max (Alizé calculation) (m/m) 145.6 130.2 163 145.5 147.7
Calculated risk of failure kr,calcul (%) 20.4 3.7 37.3 10.3 2.1
Observed cracking at 2.2m cycles (%) 19 < 5 63 < 5 < 5 Calibration coefficient kc 1.3 1.3 1.35 1.35 1.4
* section with instrumentation
In parallel, based on the APT results and in particular on the observed cracking, it is possible to determine, by backcalculation using the pavement design software Alizé-LCPC, an actual value of reinforcement coefficient for each reinforced full-scale pavement section kRe(APT). Obtained values based on APT results, plotted in Figure 3, are consistent compared with the corresponding trend curves estab-lished based on 4PB fatigue tests.
4 Conclusions and perspectives
This paper presents a synthesis of results of laboratory fatigue tests and of a full-scale accelerated test on asphalt pavements with and without reinforcement using glass fiber grid. Laboratory 4PB fatigue tests carried out on unreinforced and rein-forced beams with grids at two positions allowed to determine a relationship be-tween the reinforcement effect and the position of the grid in the asphalt layer. For the both studied grids, the more the grid is far below the apparent neutral axis of the beam, the better the fatigue resistance of the reinforced beam is. APT experi-ment showed that using glass fibre grid did not influence the paveexperi-ment deflection,
but can reduce crack appearance and rut development once cracks started to ap-pear on the pavement surface.
Analyses show that other mechanisms, in particular crack propagation (Nguyen et al. 2020a) and the capacity of glass fiber grid for mitigation of reflective crack-ing, should be also considered in the design procedure of new and existing pave-ments reinforced with glass fiber grid.
Acknowledgment
The work presented in this article was sponsored by the French National Research Agency (ANR—SolDuGri project ANR-14-CE22-0019).
References
Arsenie I., Chazallon C., Duchez J.L. Hornych P., (2017) Laboratory characterization of the fa-tigue behaviour of a glass fibre grid reinforced asphalt concrete using 4PB tests. Road Mate-rials and Pavement Design, 18:1.
Chazallon C., Barazzutti C., Pelletier H., Nguyen M.L., Hornych P., Mouhoubi S., D. Doligez (2020) Reproduction of Geogrid In Situ Damage Used in Asphalt Concrete Pavement with Indentation Tests. Journal of Testing and Evaluation, 48:1.
Gharbi M., Nguyen M.L., Chabot A. (2017) Wedge Splitting Characterization of the bond be-tween asphalt layers reinforced with glass fibre grid. BCRRA, Athens.
Gharbi M, Chabot A, Geffard JL, Nguyen ML (2020). Interlaminar Mode-I Fracture Characteri-zation under Water of Reinforced Bituminous Specimens. In RILEM Bookseries, ISBM, Lyon.
Godard E., Chazallon C., Hornych P., Nguyen M.L., Doligez D., Pelletier H., Michel D., Lau-rence L., Brissaud L. (2019) Projet Soldugri – avancement de l’étude du renforcement des en-robés bitumineux par de grilles de verre. RGRA, 967.
Hornych P., Kerzreho J.P., Chabot A., Bodin D., Balay J.M., and Deloffre L. (2008) The LCPC’s ALT facility contribution to pavement cracking knowledge. 6th international RILEM
confer-ence on Cracking in Asphalt Pavement, Chicago.
Nguyen M.L., Blanc J., Kerzreho J.P., Hornych P. (2013) Review of glass fibre grid use for pavement reinforcement and APT experiments at IFSTTAR. Road Materials and Pavement Design, 14:S1.
Nguyen M. L., Balay J. M., Di Benedetto H., Sauzéat C., Bilodeau K., Olard F., Héritier B., Dumont H., Bonneau D. (2017) Evaluation of pavement materials containing RAP aggregates and hydraulic binder for heavy traffic pavement. Road Materials and Pavement Design, 18:2. Nguyen M.L., Chupin O., Blanc J., Piau J., Hornych P., Lefeuvre Y. (2020a) Investigation of
Crack Propagation in Asphalt Pavement Based on APT Result and LEFM Analysis. Journal of Testing and Evaluation 48 (in press).
Nguyen M.L., Blanc J., Trichet S., Gouy T., Coirier G., Baudru Y., Le X.Q., Nguyen M.D., Siroma R.S., Hornych P., Blaineau F. (2020b) Rapid and Continuous Imaging for Crack Monitoring during APT Experiments. 6th International Conference on Accelerated Pavement