Accelerated Settling of Particulate Matter by 'Marine Snow' Aggregates
by
Vernon L. Asper
B.A., Messiah College (1978) M.S., University of Hawaii (1981)
SUBMITTED IN PARTIAL FULFILLMENT OF THE REQUIREMENTS FOR THE DEGREE OF
DOCTOR OF PHILOSOPHY at the
WOODS HOLE OCEANOGRAPHIC INSTITUTION and the
MASSACHUSETTS INSTITUTE OF TECHNOLOGY December 1985
Q Vernon Asper 1985
The author hereby grants to M.I.T. permission to reproduce and to distribute copies of this thesis document in whole or in part.
Signature of Author....
Certified
Accepted by.. o4S4t... OF TIJS IA
M
ARIES
Joint Program in Marine Geology and Geophysics, Woods Hole Oceanographic Institution / Mangnehutit Institute of Technolo,
. . .
The )uvervtsor z
7,
~~~~~~-
-------- - - --.rman, Joint Committee of Marine Geology and Geophysics, Woods Hole
Oceanographic Institution / Massachusetts Institute of Technology
by... . ... .
-ii-This thesis is dedicated to my daughter, Alicia Danielle Asper
-11-TABLE OF CONTENTS LIST OF FIGURES...iv LIST OF TABLES...vii ABSTRACT...viii ACKNOWLEDGMENTS...xi INTRODUCTION...1
CHAPTER 1. TIME SERIES SEDIMENT TRAP EVIDENCE FOR RAPID SETTLING OF MARINE PARTICULATE MATTER BY AGGREGATES... 5
CHAPTER 2. THE DISTRIBUTION AND TRANSPORT OF MARINE SNOW AGGREGATES IN THE PANAMA BASIN AND NORTHEAST ATLANTIC OCEAN...51
CHAPTER 3. MEASURING THE FLUX AND SINKING SPEED OF MARINE SNOW AGGREGATES...136
-iv-LIST OF FIGURES
1.1 Measured sediment flux at site PB2 in the Panama Basin...16 1.2 Measured sediment flux at Station Papa in the North Pacific..20 1.3 Cross correlation of the flux of particles in shallow
. deep traps at station Papa...22 1.4 Measured sediment flux in the Black Sea...25 1.5 Cross correlation of the flux of particles in shallow
. deep traps in the Black Sea...29 Figure 1.6 Ratios of the flux of various particle type to to
flux in the Panama Basin... Figure 1.7 Ratios of the flux of combustible material to bio
minerals (opal and carbonate) at Station Papa... Figure 1.8 Ratios of the flux of various particle types to t
flux in the Black Sea... Figure 1.9 Ratio of the fluxes of several particle types in
Black Sea... ... Figure 1.10 Diagram of the three flux signal types identified
study... Figure 2.1 Configuration of marine snow photography system.. Figure 2.2 Location map of marine snow profiles taken on R/V cruise #94 in the Northwest Atlantic Ocean... Figure 2.3 Cruise track of R/V Columbus Iselin (cruise CI-83
marine snow profile stations... Figure 2.4 Scanning electron microscope (SEM) micrographs of
point dried marine snow aggregates... Figure 2.5 Photographs of marine snow taken by photographic
system in the Panama Basin... Figure 2.6 Profile of marine snow abundance in the Panama Ba
comparing unprocessed with filtered data...
tal mass ... .. 33 genic ... .... 37 otal mass ... 40 the in this .... 42 .... 46 Q Knorr .... *... 63 -13) showing ... 66 critical ... 70 survey ... 72 sin .. ... 75
Figure 2.7 Vertical profile of suspended matter taken from hydrocasts and large volume in situ pumps in the Panama Basin... Figure Figure Figure vs Figure Figure vs ..78
Figure 2.8 Transect of marine snow abundance profiles taken in the
Panama Basin south of the Coiba Ridge...81 Figure 2.9 Profiles of marine snow abundance taken offshore of
Guayaquil, Ecuador... 86 Figure 2.10 Profile of marine snow abundance taking in the Western
North Atlantic...89 Figure 2.11 Contour plot of marine snow abundance in the Western
North Atlantic and Panama Basin...95 Figure 2.12 Profiles of marine snow abundance in the Panama Basin
showing relative temporal stability of the observed signals...100 Figure 2.13 Results of time series sediment traps deployed at the
S.T.I.E. site in the Panama Basin...108 Figure 2.14 Schematic of proposed flux model...113 Figure 2.15 SEM images of samples of biogenic carbonate collected by a
sediment trap at 3800m in the Panama Basin...117 Figure 2.16 SEM images of sediment samples collected by DSRV Alvin
at the sediment trap site...119 Figure 3.1 Configuration of marine snow flux camera system...143 Figure 3.2 Configuration of mooring system used to deploy the flux
camera in 3900m of water in the Panama Basin...146 Figure 3.3 Flux camera photographs showing the accumulation of material
in the sediment trap...151 Figure 3.4 Flux camera photographs showing resuspension events...153 Figure 3.5 SEM images of material collected by the flux camera trap.... 156 Figure 3.6 Plot of the number of aggregates in the trap vs. time since
deployment...159 Figure 3.7 Plot of image area occupied by aggregates in the trap vs.
time since deployment...161 Figure 3.8 Flux camera photographs of particle motions associated with
resuspension event at 23 hours...164 Figure 3.9 Flux camera photographs of resuspension event at 26 hours.. .166 Figure 3.10 - 3.12 Plots of the arrival of aggregates in three size
-vi-Figure 3.13 Plot of the average diameter of aggregates in the trap vs. time since deployment...173 Figure 3.14 Vertical profiles of the abundance of marine snow aggregates
-vii-LIST OF TABLES
Table 1.1 Summary of PARFLUX sediment trap deployments and samples
reviewed in this thesis...12 Table 1.2 Correlation coefficients for components of the observed
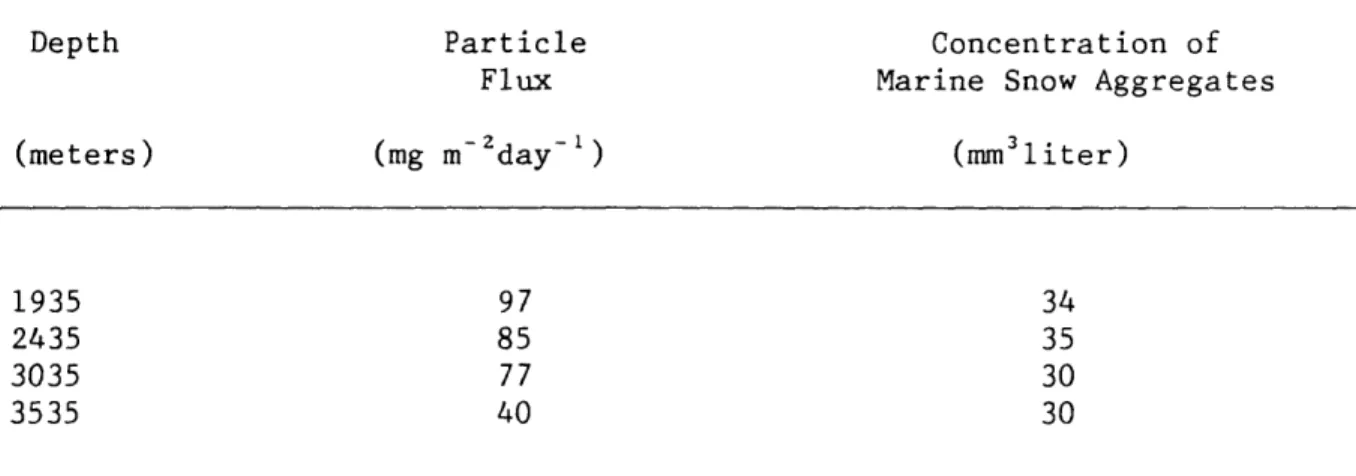
flux with lithogenic flux in the Panama Basin...35 Table 2.1 Correlation of particle flux with marine snow abundance
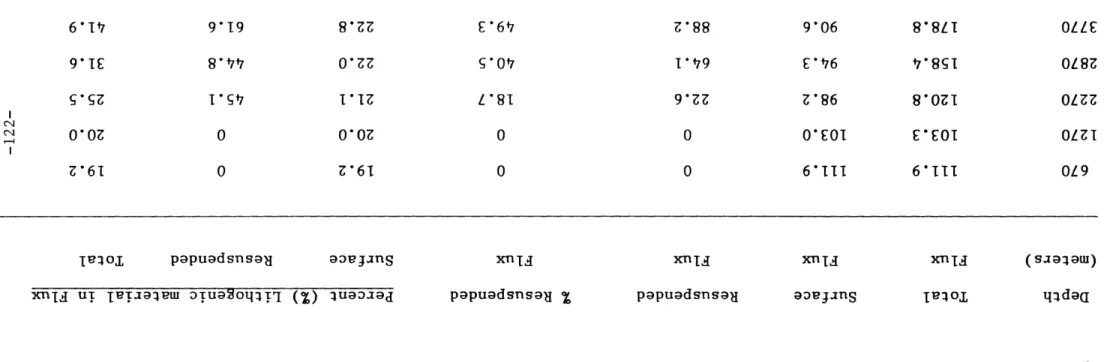
in the Panama Basin...107 Table 2.2 Calculated contributions of surface and resuspended flux
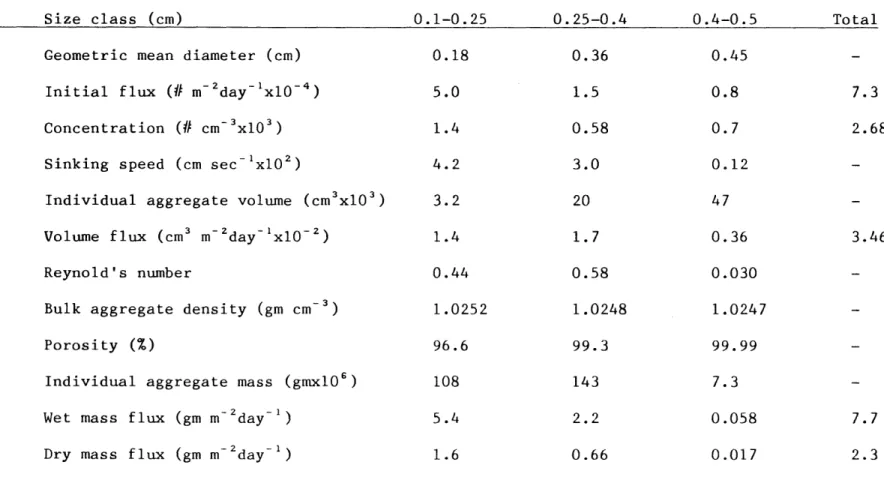
in sediment trap samples in the Panama Basin...122 Table 3.1 Calculated bulk densities and mass flux contributions of
-viii-ACCELERATED SETTLING OF MARINE PARTICULATE MATTER BY 'MARINE SNOW' AGGREGATES
by
VERNON L. ASPER
Submitted to the Woods Hole Oceanographic Institution and Massachusetts Institute of Technology
in partial fulfillment of the requirements for the degree of Doctor of Philosophy
ABSTRACT
Samples from time-series sediment traps deployed in three distinct oceanographic settings (North Pacific, Panama Basin, and Black Sea) provide strong evidence for rapid settling of marine particles by aggregates.
Particle water column residence times were determined by measuring the time lag between the interception of a flux event in a shallow trap and the interception of the same event in a deeper trap at the same site.
Effective sinking speeds were determined by dividing the vertical offset of the traps (meters) by the interception lag time (days). At station Papa in
the North Pacific, all particles settle at 175 m day~1, regardless of
their composition, indicating that all types of material may be settling in common packages. Evidence from the other two sites (Panama Basin and Black
-lx-Sea) shows that particle transport may be vertical, lateral, or a
combination of directions, with much of the Black Sea flux signal being dominated by lateral input.
In order to ascertain whether marine snow aggregates represent viable transport packages, surveys were conducted of the abundance of these
aggregates at several stations in the eastern North Atlantic and Panama Basin using a photographic technique. Marine snow aggregates were found in concentrations ranging from ~1 mm3
liter~' to more than 500 mm3
liter~'. In open ocean environments, abundances are higher near the surface (production) and decline with depth (decomposition). However, in areas near sources of deep input of resuspended material, concentrations reach mid-water maxima, reflecting lateral transport. A model is proposed to relate the observed aggregate abundances, time series sediment flux and inferred circulation. In this model, depthwise variations in sediment flux and aggregate abundance result from suspension from the sea floor and
lateral transport of suspended aggregates which were produced or modified on the sea floor. Temporal changes in sediment flux result from variations in the input of fast-sinking material which falls from the surface,
intercepts the suspended aggregates, and transports them to the sea floor. A new combination sediment trap and camera system was built and
deployed in the Panama Basin with the intent of measuring the flux of marine snow aggregates. This device consists of a cylindrical tube which is open at the top and sealed at the bottom by a clear plate. Material lying on the bottom plate is illuminated by strobe lights mounted in the wall of the cylinder and photographed by a camera which is positioned below
the bottom plate. Flux is determined as the number of aggregates arriving during the time interval between photographic frames (# area-1 time-'). Results show that essentially all material arrives in the form of aggregates with minor contributions of fecal pellets and solitary
particles. Sinking speeds (m day-'), calculated by dividing the flux of aggregates (# m-zday-) by their abundance (# m-3 ), indicate that the
larger (4-5mm) aggregates are flocculent and sink slowly (~1m day-') while the smaller aggregates (1-2.5mm) are more compact and sink more quickly (~36m day-'). These large, slow-sinking aggregates may have
-xi-ACKNOWLEDGMENTS
The single most important person in my life, and the one most responsible for my continued enthusiasm is my wife, Lindell. Over the course of my graduate studies, she has been alone almost one full year, yet she remains supportive of my career and is a constant and vital source of loving encouragement.
Without the advice, encouragement and generosity of Sus Honjo, I might be repairing microscopes today. Sus not only provided all of the financial and logistic support for my data collection, but he also pointed me in the direction of marine snow research, provided me with his one-of-a-kind
camera system, and, in essence, turned over to me an area of research which has been very special to him for many years. In addition, Sus generously provided unlimited access to all of his sediment trap samples and
unpublished data for inclusion in my thesis. Sus has provided uncommon opportunities to gain valuable experience, not the least of which is the fulfillment of a lifelong ambition to dive in the Alvin.
Discussions with Kozo Takahashi have been a great influence over the last six years. On many occasions Kozo's unique perspective helped to clear my thinking and focus my concentration.
Steve Manganini has been a good friend and companion on several cruises. He taught me everything I know about deploying, finding, and recovering deep-sea moorings and was responsible for all of the sample analyses included in this thesis. Abby Spencer provided cheerful
-x1i-encouragement, helped perform the analyses, and was a pleasure to be with on cruises.
In addition to their role as advisor, each member of my thesis
committee contributed uniquely to the success of my efforts. Bill Curry's point of view was instrumental in making many career decisions and
scientific discussions with him helped me sort out the importance of my data. Mike Bacon provided unpublished hydrocasting and large volume pump data. Larry Madin supplied ship time for the Atlantic marine snow survey. Recommendations by Ed Boyle at critical times helped prevent my efforts from becoming diverted from important subject areas. John Milliman provided useful input and chaired the thesis defense.
Dave Aubrey was my longsuffering tutor in differential equations and time series analysis and provided useful criticisms of my thesis proposal and finished thesis. Hans Schouten and Charles Denham patiently taught me geophysics and provided the subject matter for one of my general
examination papers. Discussions with Bernward Hay led to a deeper understanding of the Black Sea environment. Rindy Osterman was an invaluable co-worker on several sediment trapping cruises and provided endless entertainment and encouragement.
I would like to thank the officers and crews of all the ships used to deploy the marine snow camera and sediment traps, including the Polarstern, Atlantis II, Columbus Iselin, Knorr, C.F.A.V. Endeavor, Piri Reis, Cayuse, and Kaimalino. A special thanks to the Alvin group for their cooperation and for making those cruises so pleasant.
-x1ii-Skip Pelletier helped design and build the various electronic gadgets and freely loaned any piece of equipment I needed. On numerous occasions, Earl Young generously loaned his valuable deep-sea cameras, without which most of the data could not have been collected. Ken Doherty refined the design of the flux camera, assisted on several cruises, and supplied unlimited engineering expertise. Cindy Pilskaln, Jon Trent, Peter Sachs, and Terry Hammer helped out on cruises and Amy Karowe helped with
laboratory analyses of sediment trap samples. Emily Evans helped with many aspects of the preparation of this manuscript.
This research was supported by ONR contract numbers N00014-82-C-0019 and N00014-85-C-0001, NSF grant numbers OCE-83-09024, OCE-84-17106, and DPP-85-01152 and the WHOI education office;
-1-INTRODUCTION
Ever since the existence of life on the deep-sea floor was confirmed by the Challenger expedition, scientists have speculated over the source and transport mechanism of energy to this environment. Early ideas focused on a slow, continuous rain of particles which delivered to the benthos material which had spent considerable time in the water column and was mostly decomposed.
Several sources of evidence have emerged over the past 30 years which indicate that marine particles may settle very quickly from the surface to the sea floor. For example, the distribution of clay minerals and
coccolithophorids at the sea surface is reflected in their respective distributions on the sea floor (Berger, 1976; Honjo, 1976). If these
particles settled at their expected low Stokesian rates, dispersal by ocean currents would prevent any such correspondence. Material collected in deep-sea sediment traps was found to be remarkably well preserved and often
intact, indicating short water column residence times.
Perhaps the strongest support of rapid settling was reported by Honjo (1982) from the first time-series sediment trap deployment. Honjo found that the flux vs. time signal observed in a near surface trap was repeated in several deeper traps over the same sampling intervals. This could only happen if particles were settling faster than 40 m day~' and indicates
that the benthic community is being supplied with a time-varying source of energy and nutrients.
-2-Honjo (1980) proposed that transport by fecal pellets could, in some cases, explain this rapid transfer of particles to the sea floor. However, later evidence showed that insufficient quantities of fecal pellets are found in most sediment trap samples to account for the observed flux (Honjo, 1982a). Further, scanning electron microscopy of these samples showed most particles to be unfragmented, indicating that passage through a grazer's gut was unlikely.
"Marine snow" has been proposed as a possible alternative transport mechanism (Honjo, 1982b; Shanks and Trent, 1978). These large, amorphous, organic aggregates have been studied intensively by biologists interested in their potential role in marine ecosystems. However, relatively few studies have been published regarding their potential role in sediment flux, and deep-sea measurements of their existence and settling
characteristics are rare (see Shanks and Trent, 1980; Silver and Alldredge, 1981).
The research described in this thesis is aimed at investigating the potential role of marine snow aggregates in the transport of particulate matter. In order for marine snow to be important in the settling of particles, three criteria must be met: 1) sufficient evidence must be produced to show that particles do, indeed, settle at accelerated rates
(ie. faster than expected based on assumptions of solitary sinking), 2) marine snow aggregates must exist in sufficient quantities at all ocean depths, and 3) these aggregates must settle at sufficiently high rates. This thesis is divided into three chapters, each aimed at addressing these criteria.
-3-The first chapter presents a review of largely unpublished PARFLUX sediment trap data provided by Susumu Honjo. Data from depth-paired sediment traps exist for three environments: Station Papa in the North Pacific, the Panama Basin, and the Black Sea. These data allow the determination of effective particle sinking speeds (using the depth
interval / interception time lag method) and also provide indications of particle packaging and transport pathways.
Marine snow distributions and abundances in two geographic areas are presented in chapter two. Vertical profiles of abundance reveal the locations of sources; comparison of several profiles taken at the same position but hours, days, weeks, or months apart reveal the relative temporal stability of these sources. Finally, transects of several vertical abundance profiles show whether the aggregates are moving laterally and also indicate the spatial scale of variations.
Chapter three presents the results of an attempt to directly measure the flux of marine snow aggregates using a combination sediment trap and camera. The camera records the successive addition of particles which fall into the trap between film exposures. Aggregate sinking speeds (m day-') can be calculated by dividing the flux (# m-2 day-') by the observed
aggregate abundance (# m~3). This method also allows observation of scavenging organisms feeding on the collected sample, as well as possible post-collection decomposition or break-up of the aggregates.
-4-REFERENCES
Berger, W.H. (1976) Biogenous deep sea sediments: production, preservation and interpretation. In: J.P. Riley and R. Chester (eds.), Chemical Oceanography, 5, 265-388.
Honjo, S. (1976) Coccoliths: production, transportation and sedimentation. Mar. Micropaleo., 1, 65-79.
Honjo, S., (1980) Material fluxes and modes of sedimentation in the mesopelagic and bathypelagic zones. J. Mar. Res., 38(1), 53-97.
Honjo, S., (1982) Seasonality and interaction of biogenic and lithogenic particulate flux at the Panama Basin. Science, 218, 883-884.
Honjo, S., S.J. Manganini, and J.J. Cole (1982a) Sedimentation of biogenic matter in the deep ocean, Deep-Sea Res., 29(5A), 609-625.
Honjo, S., S.J. Manganini, L.J. Poppe (1982b) Sedimentation of lithogenic particles in the deep ocean. Mar. Geol., 50, 199-220.
Shanks, A.L. and J.D. Trent (1980) Marine snow: sinking rates and potential role in vertical flux. Deep-Sea Res., 27, 137-143.
Silver, M.W. and A.L. Alldredge (1981) Bathypelagic marine snow; deep-sea algal and detrital community. J. Mar. Res., 39, 501-530..
-5-Chapter 1
TIME SERIES SEDIMENT TRAP EVIDENCE
FOR RAPID SETTLING OF MARINE PARTICULATE MATTER BY MARINE SNOW AGGREGATES
-6-Abstract
In addition to their usefulness as recorders of particle production events, time series sediment traps also provide indications of particle transport pathways and mechanisms. A review of recent PARFLUX sediment trap data reveals evidence supporting rapid settling via aggregates.
Cross-correlation of the signals from shallow and deep time-series flux (mg m-2
day-') signals indicates that: a) all particles settle at similar
speeds regardless of their composition, b) the observed sinking speeds are significantly higher than expected for particles settling as individuals, and c) combustible (organic) material correlates best in shallow and deep traps and is indicated as a controlling factor in the settling of other particles. Three classes of flux signals are identified: a) Vertical settling (Mid-North Pacific) where flux peaks appearing in shallow traps also appear in deep traps with equal or diminished amplitude, b) lateral transport (Black Sea) where many flux peaks appear only in the deep trap, and c) a combination of vertical settling and lateral input (Panama Basin) where peaks occur in both shallow and deep signals but with higher
-7-INTRODUCTION
Particles sinking through the oceanic water column transfer energy and nutrients from the surface mixed layer to the deeper aphotic layers and the
sea floor. The speed and rate at which this transfer takes place will affect the degree of coupling between surface and deep processes as well as
the site of deposition or dissolution. Before the era of wide spread sediment trap experiments, it was assumed that most particles settled individually, resulting in a slow, continuous rain of particles to the sea floor and a complete spatial and temporal decoupling of surface and bathyl environments. Recent evidence, however, indicates that when particles settle, their sinking speeds are generally quite high and that the flux of various types of material collected in traps is correlated. Fine particles settle only when they become part of some type of larger faster-sinking particles such as fecal pellets or marine snow aggregates (Honjo 1982, Honjo et al. 1982a,b), requiring that a distinction be made between "suspended" and "settling" particles (Honjo, 1982, 1984).
While sediment traps provide the means of collecting the settling particles, the integrity of the sedimenting package has not been shown to be preserved in the recovered samples. Most sediment trap samples not only contain insignificant numbers of recognizable fecal pellets (Pilskaln,
-8-1985), they are also dominated by intact phyto- and zooplankton which apparently have not been consumed or digested by feeding organisms (K. Takahashi, pers. comm., 1985). Marine snow aggregates are extremely fragile and unlikely to survive sample analyses (sieving and splitting), making dependable evaluation of aggregate size and abundance impossible in sediment trap samples. Therefore, knowledge of the sedimentation
mechanisms, indications of particle packaging, and sinking speed
information must be derived from less direct evidence using sediment trap material.
Modern, time-sequencing sediment traps are capable of providing this information in several ways. In situ particle transit times can be
determined by placing synchronized traps at several depths along a
mooring. The time offset between the arrival of a flux event ("peak" or "valley" in the flux vs. time curve) at near-surface and near-bottom traps will be a measure of the transit time. This lag time divided by the
vertical separation of the traps yields the effective sinking speed. This calculation assumes that the events can be identified in both traps and that the flux signal measured in this way is produced by vertical
sedimentation and is not an artifact of trap efficiency. This method can be applied to all types of settling particles. If sinking speeds appear to correlate with particle size, then individual sinking is inferred.
However, if similar sinking speeds are observed for many sizes and weights of particles, then aggregated settling is indicated for the non-fecal pellet material.
A second type of evidence for aggregate sedimentation can be obtained by examining the correlations (ratios) of the fluxes of various
-9-components. As they settle through the water column, marine snow
aggregates are thought to intercept and scavenge fine, suspended particles and incorporate them into the settling package. If this is, in fact, the
case, then the flux of these fine particles (eg. clays, individual coccoliths, small diatoms) should correspond with the flux of organic matter and biogenic minerals. Examination of the ratios and degree of
correlation of fine particle fluxes to various components should indicate which components (if any) control the sedimentation of fine particles.
Lithogenic material, defined by Honjo et al., (1982b) as the portion of the flux which is neither combustible, acid soluble, nor Na2CO3
leachable, represents a useful tracer of the flux pathway of fine
particles. This lithogenic matter is generally conservative in the deep sea and would remain essentially suspended due to its small particle size, unless incorporated in settling aggregates. (Honjo 1985).
Investigation of these correlations can be applied to time series flux samples and to samples collected in different environments and depths. Each environment will be characterized by a specific seasonal cycle of primary and secondary production as well as input of lithogenic material. By looking at several environments and seasons, it should be possible to determine the relative importance of each factor. For example, lithogenic material may be transported with carbonate particles in one environment (or
season) and with siliceous particles in another.
In this paper, the results of several PARFLUX sediment trap
deployments will be reviewed with the intent of examining sedimentation trends in several environments. Three of these deployments included
-10-multi-depth time series traps, allowing direct estimation of particle
sinking speeds. At each location, the correlation of lithogenic flux to
other components will be examined in order to evaluate similarities and differences in particle packaging and transport.
-11-METHODS Sample collection and analysis
Since its inception in 1975, the PARFLUX sediment trap has evolved from single receptacle, 1.5m2 opening, polyvinyl-chloride cones (1976-80) to the present, multi-receptacle designs (1982-present, Honjo et al., 1980). These new traps are smaller (0.5-1.2m2 opening), constructed of lighter, more durable polypropylene, controlled by sophisticated
microprocessors, and collect up to 25 samples per deployment (Honjo 1985). Table 1.1 lists a summary of sediment trap samples collected and analyzed by the PARFLUX group over the past 10 years and partially reviewed in this paper. All traps deployed along a single mooring were programmed to take synchronous samples.
In the laboratory, these samples are treated according to the method of Honjo (1982). The samples are first sieved into 3 size fractions (<63imm 63pm-lmm, and >1mm) and then split into smaller aliquots for the individual chemical analyses. Total mass flux (mg m-2 day-') is determined by weighing a dried aliquot of material and normalizing the
result for the size of the trap opening and the duration of the
deployment. Carbonate flux is determined by weight loss on addition of a weak acid, and combustible material flux as weight loss after ashing (4 hours at 500*C) a carbonate free sample. Biogenic silica is determined by leaching a carbonate free sample in 1M Na2CO3 at 90*C for three hours.
Lithogenic flux is defined as the difference between the non-combustible and biogenic silica fluxes. This method works well where the ratio of lithogenic to biogenic opal flux is ca. 0.3 or greater. However, if this
-12-Table 1.1 Summary of PARFLUX sediment trap samples reviewed in this manuscript. Panama Basin PB2 5022'N 85*35'W Station Papa PPi- 3 5000'N 14500'W 12/79-12/80 10/82-4/84 10/82-10/84 Depth(m)/ # of samples Total samples Water Depth 890/6 2590/6 3560/6 1000/18 3800/59 250/59 1200/47 106 3850 4200 Station Name Location Dates Black Sea BSi -4 42010'N 32032'E 2200
-13-ratio is low (< ca. 0.3), small errors in silica leaching, opal weight estimation (grams of opal from moles of Si), or sample weighing will result in errors which overwhelm the lithogenic flux signal. At station Papa in the North Pacific, lithogenic flux is very small relative to biogenic opal (ratio <0.2) so that no accurate assessment of lithogenic flux is available using the described methodology.
Deployment Site Description
Three principal sites will be discussed: Panama Basin, North Pacific (weather station Papa), and the Black Sea. Each location is characterized by a unique set of environmental and oceanic features which influence the nature of the samples collected.
The Panama Basin is a semi-enclosed, equatorial basin characterized by seasonal upwelling and high primary production. The deployment site (Honjo 1982) is located in the Coiba Gap between the Malpelo and Coiba ridges in 3900m of water. This location is well within the influence of material which is re-suspended from the Coiba ridge and transported offshore at midwater depths, resulting in the observed depthwise flux changes reported by Honjo et al. (1982a,b).
In contrast to this proximity to sources of deep terrigenous input, station Papa is located over 2000 km from any potential source of lateral input. Primary production is moderately high with major peaks in sediment flux occurring in May and August (Honjo, 1985). These peaks in flux
correspond in part to seasonal succession of various phyto- and
micro-zooplankton species (Takahashi, 1985) and help to prove that both shallow and deep traps are intercepting the same material as it settles from the euphotic zone.
-14-While the Black Sea deployment site is most noted for its anoxic water chemistry, this condition has little effect on the collection of settling particles. Restricted circulation in the Black Sea has resulted in the depletion.of oxygen below 100-250m throughout the 2200m deep Basin (Deuser, 1974). These conditions favor the accumulation of particles due to reduced decomposition in the sediments, but have little effect on the overall
delivery of material to the sea floor. In the 'typical" oceanic environment, most (~90%) recycling of organic matter occurs in the surface water with lesser amounts occurring in the sediment and almost insignificant loss occurring as the particles settle (Honjo et al., 1982a,b) due to their short water column residence times. From the
viewpoint of settling particle collection, and for the components examined here, the two important environmental characteristics of this site are its proximity to the continental shelf (<40 km) and the relatively warm water temperature (-9*C). Proximity to sources of deep lateral input (shelf and slope) will result in a similar situation to the Panama Basin where flux increases with depth. In the Black Sea, this deep input will be more seasonal than in the Panama Basin due to the effects of storm-induced resuspension on the shelf (B. Hay, pers. comm., 1985). Warmer deep water enhances preservation of carbonate and dissolution of silica, in spite of low pH which would favor opposite tendencies. Anoxic conditions may enhance post-depositional preservation of labile organic material in the trap samples, although this effect will be similar to the addition of a chemical preservative at oxygen rich deployment sites.
-15-RESULTS AND DISCUSSION
Sinking Speed
Honjo (1982) published the results of a multiple time series sediment trap experiment in the Panama Basin (fig. 1.1). These plots of flux vs. time and depth indicate first, that fluxes of all components increase with depth due to deep lateral input, and second that the fluxes of all
components are well correlated. That is, the primary bimodal signal observed in total mass flux also appears in organic carbon (combustible material), carbonate, biogenic opal, and lithogenic particle flux. The
large summer peak in flux is the result of a bloom of a single
coccolithophorid species (Umbellicosphaera sibogae). As nutrients were depleted, the coccolithophorids entered a palmelloid stage (Smayda 1971, Honjo 1982) and settled very quickly. During the resulting flux event, the
receiving cup (#4) in the 890m trap was completely full and material from this time interval may have been carried into the subsequent cup (#5); no compensation has been attempted for this effect. Carbonate flux during this period (and consequently total mass flux) decreased slightly with depth, in contrast to all other samples where flux increased. This
singular decrease is interpreted as indicating that the bloom covered only a limited geographic area, the decrease resulting from dispersal of the coccolith remains as they settled. In order for this material to intercept both the 890m and 3560m traps in a single two-month sampling interval, the particles must have settled through the 2670m of water in no more than 61 days. This results in a minimum sinking speed of 44 m day~1 although the speed could have been much higher.
-16-Figure 1.1 Measured sediment flux at site PB2 in the Panama Basin
(Honjo, 1982). Numbers designate sequential samples over a period of one year; only 4 usable samples were obtained at 890m and 2590m. a) Total mass
flux. b) Biogenic carbonate flux. c) Biogenic opal flux. d) Lithogenic material flux. e) Combustible material flux.
Panama Basin
1000
800
r
~
I I
~
I
a
a I -
a I
0 JanFeb Jul Aug Sep Oct Nov Dec
b 890 meters 2590 meters
201
.3..
0. . r ' I
-Jan Feb Mar Apr May Jun Jul Aug Sep Oct Nov Dec
C 890 meters 2590 meters 3560 meters
A
-
2-.---102 ?0
O N e a a a
SJan Feb Mar Apr May Jun Jul Aug Sep Oct Nov Dec
890 meters 2590 meter~s 3560 meters
1400 -1200 -1000 800 600 400
-0 Jan Feb -Mar Apr May Jun Jul Aug Sep Oct Nov Dec
3560 meters 2590 meters 3560 meters
Panama Basin
4 I A a ff I J I I I I i 7 7. ~ ~ LJan Feb Mar Apr May Jun Jul Aug Sep Oct Nov Dec
-19-The findings of this experiment (Honjo, 1982) pointed to the need for a similar experiment with shorter sampling intervals to provide higher temporal resolution. Deployments of improved (12 samples/deployment) sediment traps were initiated in the Black Sea and at the former site of weather Station Papa in the North-Central Pacific (50*N 145*W) in the fall of 1982 (Honjo, 1985). Logistic constraints limited depth-paired
observations at station Papa to one set of twelve samples plotted in figure 1.2. In this case, the flux peaks are offset one sampling interval (ca. 16 days) over the 2800 m vertical displacement, indicating an average sinking speed of 175 m day~' for all particles. This lag interval is confirmed by cross-correlation of the results of the first 36 deep (3800m) samples
and the middle 12 shallow (1000m) samples (fig. 1.3a). These values were obtained by first linearly interpolating both sets of data to an even sampling interval (16 days). Best correlation (0.88) is obtained at an offset of one sampling interval (lag one), confirming the subjective observation that the same signal appears in both shallow and deep traps, and that, within the limits of confidence, the offset is one sampling interval (16 days).
The same pattern is also observed in each of the particle types evaluated. Figures 1.2b-d show plots of carbonate, opal and combustible flux as well as the cross-correlations of these fluxes in shallow and deep traps (fig. 1.3b-d). As in the total mass flux, each constituent
correlates best at a lag of one sampling interval, with correlations ranging from 0.79 for carbonate to 0.96 for combustible material. The sinking speeds are similar for all components regardless of their
composition, indicating that settling most likely occurs in the form of a common package such as marine snow aggregates.
-20-Figure 1.2 Measured sediment flux at the former site of weather station Papa at 50*N, 145*W in the North Pacific. Numbers designate sequential samples over a period of 6 months in the shallow (1000 meters below the surface) trap and 18 months in the deep trap (3800 meters below the surface, water depth is 4200 meters). a) Total mass flux. b) Biogenic carbonate flux. c) Biogenic opal flux. d) Combustible material flux. Because of the sample composition, determination of the flux of lithogenic particles was not possible at this site.
Station Papa
13 15
14
2 35 3644 1
Jan Feb Mar Apr May Jun
1000 meters 18, Is 4 4 -5 24 25 7 26 27 28 29
Jul Aug Sep Oct Nov Dec
Jul Aug Sep
31800 meters
40
F
13 18
36
20 10 I 12 35
30 3l23 34 I
0 Jan Feb Mar Apr May Jun
1000 meters
24 4264 .
27 28
29
I I I I I
Jul Aug Sep Oct Nov Dec 3800 meters 90 80 70 60 50 13 30 3 32 3p 3612 3 4 5 25 26 27 28 29
Oct Nov Dec
13 15
38 35 364
Jan Feb Mar Apr May
1000 meters
i s 9 2 25 4 5 6 7 25 26 27 2 82 2
Jun Jul Aug Sep Oct Nov Dec
3800 meters 500 400
-300
> 300 250 200 150Jan Feb Mar Apr May Jun Jul Aug Sep
1000 meters 3800 meters
-.1
-22-Figure 1.3 Cross-correlations of the flux of a given particle type in shallow (1000m) vs. deep (3800m) traps at Station Papa in the North Pacific. Flux values (mg m-2day-') were first linearly interpolated to an even sampling interval (16 days). The shallow series, consisting of 12 samples, was correlated with the longer deep series which consisted of 36 samples. Only the central 27 correlation values are plotted (0±13) to eliminate edge effects. Correlations greater than 0.708 are significant at the 99% confidence level (N=12). a) Total mass flux. b) Biogenic
Total Mass Flux
Lags (interval Is 16 days) Lags (interval is 16 days)
Station Papa
Iv~
Biogenic Opal Flux
Station Papa Combustible FluxLags (interval is 16 days)
Carbonate Flux Station Papa
Station Papa
-24-The pattern in the Black Sea is different than at Station Papa in several respects due to the domination of the deep trap samples by deep lateral input (fig. 1.4). First, flux in the deeper (1200m) trap is generally higher than flux in the shallow (250m) trap for all
constituents. Second, the total flux vs. time signal is less systematic and less regular from year to year, especially in the deep trap.
Comparison of shallow and deep signals reveals that all flux peaks
occurring in the shallow trap are also observed in the deep trap, while the converse is not the case. For example, several of the carbonate peaks
(fig. 1.4b) and most of the biogenic silica peaks (fig. 1.4c) found in the deep trap samples are not found in the shallow samples. Any particles sinking directly from the surface must intercept both the shallow and deep traps. However, material which arrives in the deep trap but which is not sampled by the shallow trap must have been delivered as particles which were re-suspended (perhaps from the shelf and slope) and then delivered at depth to the central basin.
Lithogenic flux follows a pattern similar to that of carbonate and opal particles with the exception of a large peak in November/December in
the shallow trap. This flux was most likely produced by localized addition of concentrated suspended matter to the surface water; dispersal with
settling results in lower values in the deep trap in this sample.
Fluxes of combustible material are more similar in deep and shallow traps than fluxes of other components (fig. 1.4e). In this case, nearly all peaks observed in the deep trap are present in the shallow trap as well, indicating increased importance of direct vertical transport over
-25-Figure 1.4 Measured sediment flux at a site in the Black Sea. a) Total mass flux. Numbers designate sequential samples over a period of 12 months
in the shallow (250 meters below the surface) and 24 months in the deep trap (1200 meters below the surface, water depth is 2200 meters). Sampling interval is variable from 11 to 15 days. b) Biogenic carbonate flux. c) Biogenic opal flux. d) Lithogenic material flux. e) Combustible material flux.
Biogenic opal Flux (mg/'2/day) y n .. . . . .. . . . . .. . . . . . .. .. Lithogenic Flux (ag/a^2/day) -W~i fu 0 0 cm 0 0 o w o cmi o 0 Total mass Flux (arg/a Vday) o 0 a 0 0 o 0D 0 C I p . . . . . . .. .. . . ... .. ... . . .. .. .... .. ... . * Carbonate Flux (ag/m 2/day) 0 0 w o ru jh 0 CD 0 0 0 0D 0 0 U U
-9z~-Combustible Material Flux (mg/m2/day) u a, CD CD 8 -L Z-Ctcu
--28-deep lateral input. In places where flux peaks correspond in shallow and deep traps, the lag is either zero or one sampling interval (15 days). These trends are confirmed by cross-correlation of the shallow and deep trap records (fig. 1.5a-e). Correlation of biogenic opal and lithogenic are poor at lag one (0.03 and 0.21 respectively), indicating predominantly deep lateral input, while correlations of combustible and carbonate
material are good (0.64 and 0.44 respectively) indicating increasing dominance vertical settling.
Because of the deep input of re-suspended material, sinking speeds determined by the vertical offset/time lag method are less certain than those observed at Station Papa. Combustible flux correlates best at lag 1 while carbonate flux correlates equally well at lag zero or one (0.46 and 0.44 respectively). These lags result in sinking speeds of 63 m day~' for lag one (950 m/15 days) and an unknown but higher (>63 m day-') sinking speed for lag zero.
Flux Ratios
In addition to examining the correlations of the flux in shallow and deep traps, it is also useful to look at ratios of various components in the flux at a single depth. These ratios and the degree to which the fluxes of the components correlate help to indicate which components influence the total mass flux. Seasonal changes in the ratios are also expected as more or less of a given component is produced and settles into
the traps. Geographic variations in these ratios provide evidence of environmental factors influencing the sediment flux. In the three areas studied, these ratios reveal both seasonal changes and regional trends in
-29-Figure 1.5 Cross-correlation of the flux of a given particle type in shallow (250m) vs deep (1200m) traps the Black Sea. Flux values (mg m 2
day-') were first linearly interpolated to an even sampling interval (16 days). The shallow series, consisting of 24 samples, was correlated with the longer deep series which consisted of 36 samples. Only the
central 27 correlation values are plotted (0±13) to eliminate edge effects. Correlations greater than 0.515 are significant at the 99%
confidence level (N=24). a) Total mass flux. b) Biogenic carbonate flux. c) Biogenic opal flux. d) Lithogenic material flux. e) Combustible
Black Sea Total Mass Flux Black Sea Carbonate Flux
14
.2-Lags (interval is 15 days)
Black Sea Biogenic Opal Flux Black Sea Lithogenic Flux
.6-
.4-Lags (interval is 15 days) Lags (interval is 15 days)
Black Sea Combustible Flux
6 a
L l i 5
-32-Panama Basin. Flux ratios in the -32-Panama Basin samples reflect the large summer coccolithophorid bloom as well as the effect of deep lateral input (fig. 1.6). Although their total mass flux increases with depth, ratios of combustible or biogenic opal to total flux (percent/100) remain relatively constant with depth. In contrast, carbonate flux changes little or
decreases slightly with depth, while the percent of total flux decreases. In the case of lithogenic particles, both mass flux and percent of total flux increase with depth. All of the observed effects are due to dilution of the vertical flux of sediment particles by deep input of resuspended material. This material is low in carbonate, high in opal and combustible material, and very high in lithogenic particles (see chapter 2 of this
thesis). The resulting sediment flux reflects increasing amounts of this resuspended material in successively deeper traps.
If sedimentation of fine particles is by aggregates, then correlation of the flux of lithogenic particles to fluxes of other material should reveal which substances are controlling the flux. Table 1.2 lists values of correlation coefficients of lithogenic to other materials. The
strongest and most depthwise consistent correlation results from
correlation of lithogenic with combustible material (>0.91). This strong correlation indicates that the flux of lithogenic material will increase (or decrease) in proportion to the amount of settling organic material regardless of the the type or amount of biogenic mineral (carbonate or opal) associated with it. Although this ratio increases with depth due to additional input of lithogenic relative to combustible material in the resuspended particles, the seasonal constancy of the ratio at a given depth results in the good observed correlation.
-33-Figure 1.6 Ratio of the flux of a given particle type to the total mass flux in the Panama Basin. a) Ratio of carbonate material to total flux. b) Ratio of biogenic opal to total flux. c) Ratio of combustible material
Panama Basin
.151-2"
.051-Jan Feb Mar Apr May Jun Jul Aug Sep Oct Nov Dec
890 meters 18 14
12l
.06 .041I 2590 meters 3560 meters 0 JJan Feb Mar Apr May Jun Jul Aug Sep Oct Nov Dec
890 meters 2590 meters 3560 meters
.45 P.
.25
I-I
45
Jan Feb Mar Apr May Jun Jul Aug Sep Oct Nov Dec 3560 meters
S aI a a a a I I A u g a
Jan Feb Mar Apr May Jun Jul Aug Sep Oct Nov Dec
2590 meters 3560 meters
2590 meters 890 meters
-35-Table 1.2 Correlation coefficients for components of the observed flux with the lithogenic flux in the Panama Basin. At 890m and 2590m, N=4; at
3560m N=6. Results are given as slope of the best fit straight line / correlation coefficient.
890 meters 2590 meters 3560 meters
Lithogenic / Total Lithogenic / Carbonate Lithogenic
I
Combustible Lithogenic / Opal 0.018 / 0.87 0.018 / 0.87 0.83 / 0.91 -0.059 /-0.004 0.038 0.037 1.30 0.631
0.83/
0.77/
0.98 / 0.63 0.19 / 0.99 0.26 / 0.99 3.50 / 0.96 1.90 / 0.33 Depth
-36-Station Papa. Honjo (1985) described the seasonal cycle of physical and chemical changes which influence the production of biogenic material in the surface ocean at this site. Although further discussion of the causes of these cycles is beyond the scope of this paper, it is useful to examine the seasonal changes in the flux ratios as they reflect modes of
sedimentation. Without a reliable estimate of the flux of lithogenic material, however (see above), it is not possible to evaluate the sedimentation mechanisms of these small particles.
Examination of the ratios of combustible to opal or carbonate flux in the late summer production peak reveals that significant combustible
material settles which is not associated with either opal or carbonate (fig. 1.7a,b). Both minerals peak synchronously in sample 20 in the
shallow trap and 21 in the deep trap. In contrast, the flux of combustible material peaks later (sample 22) in the deep trap and has a broader flux peak in the shallow trap. This difference is exhibited as ratios of
combustible to opal and carbonate fluxes which are constant throughout the year except for the large peak in sample 22 in both the shallow and deep
traps. This combustible material is most likely the result of a salp population, the remains of which were found in sample 22 in both traps. The observation that this material arrives at both depths within the same sampling interval indicates that these gelatinous zooplankton remains
settle at more than 175 m day~'.
Black Sea While in some respects the Black Sea environment is similar to the Panama Basin (eg. proximity to a margin), the flux record is markedly
-37-Figure 1.7 Ratios of the flux combustible material to the flux of biogenic minerals at Station Papa in the North Pacific. a) Ratio of combustible material to biogenic opal flux. b) Ratio of Combustible material to biogenic carbonate flux.
Station Papa
a a a I I I i I A a a Jan Feb Mar Apr May Jun Jul Aug Sep Oct Nov Dec
30 45 25 26 27 a a L I I 6 7 29 28
Jan Feb Mar Apr May Jun Jul Aug Sep Oct Nov Dec
1000 meters 3800 meters 1.4|-32 335 35 33 10-i1 12 3800 meters I a I i I i I I 1225 3 264275?2 1000 meters
-39-different. Ratios of carbonate to total flux, for example, are highest in the summer in Panama and in the winter in the Black Sea. Further, while the ratio of a given constituent to total flux generally changes with depth in Panama, they remain constant over the two depths sampled in the Black Sea (fig. 1.8). This result is due to the enhanced preservation of
sediments in the Black Sea, leading to increased similarity of resuspended (deep lateral) and direct vertical flux.
As at station Papa, a large peak in combustible flux occurs in the summer which is not associated with either opal or carbonate. This is again reflected in the total combustible flux as well as the ratio of
combustible to either opal (fig. 1.9a) or carbonate (fig. 1.9b) material. The ratio of lithogenic to combustible flux (fig. 1.9c) reaches a minimum during the period of high combustible flux, indicating that little
lithogenic material is transported with this combustible matter. In contrast, the ratio of lithogenic to opal flux is relatively constant throughout the year except for the peaks in samples 26 (shallow) and 27 (deep). This good correlation of opal and lithogenic flux from
January to October is due to resuspension and lateral input of both. In the early winter (November and December), lithogenic material is delivered directly to the surface water and sinks independent of the opal.
The overall picture which emerges for the Black Sea is one in which deep lateral input generally dominates direct vertical settling. Only the flux of combustible material (and to a limited extent carbonate) reflects the expected cycles of production and subsequent sedimentation of biogenic matter in both traps. For these particle types, most flux peaks appear in
-40-Figure 1.8 Ratio of the flux of a given particle type to the total mass flux in the Black Sea. a) Ratio of carbonate material to total flux. b) Ratio of biogenic opal to total flux. c) Ratio of combustible material to total flux. d) Ratio of lithogenic material to total flux.
Coabustibie Materia/Tota Fux Rti Total Flux Ratio !U W .b U~ 02 £
>1''~
U S ~ U a U Lithogenic Material/Total Flux Ratio S i ia h. L" 06 -j B CD Lt Blogenhc Lpal/Total Flux Ratio CD 0 Cii -T 17-Carbonate/TotaJ Flux Ratio
-42-Figure 1.9 Ratio of the fluxes of several particle types in the Black Sea. a) Ratio of combustible material to biogenic opal. b) Ratio of combustible material to biogenic carbonate. c) Ratio of lithogenic material to combustible material.
CoabuStiblelBojgflJc Opal Flux RatIO 0 Ln' 0 U LithogefliC/conbustible Flux Ratio 0D ru wa a, 0I 1 N ... .. .. a CD 5 w Coabustibie/CobOlatt Flux Rstio NN 'm 40 C--ok . . . . . .
-44-both traps, indicating vertical settling with blooms of coccolithophorids occurring in November and December. However, in both cases and especially for carbonate particles, several events occur in which the flux is greater in the deep trap, indicating the input of laterally advected particles. The flux of opal increases in the spring and summer in both traps due to vertical settling of diatoms. However, much larger flux values are observed many months later in the deep trap due to lateral input of
resuspended opal. These resuspension events influence the flux signal in the shallow trap, but completely dominate the signal in the deep trap.
The Black Sea samples are composed of between 15% and 72% lithogenic particles due to the proximity of the station to the continental shelf and
to the extremely steep continental slope (7* to 18* at this site). In a typical open oceanic environment, only a small and constant number of lithogenic particles are available for incorporation into settling aggregates (Deuser, 1981, 1983). In this situation, lithogenic flux is controlled by the availability of settling aggregates which can incorporate the lithogenics and transport them to the sea floor. In contrast, in the Black Sea the flux of lithogenic particles is controlled by their supply
(resuspension and river input) rather than the availability of settling aggregates.
-45-CONCLUSIONS
Time series sediment trap samples can be used to determine particle flux pathways as depicted in figure 10. Flux peaks appearing in both shallow and deep signals with similar amplitudes or with slightly
diminished amplitude in the deeper traps, indicate predominantly vertical settling as in the case of Station Papa. Peaks appearing only in the deep trap indicate lateral input, as observed for opal and most lithogenic flux in the Black Sea. In cases such as the Panama Basin, where peaks occur in both shallow and deep samples but with higher amplitudes in the deep trap, a mixture of vertical and lateral inputs is indicated.
Evidence from time series sediment trap samples supports the concept of rapid settling of fine particles by aggregates. The sinking speeds resulting from this method are considerably higher than those predicted for settling of individual particles. Where available, data for lithogenic materials indicates that these fine particles in particular are settling at a greatly enhanced rate.
Sediment trap data also indicate that, not only do most particles settle quickly and at similar speeds, but the fluxes of the individual particle types also correlate well with fluxes of all other particles. Settling in the form of aggregates is again indicated, as these packages collect suspended particles and transport them to the abyss. Organic matter associated with aggregates appears to be the major controlling
factor in the sedimentation of other material, since the flux of
combustible material corresponds most closely in shallow and deep traps and also correlates best with the flux of fine particles.
-46-Figure 1.10 Diagram of the three types of flux signals identified in this review. a) Vertical settling, where the peak in the flux signal observed in the shallow trap also occurs in the deep trap with equal or diminished amplitude. b) Lateral transport, where the flux peak observed in the deep trap does not occur in the shallow signal. c) Combination of vertical settling and lateral input, where flux peaks occur in both shallow and deep traps but with higher amplitude in the deep trap.
-47-Time
-
deep
shallow
B
Time
deep
shallow
Time
Combination
(Panama Basin)
Vertical Settling
(Station Papa)
Lateral Transport
(Black Sea)
-48-In areas such as the Black Sea or the Panama Basin where deep lateral input is important, sediment traps can provide information relating to the timing and nature of these deep inputs. In the Panama Basin, deep input is constant throughout the year and, while it influences the total flux
signal, vertical input is dominant. At the station in the Black Sea, however, this deep input varies considerably throughout the year and often overwhelms and obscures the direct vertical input.
-49-REFERENCES
Deuser, W.G., (1974) Evolution of anoxic conditions in the Black Sea during Holocene. in The Black Sea-geology, chemistry and biology A.A.P.G. Memoir 20, Tulsa Ok.
Deuser, W.G., P.G. Brewer, T.D. Jickells and R.F. Commeau (1983)
Biological control of the removal of abiogenic particles from the surface ocean. Science vol. 219, 388-391.
Deuser, W.G., E.H. Ross and R.F. Anderson (1981) Seasonality in the
supply of sediment to the deep Sargasso Sea and implications for the rapid transfer of matter to the deep ocean. Deep-Sea Res. vol. 28A(5), 495-505.
Honjo, S. (1982) Seasonality and interaction of biogenic and lithogenic particulate flux at the Panama Basin. Science vol. 218, 883-884.
Honjo, S. (1985) Study of ocean fluxes in time and space by
bottom-tethered sediment trap arrays: a recommendation. in Global ocean flux study; proceedings of a workshop, National Academy Press, Washington, D.C., 306-324.
Honjo, S., K.W. Doherty, Y.C. Agrawal and V.L. Asper (1984) Direct optical assessment of large amorphous aggregates (marine snow) in the deep ocean. Deep-Sea Res. vol. 31(1), 67-76.
-50-Honjo, S., S.J. Manganini, and L.J. Poppe (1982a) Sedimentation of
lithogenic particles in the deep ocean. Mar. Geol. vol. 50, 199-220.
Honjo, S., S.J. Manganini, and J.J. Cole (1982b) Sedimentation of biogenic matter in the deep ocean. Deep-Sea Res. vol. 29(9A), 609-625.
Pilskaln, C.H., (1985) The fecal pellet fraction of oceanic particle flux, unpublished Ph.D. thesis at Harvard University, Cambridge, MA.
Smayda, T.J., (1971) Normal and accelerated sinking of phytoplankton in the sea. Mar. Geol. vol. 11, 105-122.
Takahashi, K.,(1985) Seasonal biogenic silica flux in the subarctic Pacific, Geol. Soc. Amer., Abstracts with Programs, 17(7), 732.
-51-Chapter 2
THE DISTRIBUTION AND TRANSPORT OF MARINE SNOW AGGREGATES IN THE PANAMA BASIN AND NORTHEAST ATLANTIC OCEAN