HAL Id: hal-02462978
https://hal.archives-ouvertes.fr/hal-02462978
Submitted on 31 Jan 2020
HAL is a multi-disciplinary open access
archive for the deposit and dissemination of
sci-entific research documents, whether they are
pub-lished or not. The documents may come from
teaching and research institutions in France or
abroad, or from public or private research centers.
L’archive ouverte pluridisciplinaire HAL, est
destinée au dépôt et à la diffusion de documents
scientifiques de niveau recherche, publiés ou non,
émanant des établissements d’enseignement et de
recherche français ou étrangers, des laboratoires
publics ou privés.
nanostructures driven by complementary artificial
proteins
Maxence Fernandez, Agathe Urvoas, Pascale Even-Hernandez, Agnès Burel,
Cristelle Meriadec, Franck Artzner, Tahar Bouceba, Philippe Minard, Erik
Dujardin, Valérie Marchi
To cite this version:
Maxence Fernandez, Agathe Urvoas, Pascale Even-Hernandez, Agnès Burel, Cristelle Meriadec,
et al..
Hybrid gold nanoparticle-quantum dot self-assembled nanostructures driven by
comple-mentary artificial proteins.
Nanoscale, Royal Society of Chemistry, 2020, 12 (7), pp.4612-4621.
Nanoscale
rsc.li/nanoscaleISSN 2040-3372 PAPER Shuping Xu, Chongyang Liang et al. Organelle-targeting surface-enhanced Raman scattering (SERS) nanosensors for subcellular pH sensing
Volume 10 Number 4 28 January 2018 Pages 1549-2172
Nanoscale
This is an Accepted Manuscript, which has been through the
Royal Society of Chemistry peer review process and has been
accepted for publication.
Accepted Manuscripts are published online shortly after acceptance,
before technical editing, formatting and proof reading. Using this free
service, authors can make their results available to the community, in
citable form, before we publish the edited article. We will replace this
Accepted Manuscript with the edited and formatted Advance Article as
soon as it is available.
You can find more information about Accepted Manuscripts in the
Information for Authors
.
Please note that technical editing may introduce minor changes to the
text and/or graphics, which may alter content. The journal’s standard
Terms & Conditions
and the
Ethical guidelines
still apply. In no event
shall the Royal Society of Chemistry be held responsible for any errors
or omissions in this Accepted Manuscript or any consequences arising
from the use of any information it contains.
Accepted Manuscript
This article can be cited before page numbers have been issued, to do this please use: M. Fernandez, A. Urvoas, P. Even-Hernandez, A. Burel, C. Meriadec, F. Artzner, T. Bouceba, P. Minard, E. Dujardin and V. Marchi, Nanoscale, 2020, DOI: 10.1039/C9NR09987E.
ARTICLE
Received 00th January 20xx, Accepted 00th January 20xx DOI: 10.1039/x0xx00000x
Hybrid gold nanoparticle-quantum dot self-assembled
nanostructures driven by complementary artificial proteins
Maxence Fernandez,a Agathe Urvoas,b Pascale Even-Hernandez,a Agnès Burel,c Cristelle Mériadec,d Franck Artzner d Tahar
Bouceba,e Philippe Minard,b* Erik Dujardinf and Valérie Marchia*
Hybrid nanostructures are constructed by the direct coupling of fluorescent quantum dots and plasmonic gold nanoparticles. The self-assembly is directed by the strong affinity between two artificial α-Repeat proteins that are introduced in the capping layers of the nanoparticles at a controlled surface density. The proteins have been engineered to exhibit a high mutual affinity, corresponding to a dissociation constant in the nanomolar range, which is conferred to the protein-functionalized quantum dots and gold nanoparticles. Protein-mediated self-assembly is evidenced by Surface Plasmon Resonance and gel electrophoresis. The size and the structure of colloidal superstructures of complementary nanoparticles is analyzed by transmission electronic microscopy and small angle X-ray scattering. The size of the superstructures is determined by the number of proteins per nanoparticle. The well-defined geometry of the rigid protein complex sets a highly uniform interparticle distance of 8 nm that affects the emission properties of the quantum dots in the hybrid ensembles. Our results open the route to the design of hybrid emitter-plasmon colloidal assemblies with controlled near-field coupling and better optical response.
Introduction
Tailoring the properties of light down to the nanometer scale has recently benefited from two major advances: the engineering of collective oscillations of free electrons in noble metals, surface plasmons, and the quantum confinement of noble metals and semiconductors leading to robust and efficient fluorophores. Efforts to couple the field enhancement and confinement near metal nanoparticles and the highly designable fluorescence of quantum dots (QD) within hybrid nanostructures has opened new horizons for nanophotonics1,2 with promising applications in biomedical diagnosis (imaging, sensing)3,4 and therapy (optical hyperthermia),5,6 energy saving (reduced heat production in electronic chips)7 and green production (enhanced photovoltaics).8 However, the way leading to these objectives is still facing two major challenges: the preparation of optically activated metallic and semiconductor nanoparticles (NP) of controlled size,
crystallinity and morphology and their organization into 2D and 3D higher-order architectures of well-controlled topology for functional devices.
The optoelectronic properties of these self-assembled hybrid QD-metal nanoparticle structures derive from a range of near-field mechanisms including energy Transfer (e.g. Fluorescence resonance Energy Transfer, FRET) and field enhancement (e.g. Surface-Enhanced Raman Scattering SERS and Metal-Enhanced Fluorescence MEF) that are directly affected by structural and electrostatic parameters of the self-assembly such as interparticle Coulomb interactions, dielectric constant of the material, topology and morphology of the assembly and its constituents. Among these parameters, the interparticle distance has a tremendous effect on the optical coupling of QD with neighbouring nanoparticles within higher-order self-assembled architectures. In particular, the photoluminescence intensity of the QD is enhanced,9 diminished10 or shifted9 due to the exciton coupling between identical proximal QD or channelled towards other QD if the emission band of one type overlap the absorption band of the other.11 When QD are coupled to metal plasmonic nanoparticles, the exciton-plasmon coupling strongly depends on the interparticle distance in the NP nanostructures and the energy overlap between plasmon and exciton bands.9,12,13 The QD photoluminescence intensity can be either enhanced or attenuated due to the competition between non radiative energy transfer to plasmonic NP and the local electric field enhancement. 2,12,13 QD—metal hybrid nanostructures have been prepared using DNA strands13,14, antibodies15 and proteins such as BSA16,17 or streptavidin15,18–20 which offer new opportunities to tailor the interparticle distance or self-assembly structure.
a.University Rennes 1, Institut of Chemical Sciences, UMR 6226 CNRS, Campus
Beaulieu, F-35042 Rennes, France.
b.Institute for Integrative Biology of the Cell (I2BC), CEA, CNRS, Univ. Paris-Sud,
Université Paris-Saclay, 91198 Gif-sur-Yvette Cedex, France.
c. University Rennes 1, Microscopy Rennes Imaging Center, UMS3480 BIOSIT,
Campus Villejean, Rennes, France.
d.University Rennes 1, Institut de Physique de Rennes, UMR 6251 CNRS, Campus
Beaulieu, F-35042 Rennes, France.
e.Sorbonne Université, CNRS, Institut de Biologie Paris-Seine (IBPS), Protein
engineering platform, Molecular Interaction service, F-75005 Paris, France.
f. Groupe NanoSciences-CEMES, CNRS UPR 8011, 29 rue J. Marvig, B.P. 94347,
F-31055 Toulouse, France.
Electronic Supplementary Information (ESI) available: See DOI: 10.1039/x0xx00000x
Nanoscale
Accepted
Manuscript
Published on 31 January 2020. Downloaded by Bibliotheque de L’Universite de Rennes I on 1/31/2020 2:30:01 PM.
View Article Online
In this article, we induce the specific assembly by using one representative of highly specific artificial protein pairs that is created by choosing one specific protein and selecting the pair-forming partner by directed evolution.21, 22 The family of artificial repeat proteins named Reps are efficiently produced as recombinant proteins with a very stable folded structure and can be easily tailored to be grafted onto metallic surfaces using metal-binding cysteine tags. Furthermore, a very large library of
Reps with a variable surface was built and allows to identify using directed evolution methods21,22 new proteins binding tightly and specifically to any protein target of interest.23 A specific pair of Reps named A3 / α2 obtainedpreviously was chosen here for its small and compact complex prone to generate 3-10 nm interparticle gaps and for its facile grafting onto metallic as well as semiconductor surfaces in order to drive the QD-QD and QD-metallic gold nanoparticle (AuNP) self-organization. We have recently demonstrated the principle of colloidal self-assembly driven by pairs of α-Rep proteins for homogeneous ensembles of protein-capped gold nanoparticles (AuNP).24 On another hand, we have shown how to prepare stable bioactivated QD with high affinity hydrophilic ligands, 25 that we are transposing here to the A3 and α2 proteins. Each complementary protein is tagged with a tri-cysteine tag motif at their C-terminal end and prepared at the milligram scale from small scale E. coli bacterial cultures.21 Next, the proteins are grafted onto peptide-stabilized CdSe@ZnS core-shell QD by ligand exchange. The efficiency of the protein grafting on the QD surface is demonstrated by the induction of self-assembly of complementary Rep protein-grafted QD driven by the A3-α2 protein affinity. Finally, our method is successfully applied to the self-assembly of hybrid QD-AuNP from mixtures of complementary Rep protein-grafted AuNP and QD. The extent and size of the superstructures depends on the molar ratio between the proteins and the nanoparticles used at the ligand exchange step. SAXS and TEM analysis of both QD and QD-AuNP self-assembled ensembles reveal a highly uniform interparticle distance which is a crucial step to reduce the inhomogeneous dispersion of the optical behaviour of the hybrid superstructures. Finally their optical properties suggest that the protein pairing affects the exciton or plasmon-exciton coupling within these nanostructures.
Experiment
Materials
Hydrogen tetrachloroaurate(III) trihydrate (HAuCl4) and tetramethylammonium hydroxide, 25% w/w aqueous solution (TMAOH) from Alfa Aesar; tri-sodium citrate dihydrate and chloroform from Carlo Erba Reagents; DL-Dithiothreitol, gold nanoparticles (10 nm diameter, OD 1, stabilized suspension in 0.1 mM PBS, reactant free), agarose, sodium phosphate monobasic (NaH2PO4), sodium chloride (NaCl) and sodium hydroxide (NaOH) from Sigma-Aldrich. Boric acid was purchased from Honeywell Fluka and Cys-Cys-Cys-11-aminoundecanoyl-15-amino-4,7,10,13-tetraoxapentadecanoyl from PolyPeptide Laboratories or Agentide Inc. Proteins were stored at -80 °C in
pH 7.4 phosphate buffer saline. Ultrapure Millipore water (18.2 MΩ) was used. Formvar/Carbon film 300 mesh nickel grids from Oxford Instruments. All glassware was washed with aqua regia and rinsed with ultrapure water and ethanol. UV/Vis spectroscopic measurements were carried out using a Cary-100 UV−vis NIR spectrophotometer instrument operated by Carry UV Win (Version 3.00) software. Emission spectra were recorded on a Fluorolog–3 fluorimeter (Horiba Jobin-Yvon) operated by FluorEssence (Version 2.0.9.0).
Peptide Grafting for the Stabilization of AuNP and QD Gold nanoparticles preparation
5 mL of 11 nM commercial suspension of 10 nm Au
nanoparticles or 16 nm homemade citrate-capped
nanoparticles25 were incubated with an aqueous solution of
Cys-Cys-Cys-11-aminoundecanoyl-15-amino-4,7,10,13-tetraoxapentadecanoyl (C5PEG4, 7 µL, 20 mM). The mixture was allowed to stand for 2 h and is then washed, filtered and concentrated using Amicon® Ultra – 0.5 mL 100K centrifugation filters and NaP 20 mM pH 7.4 buffer through multiple centrifugation cycles (3800 g, 2 min). Typically, 230 µL of 180 nM AuNP-peptide suspension were obtained.
Quantum dots preparation
The QD used in this study were commercial CdSe@ZnS core@shell nanoprisms (QdotTM 655 ITKTM organic quantum dots, Thermo Fisher Scientific) when no indication if given. Otherwise nanospheres (QdotTM 545 ITKTM Thermo Fisher Scientific) were also used for comparison. Water solubilization and stabilization of quantum dots was achieved according to a previously described method.26 First, 1 mL of 1 µM commercial suspension of red quantum dots in decane was first flocculated by centrifugation to transfer the nanocrystals from decane to chloroform. For this purpose, 1 mL of the quantum dots suspension was separated into 5 microtubes with 800 µL of 75/25 methanol/isopropanol mixture and was then centrifuged (660 g, 5 minutes). The solvent was removed and the flocculated nanocrystals were redispersed in 1 mL of chloroform. This organic suspension was mixed successively with 70 µL of 20 mM aqueous C5PEG4 solution and 12 µL of TMAOH at 25% (w/w) in water. These additions induced the transfer of the nanocrystals from the organic solvent to the aqueous phase. Chloroform was removed after 15 min incubation and the mixture was evaporated (60 mbar, 20 min, room temperature) to remove organic solvent traces. Peptide molecules in excess were removed by size exclusion chromatography using sephadex G-25 columns (NAP-5 from GE Healthcare) equilibrated and eluted with NaP 20 mM pH 7.4 buffer. The obtained aqueous suspension of QD featured a concentration in the range of 500 nM.
Protein Conjugation on AuNP and QD
First, cysteine-tagged αRep proteins were incubated at 12°C for 2 h in 100 mM DTT in order to reduce their intra and interprotein disulfide bonds. The excess DTT was removed by centrifugal elution through desalting column (Zeba Spin
Nanoscale
Accepted
Manuscript
Published on 31 January 2020. Downloaded by Bibliotheque de L’Universite de Rennes I on 1/31/2020 2:30:01 PM.
View Article Online
Journal Name
ARTICLE
This journal is © The Royal Society of Chemistry 20xx J. Name ., 2013, 00, 1 -3 | 3
Desalting Columns, 7K MWCO) with NaP 20 mM pH 7.4 buffer. Next, peptide-stabilized nanoparticles were functionalized by incubating them (overnight, 12°C) with 100 and 30 molar equivalents of proteins (α2 or A3) for QD and AuNP respectively. After incubation, the protein excess was removed by using an ultrafiltration unit Amicon® Ultra – 0.5 mL with a 30,000 molecular weight cutoff (MWCO) at 7200 rpm for 2 min and washing 5 times with NaP 20 mM pH 7.4 buffer. The purified QD-protein were finally redispersed in NaP 20 mM pH 7.4 buffer Agarose Gel Electrophoresis
Agarose gel electrophoresis was employed to monitor the charge and size variations for semiconductor and gold nanoparticles using a Gel XL Ultra V-2 (Labnet International, Inc., USA) horizontal electrophoresis system. The agarose gel was prepared dissolving agarose (500 mg) in borate 20 mM pH 8 buffer (100 mL) at 90°C. This solution was then poured into four 53 mm × 53 mm gel trays or two 130 mm × 59 mm trays within a gel caster. The gel was run in borate 20 mM pH 8 buffer for 20 to 45 minutes using a voltage of 9 V per 1 cm of gel and revealed with a UV light (365 nm).
A3/AuNP and A3/QD stoichiometry determination
The AuNP-A3 and QD-A3 were prepared and purified from the A3 protein excess according to the methods described above. The concentrations of Au NP and QD were then determined by
ICP-MS measurements. The A3/AuNP and A3/QD
stoichiometries were determined by fluorescence emission measurements after dissolving the inorganic core of the nanoparticles while preserving the proteins as follows. The dissolution of the AuNP nanoparticles, 32 µL AuNP-A3 (90 nM) was obtained by incubation with 16 µL saturated KCN during 1 hour. The dissolution of the QD-A3 was realized by incubation in acidic HCl solution during 12 hours according to the literature.27 Standard A3 solutions at different concentrations from a stock solution (concentration 37 µM) were prepared in Na Phosphate buffer (pH 7.4) and the fluorescent intensity v.s. concentration was measured. According to the standart curve, the A3 concentration was obtained by measuring the fluorescent intensities of the solution resulting from the AuNP-A3 or QD-AuNP-A3 dissolution.
Transmission Electron Microscopy (TEM)
The 300 mesh carbon coated nickel grids were placed for 1 min on top of a 40 µL sample droplet and dried up with paper. Examination was performed with JEOL 1400 transmission electron microscope operated at 120 kV supplied with GATAN Orius 1000 camera. Particle sizes and interparticle distances were determined from TEM micrographs using the ImageJ Software.
Surface Plasmon Resonance (SPR)
Binding experiments and kinetics assays were carried out at 25 °C using a BIACORE 3000 (GE Healthcare)of the Platform of Molecular Interactions of the Institute of Biology Paris Seine
(IBPS, Sorbonne University). αRep proteins and BSA were immobilized on CM5 sensor-chip (carboxymethylated dextran) through covalent amidation to the primary amine groups. For the immobilization step, the solutions of α2 and A3 (200 nM) and a solution of 50 µg.ml-1 of BSA, prepared in 10 mM sodium acetate buffer adjusted to a pH adapted to the pI of each protein (pH 5.0 for A3, pH 4.5 BSA and pH 5.5 for α-2), were injected at 10 mL.min-1. A contact time of 7 min was used to obtain high level of immobilization quantified as follows: 3,900 RU (Resonance Units), 11,600 RU and 1500 RU for A3 on flow cell two (FC2), BSA on FC3 and α2 on FC4 respectively. FC1 was left blank as a reference surface for non-specific binding and refractive index variations. This immobilization step was followed by the injection of 1 M ethanolamine HCl pH 8.4 to saturate the free residual amine groups. For binding experiments, a 2.3 nM solution of QD-α2 in HBS-EP Buffer (GE Healthcare, HEPES 10 mM pH 7.4, NaCl 150 mM, EDTA 3 mM, P20 0.005%) was flown over FC1 for blank, FC2 for A3, FC3 for BSA and FC4 for α2 at 5 µL.min-1 for 5 min. Kinetic
measurements were performed by injecting several
concentrations of α2 (between 0 and 2.4 nM) over the A3 surface at a flow rate of 5 µL.min-1 with a 5 min association phase and a 8 min dissociation phase corresponding to the injection of the buffer solution. After each assay, the sensor-chip was regenerated by performing one injection of Glycine-HCl buffer pH 1.5 at 30 µL.min-1 for 30 seconds or two injections of Glycine-HCl buffer pH 2.0 at 30 µL.min-1 for 30 seconds. All experiments were performed in triplicate.
Preparation of nanoparticles mixtures
For the preparation of QD•QD or hybrid QD•AuNP self-assembled nanostructures, suspensions of freshly prepared protein-QD or protein-AuNP conjugates were used at the same concentration: 96 nM for QD•AuNP or 100 nM for QD•QD. Mixtures of these complementary populations were prepared with a final volume of 12 µL for QD•AuNP or 30 µL for QD•QD, adjusting volumes of each suspension to obtain particle-α2:particle-A3 volume ratios of 5:1, 2:1, 1:1, 1:2, and 1:5. The same procedure was applied to the preparation of QD-α2/AuNP-α2 non-specific mixtures, QD-A3/AuNP-α2 mixture incubated with an excess of free α2 protein or free A3 protein (adding 100 molar equivalents) as a competition test. The mixtures were gently agitated before their incubation during 12 hours at 12°C. Finally an excess of free protein was added after this incubation on the QD•QD or hybrid QD•AuNP self-assembled nanostructures as a reversibility test.
Nanoparticles concentration determination
The concentrations of QD in suspensions were calculated as described by Jasieniak et al.,28 relying on the first absorption peak energy (E1S) in order to calculate the QD absorption coefficient
𝜀1𝑆 = 155 507 + 6.67054 × 10¹³ × 𝑒−𝐸1𝑆/0.10551. QD concentration was then determined by using the absorbance of the first absorption peak and its half-width-half-maximum, allowing a rescaling of the concentration from the
Nanoscale
Accepted
Manuscript
Published on 31 January 2020. Downloaded by Bibliotheque de L’Universite de Rennes I on 1/31/2020 2:30:01 PM.
View Article Online
nominal size distribution of the samples. The AuNP concentration was calculated from their absorption coefficient at 520 nm: 𝑙𝑛 𝜀𝜆𝐿𝑆𝑃 = 3.32111 × 𝑙𝑛 𝐷 + 10.80505 with D,
the core diameter of the gold nanoparticles measured by TEM, according to Liu et al.29
Small Angle X-Ray Scattering (SAXS)
Small Angle X-ray Scattering was collected with Pilatus 300k detector (dectris) mounted on home-made Guinier setup based on a CuKα microsource (λ = 1.541 Å) from Xenocs. The sample to detector distance (277 mm) has been calibrated by using silver behenate. The X-ray patterns were therefore recorded for a range of reciprocal spacing q = 4πsinθ/λ from 0.01-1.75 Å-1 where θ is the diffraction angle. The acquisition time was 1 hour. The scattering intensities as a function of the radial wave vector were determined by circular integration.10
Results and discussion
QD-protein and AuNP-protein dispersions are prepared by a ligand exchange process in the presence of a protein excess as shown in Fig. 1a. The morphological and optical properties of the CdSe@ZnS core@shell quantum dots and the gold nanoparticles are summarized in Fig. S1 and S2. The AuNP and QD have an average diameter of 8.0 ± 0.9 nm and 8.9 ± 1.4 nm respectively. Their colloidal stability is preserved in buffered medium at pH 7.4 using an optimized tricystein PEGylated ligand.26,30 The 8-nm diameter AuNP exhibit a localized surface plasmon resonance (LSPR) at 520 nm (black curve) and the QD exhibit an intense red emission band at 655 nm (red curve). Upon protein grafting, the fluorescence efficiency of the water-soluble QD-C5PEG4 is reduced by 35% but the emission at 655 nm does not undergo any spectral shift. The AuNP absorption band at 520 nm is fully preserved (Fig. 1c).
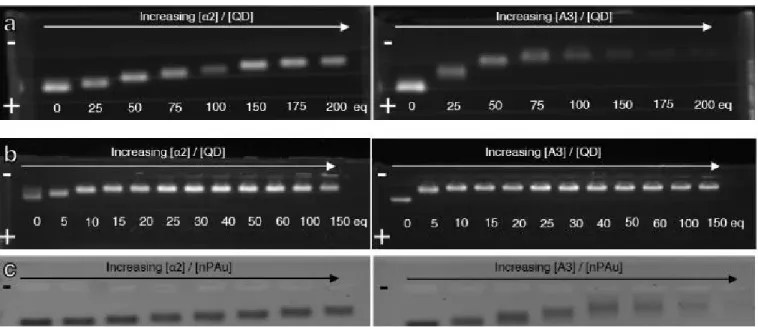
The titration of the QD-C5PEG4 with an increasing amount of protein has been monitored by agarose gel electrophoresis
(Fig. 2). The grafting of the proteins onto 9-nm or 2.5-nm QD and 8-nm AuNP is investigated through separate incubations with increasing amounts of proteins that are then compared after a 20 min migration time.31 The migration towards the positively charged electrode indicates that the net charge of peptide-stabilized as well as protein-grafted nanoparticles is negative. Interestingly, as proteins are gradually introduced into the peptide capping layer, the electrophoretic migration distance becomes shorter, which is consistent with the increase of the overall size of the functionalized particle and the reduction of the net negative charge at pH 8 since the proteins have a pI of 5.43 (A3), 7.07 (α2) while it is 4.7 for the peptide (C5PEG4). Moreover, the progressive decrease in migration distance reaches a plateau that can be related to the saturation of the surface with a maximal number of αRep proteins onto the nanoparticle surface leading to a maximal size and minimal
net negative charge. In the case of α2 (Fig. 2, left panels), the
Fig. 1 (a) Schematic representation of the protein grafting by ligand exchange at the
surface of the QD-C5PEG4. (b) Fluorescence emission spectra of peptide-stabilized QD and protein-grafted QD in PBS buffer for a 16 nM total QD concentration (excitation wavelength is 350 nm). (c) Normalized UV−visible spectra of the citrate-stabilized AuNP in water, peptide-stabilized AuNP and protein-grafted AuNP in PBS buffer.
Fig. 2 Agarose gel electrophoresis of peptide-stabilized (a) 9-nm QD655, (b) 2.5-nm QD545 and (c) 8-nm AuNP incubated with increasing amounts of α2 (left) or A3 (right). The buffer used is at pH 8.
Nanoscale
Accepted
Manuscript
Published on 31 January 2020. Downloaded by Bibliotheque de L’Universite de Rennes I on 1/31/2020 2:30:01 PM.
View Article Online
Journal Name
ARTICLE
This journal is © The Royal Society of Chemistry 20xx J. Name ., 2013, 00, 1 -3 | 5
migration distances are shorter than the corresponding ones for A3, which is attributed to the smaller size and net charge at pH 8 compared to A3.24 Additionally, A3-grafted nanoparticles tend to form short trails in the agarose gel. This can be attributed to the propensity of A3 to dimerize at high concentrations,21,24 which favors interparticle interaction within the highly concentrated spot of particles deposited on the gel but can also alter the effective protein/particle stoichiometry if one grafted A3 dimerizes with one free A3.
NP 𝑨𝑵𝑷(𝒏𝒎𝟐) 𝑵 ∝𝟐 𝒔𝒂𝒕 𝑵 𝑨𝟑 𝒔𝒂𝒕 𝑨 ∝𝟐 𝑵𝑷(𝒏𝒎𝟐) 𝑨 𝑨𝟑 𝑵𝑷(𝒏𝒎𝟐) 8.9 nm QD 475 ≥ 200 ± 13 100 ± 13 ≥ 2.4 ± 0.2 4.8 ± 0.6 2.5 nm QD 38 15 ± 3 10 ± 3 2.5 ± 0.4 3.8 ± 0.9 8 nm AuNP 384 ≥ 200 ± 13 75 ± 13 ≥ 1.9 ± 0.2 5.1 ± 0.7
As summed up in Table 1, the maximal number of protein grafted on the NP surface scales with the surface area of the nanoparticles, 𝐴𝑁𝑃.
The proteins can be as approximated to two blocks of respectively (2.8×2.4×4.3 nm3) size for α2 and of (3×3×6 nm3) size for A3. As expected from their relative sizes, the corresponding area of each grafted protein, denoted 𝐴prot 𝑁𝑃 , decreases with the size of the protein. The area of one grafted A3 protein is found to be around 4 to 5 nm² which is significantly smaller than the expected A3 size (min area of 9 nm²) and therefore is hardly compatible with a compact monolayer of A3 proteins. This observation suggests that the surface binding creates an effective high local concentration of A3 leading to the formation of a double layer of A3 as this protein is known to form A3•A3 dimers when concentrated. This does not prevent the subsequent A3•α2 pairing as the latter complex is much more stable.23To get a more quantitative evaluation of the protein/particle stoichiometry, the amount of bound proteins was titrated after dissolution of the inorganic core of the NP-protein conjugates while preserving the NP-proteins by using the intrinsic fluorescence intensity of the A3 protein. In the case of A3 protein, AuNP-A3 conjugates and QD-A3 were first thoroughly cleaned of excess of free A3 proteins by multiple filtrations. The concentrations of Au NP was first determined by inductively coupled plasma mass spectroscopy (ICP-MS). According to Dyer et al. the gold core of the purified AuNP-A3 was then dissolved in 3.7 M KCN, releasing the A3 proteins. The concentration of A3 proteins initially bound to the AuNP was determined by fluorescence spectroscopy (Fig. S3). We found that A3-saturated AuNP, prepared with 100 molar equivalents of A3, contain an average of 80 A3 per AuNP (see Figure S3), which is in good agreement with the migration saturation estimate (Table 1). In the case of QD-A3, the CdSe@ZnS core shell QD were dissolved in presence of an acidic HCl solution according to Debayle et al. The QD-A3 prepared from 100 molar equivalents of A3 were found to contain an average of 20 A3 per QD. This latter observation is in agreement with a smaller
affinity of the A3 protein for QD surface than for Au surface (see Figure S4). Unfortunately, this method cannot be applied to α2 since its intrinsic fluorescence emission is too low to assess the concentration of α2 protein after NP dissolution.
To further assess to the specific binding between QD-grafted proteins and complementary proteins, A3 proteins are immobilized on Surface Plasmon Resonance (SPR) sensor chips and subjected first to a high flux of QD-α2 and then to an influx of pure buffer. The SPR sensorgrams are shown in Fig. 3a. A strong positive association phase is observed in the case of the A3 coated surface. When the nanoparticles bound to the A3-coated surface are washed, a reduction of the SPR response is observed indicating that dissociation occurs leading to a new equilibrium state. No association is observed during control experiments performed either by immobilizing the identical α2 protein or Bovine Serum Albumine (BSA). These observations demonstrate the ability of QD-α2 to specifically bind to A3
protein coated surface. To estimate the affinity constant KD, the same experiment is performed with different QD-α2 concentrations as shown in Fig. 3b. The data are fitted with a 1:1 single exponential interaction model (Fig. 3b, black lines) in both association and dissociations phases, suggesting a single binding mechanism of QD-α2 + A3 = QD-α2•A3. The dissociation constant was extracted from three different approaches
Table 1 Summary of geometrical data about the NP-protein: 𝐴𝑁𝑃 designs the area of the
NP considered as a cube, 𝑁α2 𝑠𝑎𝑡 corresponds to the maximal number of protein grafted
on the NP surface extracted from the electrophoresis gel when the plateau is reached. 𝐴prot 𝑁𝑃 = 𝐴𝑁𝑃/𝑁
prot 𝑠𝑎𝑡 is the corresponding area for one grafted protein.
Fig. 3 QD-α2 affinity for A3 coated surface. (a) SPR sensorgrams during association
and dissociation phases monitoring the interactions between QD-α2 nanoparticles (2.3 nM) and immobilized protein surfaces: A3 (green curve), bovine serum albumin (blue curve), α2 (pink curve) and a bare surface (red curve). (b) SPR sensorgrams during association and dissociation phases monitoring the interactions between A3 immobilized surface and QD-α2 nanoparticles at different concentrations:0 nM; 0.4 nM; 0.8 nM; 1.2 nM; 1.6 nM; 2.0 nM and 2.4 nM (from bottom to top). Solid black lines are exponential fits to the association and dissociation phases.
Nanoscale
Accepted
Manuscript
Published on 31 January 2020. Downloaded by Bibliotheque de L’Universite de Rennes I on 1/31/2020 2:30:01 PM.
View Article Online
detailed in experimental part and supplementary section (Fig. S5). All the quantitative analysis consistently yield to 5 nM dissociation constant similar to the one measured by ITC in free α2/A3 proteins pairs.22
The protein pair affinity is high enough to drive the self-assembly of protein-grafted QD when suspensions of QD-α2 and QD-A3 are incubated together. The electrophoretic migrations of the complementary mixtures of α2 and QD-A3 (Fig. 4a, tracks iii-vii) are monotonously intermediate between those of pure protein-grafted QD (Fig. 4a, tracks ii and viii) as the molar ratio between the two populations is varied. The migration distances was found to directly depend on the composition of the mixture. A brighter spot was seen on the same side of the excess partner (top side for track iii and iv where A3 is in excess; bottom side for tracks vii where QD-α2 is in excess) superimposed with a broader central trail which dominates tracks v and vi. The intermediate migrations observed for the complementary QD mixtures indicate a specific interaction that cannot be accounted for by simple superposition of non-interactive mixtures of the native suspensions. Zeta potential measurements confirm that the protein grafting results in a decrease of the net surface charge for the NP in agreement with the isoelectric points of the proteins (Table S1). The zeta potential of the complementary
QD mixtures cannot be extracted due to the increased polydispersity of the mixtures. Indeed TEM observations reveal the formation of spatially limited assemblies giving oligomers of nanoparticles that cannot be found in the original α2 or QD-A3 populations (Fig. 4). The effect of the larger effective size of the complementary QDs appears to be screen by the intermediate net charge which acts as the dominant factor maybe because the electrophoresis is performed with low agarose pourcentage gel. The statistical analysis of the number of QD per oligomers reveals a distribution of limited-sized oligomers with 2 to 30 QD per oligomers (see Figure 4a) in agreement with the relative low charge of bound A3 protein at the surface of the QD (20 protein/QD) estimated from fluorescence titration (See Figure S6). These observations
confirm that the specific interaction between the
complementary QD results in new superstructures with intermediate net charge and larger effective size that can be maximized for QD-A3 : QD-α2 molar ratios around 1:1 to 1:2.33 Small Angle X-ray Scattering (SAXS) experiments were performed to get more quantitative structural information on the QD self-assemblies and are summarized in Fig. 5. Pure QD-A3 and pure QD-α2 suspensions produce a similar featureless SAXS pattern (Fig. 5a, black curve). On the contrary, the data of the equimolar QD-A3 / QD-α2 mixture exhibit a marked peak at
Fig. 4 (a) Fluorescence image of the agarose gel electrophoresis of pure QD-C5PEG4, QD-A3, mixtures of QD-A3 and QD-α2 at 5:1, 2:1, 1:1, 1:2 and 1:5 molar ratios respectively and
QD-α2 in tracks i—vii respectively. TEM images of (b) pure QD-A3, (c) pure QD-α2, (d) 1:1 QD-α2 + QD-A3 mixture and (e) 1:5 QD-α2 + QD-A3 mixture. Scale bars represent 100 nm.
Nanoscale
Accepted
Manuscript
Published on 31 January 2020. Downloaded by Bibliotheque de L’Universite de Rennes I on 1/31/2020 2:30:01 PM.
View Article Online
Journal Name
ARTICLE
This journal is © The Royal Society of Chemistry 20xx J. Name ., 2013, 00, 1 -3 | 7
q = 0,038 Å-1 (Fig. 5a, blue curve). After baseline subtraction, this broad scattering is well fitted by a Gaussian function centered at q0 = 0.0364 Å-1 (Fig. 5a, inset). In the Debye-Scherrer theory,
this feature is characteristic of a small crystal with a center-to-center particle interdistance dRX = 17.2 nm. The full width of the peak q0 is 0.0180 Å-1 yields N = q0/q0 ~ 2 QD-proteins, which
suggests that this broad scattering originates in a pair correlation function between two QD and is attributed to the QD-A3•α2-QD elementary pair.31
Fig. 5(a) SAXS data of QD-A3 (black curve) showing characteristic self-assembly signal
when mixed with complementary QD-α2 (blue curve) and competition experiment run with an excess of free α2 protein (red curve). INSET: peaks of QD-A3/QD-α2 mixture and Gaussian fit (see text). (b) (left) Crystallographic data (a,b,c)20 and hydrodynamical diameter Dh of the A3-α2 protein complex; (right) Schematic view of the complementary QD arrangement including the QD diameter measured by TEM (dTEM) and the SAXS interdistance (dRX).
The QD diameter measured from TEM images is 8.9 ± 1.4 nm (Fig. S2b), hence dRX = 17.2 nm yields an interparticle distance of 8.3 ± 1.4 nm, that is in good agreement with the value of 7.6 ± 2.6 nm obtained directly from TEM (Fig. S7). This gap region between two adjacent QD matches precisely the expected size of the A3-α2 protein complex (Fig. 5b). Hence both TEM and SAXS data strongly support the formation of QD-QD self-assemblies driven by the protein pair complexation. Interestingly, when competition experiments are run by adding an excess of free α2 protein, the characteristic SAXS peak disappears (Fig. 5a, red curve), as expected from the entropic
advantage of free protein over particle-bound protein in the binding event.23,24
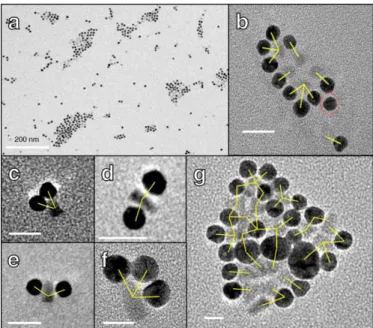
Beyond homogenous QD-QD or AuNP-AuNP assemblies, our approach allows to form hybrid self-assembled nanostructures that associate QD and AuNP with a precise control of the interparticle distance. Both protein-grafted QD and AuNP samples were prepared following the procedure described in Fig. 1. The surface density of proteins is adjusted by using 100 or 30 molar equivalents of proteins during the ligand exchange step. Several mixtures of QD-A3 and AuNP-α2 of different QD : AuNP molar ratio are produced with a fixed total nanoparticle concentration of 96 nM (see Experimental Methods). In Fig. 6, TEM images reveal the formation of protein-driven hybrid self-assembly where QD and AuNP coexist and systematically alternate. Indeed, assemblies of increasing dimensions are observed within the mixtures of complementary A3-grafted QD and α2-grafted AuNP according to the
nanoparticle:protein stoichiometry. Hybrid assemblies
obtained from QD and AuNP with protein-saturated coating features very large assemblies (Fig. 6a, Fig. S8 and S9) while mixtures produced from nanoparticles with more moderate surface density of proteins contains much smaller assemblies comprising a few tens of nanoparticles (Fig. 6b and 6g) down to trimers (Fig. 6c-e and Fig. S10). A closer examination shows that > 98% of QD and >90% of AuNP are engaged in a self-assembled pair (Table S2), which qualitatively illustrate the high efficiency of the protein affinity driving force in this self-assembly. Control experiments consisting of either mixture of QD-A3, AuNP-α2 and an excess of free α2 proteins (Fig. S11) or mixture of
non-complementary QD-α2 and AuNP-α2 (Fig. S12) present dispersed AuNP and QD with no significant association.
Fig. 6 TEM images of (a) large self-assemblies of QD-A3 and AuNP-α2 and (b-g) spatially
limited self-assemblies QD-A3 and AuNP-α2. Scale bar is 20 nm for B and D. Scale bar is 10 nm for C. Yellow bars represent QD-AuNP pairs that are possibly linked by protein pairs. Red dotted circle indicates AuNP with no obvious link to QD.
Nanoscale
Accepted
Manuscript
Published on 31 January 2020. Downloaded by Bibliotheque de L’Universite de Rennes I on 1/31/2020 2:30:01 PM.
View Article Online
Small Angle X-ray Scattering (SAXS) experiments performed on a (1:1) mixture of QD-A3 and AuNP-α2 suspensions with protein-saturated coating exhibit a characteristic peak at q = 0,0395 Å-1 (Fig. 7, blue curve). After baseline subtraction, this broad scattering is well fitted by a Lorentzian function centered at q0 = 0.0387 Å-1 (Fig. 7, inset). In the disordered
crystal theory of Guinier, the Lorentzian shape indicates a disorder of second kind in a crystal which is liquid-like. This corresponds to the aggregate observed by TEM. The mean center-to-center particle interdistance 𝑑𝑅𝑋𝑄𝐷−𝐴𝑢𝑁𝑃 = 16.2 nm. On the contrary pure QD-A3 (black curve) and AuNP-α2 (yellow curve) suspensions as well as the control competition (red curve) and reversibility (green curve) experiments on the equimolar QD-A3 / AuNP-α2 mixture produce featureless SAXS pattern (Fig.7). A surface-to-surface interdistance of 7.75 ± 1.15 nm nm is estimated from the QD-Au center-to-center interdistance 𝑑𝑅𝑋𝑄𝐷−𝐴𝑢𝑁𝑃 and the NP diameters (𝑑𝑇𝐸𝑀𝐴𝑢 = 8 𝑛𝑚 , 𝑑𝑇𝐸𝑀𝑄𝐷 = 8.9 𝑛𝑚 ) (see Figure 7). Additional SAXS experiments performed with different sized QD (See Figure S13) and the same AuNP reveal the same behaviour and confirm a very
well-defined interdistance. A surface-to-surface distance
respectively of 9 ± 1 𝑛𝑚 for 𝑄𝐷605 and 8.75 ± 1 𝑛𝑚 for 𝑄𝐷545 is estimated from the center-to-center distances obtained by SAXS for green and orange QD (see Figure S14). As in the case of QD-QD superstructures, this value around 8 nm is in the
range of the A3•2 proteins complex size.
Fig. 7 SAXS data of showing a characteristic self-assembly signal when QD-A3 and AuNP-α2 are mixed together (blue curve). INSET: peaks of QD-A3/AuNP-α2 mixture and Lorentzian fit (see text). Pure QD-A3 (black curve) and AuNP-α2 (yellow curve) as well as competition experiments run with an excess of free α2 protein (red curve) and reversibility control experiment performed through the addition of free α2 protein (green curve) show no sign of organization. Schematic view of the complementary QD/AuNP arrangement including QD and Au diameters measured by TEM and the center-to-center interdistance (𝑑𝑅𝑋𝑄𝐷−𝐴𝑢𝑁𝑃).
Both SAXS and TEM experiments confirm that complementary and available surface-tethered proteins are necessary to induce
the colloidal assembly. The mean surface-to-surface interdistance in the complementary mixtures found by SAXS is of 8 nm in agreement with the protein complex size.
In addition, the protein-driven assembly has a marked effect on the exciton-plasmon interaction inside the hybrid aggregates as illustrated in Fig. 8 and S15. When a suspension of QD-A3 is mixed with increasing amounts of non-complementary AuNP-A3 (Fig. 8, grey bars) a gradual decrease in intensity is observed that can be almost entirely ascribed to relative dilution and some A3 dimerization at high AuNP-A3 molar fraction. When the AuNP are functionalized with α2 (Fig. 8, red bars), specific complementary interactions induce a much larger quenching of the luminescence, which is essentially suppressed for an equimolar mixture, i.e. when all QD and AuNP are potentially engaged in hybrid superstructures. The sub-10 nm interparticle distance seems to favor the QD (donor) to AuNP (acceptor) energy transfer and non-radiative decay over metal-enhanced fluorescence.35,36 Interestingly, an effect due to a modification of the local dielectric constant in the self-assembled structure
can be disregarded by comparing the emission of QD-A3• 2-AuNP mixtures to the equivalently specific but plasmon-free QD-A3•2-QD case (Fig. 8, black circles). In the latter case, the luminescence decreases moderately as QD-2 are introduced and form larger aggregates but it remains higher than 70% of the intensity value for pure QD-A3 and it increased back as soon as the QD-2 is in excess. The reduction in QD fluorescence observed in the hybrid assembly can not be solely ascribed to the assembly process or the modification of the scattering properties by an effective increase in local dielectric constant but might be also related to the plasmon-mediated
non-Fig. 8 Histograms showing the evolution of the QD-A3 fluorescence (em = 655 nm) in the presence of AuNP in with non-specific (AuNP-A3, grey), specific (AuNP-2, red) or competitive (AuNP-2 and excess α2, blue) conditions. Black circle data show the QD-A3 fluorescence (em = 655 nm) in the presence of specific QD-2 using the same A3-α2 protein pair. Fluorescence intensities are normalized to the value for pure QD-A3 (0 Mol% of AuNP or QD-α2) by taking into account the dilution factor. The dashed line corresponds to the expected normalized fluorescence intensity for QD-A3 corrected
from the dilution.
Nanoscale
Accepted
Manuscript
Published on 31 January 2020. Downloaded by Bibliotheque de L’Universite de Rennes I on 1/31/2020 2:30:01 PM.
View Article Online
Journal Name
ARTICLE
This journal is © The Royal Society of Chemistry 20xx J. Name ., 2013, 00, 1 -3 | 9
radiative decay. Finally, when the protein-driven colloidal assembly is performed in the presence of a large excess of free
2, a competition is set for the 2•A3 protein pair. It is expected that the small 2 protein will preferentially bind to QD-A3 resulting in a mixture where QD-A3•2 coexist with AuNP-α2 with minimal interaction. The fluorescence of the mixture in competitive conditions (Fig. 8, blue bars) is indeed equal or higher than the fluorescence of the non-specific mixture. In particular, when the AuNP molar fraction is high, the binding of free 2 to form QD-A3•2 seems to further limit the non-specific binding (A3 dimerization), and the evolution of the luminescence is closer to the linear decrease expected for simple dilution. The evolution of the fluorescence for complementary interacting QD-A3 (with different emission wavelengths) and AuNP-α2 mixtures exhibits also a quenching as shown in Fig. S15. However, there is no simple correlation between the spectral overlap of the emission band and the plasmon band that would permit to discriminate the different contributions of the mechanisms (MET or FRET) involved in the observed coupling (see Figure S16).
Conclusion
To conclude, we have shown that high affinity pairs of artificial repeat proteins offer a unique platform to translate specific biomolecular interactions to functional colloidal self-assemblies. The main assets of our approach exploit (i) the very low (around 5 nM) dissociation constant, (ii) the pair specificity that makes it possible to develop, at will, orthogonal pairs for complex hybrid constructions and (iii) the rigid structure of the proteins and their complexes that enables a strategy towards topologically determined 3D assembly. In this work, we focus on creating and characterizing superstructures comprising protein-coated semi-conductor QD only and their plasmonic hybrid extension by coupling to gold nanoparticles. Using, gel electrophoresis and SPR measurements, we demonstrate a generic approach to graft any alpha-repeat protein on the surface of the quantum dots without altering the biorecognition. The self-assemblies have been structurally analysed by TEM and SAXS, which reveal that the surface-to-surface nanoparticle interdistance is set around 8 nm by the size of the protein pair. As the 3D structure of the A3•2 complex is known, one can modulate the interdistance between anchored nanoparticles and thus their optical coupling by extending the proteins with additional motifs without destabilizing the binding interface with 2. Given their modular nature and the geometry of the 2 helices arrangement, alphaRep proteins could be engineered, either by changing the number of motifs along a chosen protein, each motif resulting in an additional 1 nm distance. We also observe that the extent of the superstructures can be tuned by adjusting the surface density of grafted proteins. The higher protein : nanoparticle stoichiometry, the larger is the size of the resulting self-assembled superstructure. Conversely, QD-QD or hybrid QD-Au oligomers form when the nanoparticles carry a few bound proteins, giving access to model systems such as QD-Au-QD trimers37. Finally, the luminescence of the QD is quenched when
they are bound to Au nanoparticles through the A3•2 bridge. Hybrid superstructures with adjustable luminescent properties should be produced by tuning the spectral overlap between the excitonic and plasmonic resonances making our approach a versatile tool for biosensing applications.
Conflicts of interest
There are no conflicts to declare.
Acknowledgements
The Agence Nationale de la Recherche (ANR, contract N ° ANR-16-CE09-0027-02 HYPNAP and Contract N ° ANR-14-CE08-0004 ARTEMIS) funded this work. We are endebted to the Region Bretagne for the financial support of the MF’s phD fellowship.
Notes and references
1 S. Bidault, A. Devilez, V. Maillard, L. Lermusiaux, J.-M. Guigner, N. Bonod and J. Wenger, ACS Nano, 2016, 10, 4806–4815. 2 A. O. Govorov, G. W. Bryant, W. Zhang, T. Skeini, J. Lee, N. A.
Kotov, J. M. Slocik and R. R. Naik, Nano Lett., 2006, 6, 984– 994.
3 P. D. Howes, S. Rana and M. M. Stevens, Chem. Soc. Rev., 2014, 43, 3835–3853.
4 T. Sannomiya and J. Vörös, Trends Biotechnol., 2011, 29, 343– 351.
5 A. Klinkova, R. M. Choueiri and E. Kumacheva, Chem. Soc. Rev., 2014, 43, 3976–3991.
6 N. S. Thakur, G. Patel, V. Kushwah, S. Jain and U. C. Banerjee,
ACS Appl. Bio Mater., 2019, 2, 349–361.
7 J. Liu, J. Mantell, N. D. Bartolo and M. R. Jones, Small, 2019, 15, 1804267.
8 N. Zhou, V. López-Puente, Q. Wang, L. Polavarapu, I. Pastoriza-Santos and Q.-H. Xu, RSC Adv., 2015, 5, 29076–29097. 9 E. Henry, A. Dif, M. Schmutz, L. Legoff, F. Amblard, V.
Marchi-Artzner and F. Marchi-Artzner, Nano Lett., 2011, 11, 5443–5448. 10 T. Bizien, J.-C. Ameline, K. G. Yager, V. Marchi and F. Artzner,
Langmuir, 2015, 31, 12148–12154.
11 Z. Tang, N. A. Kotov and M. Giersig, Science, 2002, 297, 237. 12 G. C. des Francs, A. Bouhelier, E. Finot, J. C. Weeber, A.
Dereux, C. Girard and E. Dujardin, Opt. Express, 2008, 16, 17654–17666.
13 D. Sun, Y. Tian, Y. Zhang, Z. Xu, M. Y. Sfeir, M. Cotlet and O. Gang, ACS Nano, 2015, 9, 5657–5665.
14 W.-W. Zhao, P.-P. Yu, Y. Shan, J. Wang, J.-J. Xu and H.-Y. Chen,
Anal. Chem., 2012, 84, 5892–5897.
15 J. M. Slocik, A. O. Govorov and R. R. Naik, Supramol. Chem., 2006, 18, 415–421.
16 K. K. Haldar, T. Sen and A. Patra, J. Phys. Chem. C, 2010, 114, 4869–4874.
17 G. Mandal, M. Bardhan and T. Ganguly, J. Phys. Chem. C, 2011, 115, 20840–20848.
18 Y. Fu, J. Zhang and J. R. Lakowicz, Chem. Commun., 2009, 313– 315.
19 J. Lee, T. Javed, T. Skeini, A. O. Govorov, G. W. Bryant and N. A. Kotov, Angew. Chem. Int. Ed., 2006, 45, 4819–4823. 20 E. Oh, M.-Y. Hong, D. Lee, S.-H. Nam, H. C. Yoon and H.-S. Kim,
J. Am. Chem. Soc., 2005, 127, 3270–3271.
21 A. Urvoas, A. Guellouz, M. Valerio-Lepiniec, M. Graille, D. Durand, D. C. Desravines, H. van Tilbeurgh, M. Desmadril and P. Minard, J. Mol. Biol., 2010, 404, 307–327.
Nanoscale
Accepted
Manuscript
Published on 31 January 2020. Downloaded by Bibliotheque de L’Universite de Rennes I on 1/31/2020 2:30:01 PM.
View Article Online
22 A. Urvoas, M. Valerio-Lepiniec and P. Minard, Trends
Biotechnol., 2012, 30, 512–520.
23 A. Guellouz, M. Valerio-Lepiniec, A. Urvoas, A. Chevrel, M. Graille, Z. Fourati-Kammoun, M. Desmadril, H. van Tilbeurgh and P. Minard, PLOS ONE, 2013, 8, e71512.
24 K. L. Gurunatha, A. C. Fournier, A. Urvoas, M. Valerio-Lepiniec, V. Marchi, P. Minard and E. Dujardin, ACS Nano, 2016, 10, 3176–3185.
25 A. Dif, E. Henry, F. Artzner, M. Baudy-Floc’h, M. Schmutz, M. Dahan and V. Marchi-Artzner, J. Am. Chem. Soc., 2008, 130, 8289–8296.
26 G. Frens, Nat. Phys. Sci., 1973, 241, 20–22.
27 T. Bizien, P. Even‐Hernandez, M. Postic, E. Mazari, S. Chevance, A. Bondon, C. Hamon, D. Troadec, L. Largeau, C. Dupuis, C. Gosse, F. Artzner and V. Marchi, Small, 2014, 10, 3707–3716.
28 M. Debayle, E. Balloul, F. Dembele, X. Xu, M. Hanafi, F. Ribot, C. Monzel, M. Coppey, A. Fragola, M. Dahan, T. Pons and N. Lequeux, Biomaterials, 2019, 219, 119357.
29 J. Jasieniak, L. Smith, J. van Embden, P. Mulvaney and M. Califano, J. Phys. Chem. C, 2009, 113, 19468–19474.
30 X. Liu, M. Atwater, J. Wang and Q. Huo, Colloids Surf. B
Biointerfaces, 2007, 58, 3–7.
31 A. Dif, F. Boulmedais, M. Pinot, V. Roullier, M. Baudy-Floc’h, F. M. Coquelle, S. Clarke, P. Neveu, F. Vignaux, R. L. Borgne, M. Dahan, Z. Gueroui and V. Marchi-Artzner, J. Am. Chem. Soc., 2009, 131, 14738–14746.
32 V. Roullier, S. Clarke, C. You, F. Pinaud, G. Gouzer, D. Schaible, V. Marchi-Artzner, J. Piehler and M. Dahan, Nano Lett., 2009, 9, 1228–1234.
33 R. L. Rich and D. G. Myszka, J. Mol. Recognit., 2008, 21, 355– 400.
34 C. Chi, F. Vargas-Lara, A. V. Tkachenko, F. W. Starr and O. Gang, ACS Nano, 2012, 6, 6793–6802.
35 K. Okamoto, M. Funato, Y. Kawakami and K. Tamada, J.
Photochem. Photobiol. C Photochem. Rev., 2017, 32, 58–77.
36 O. Kulakovich, N. Strekal, A. Yaroshevich, S. Maskevich, S. Gaponenko, I. Nabiev, U. Woggon and M. Artemyev, Nano
Lett., 2002, 2, 1449–1452.
37 B. Rousseaux, D. Dzsotjan, G. Colas des Francs, H. R. Jauslin, C. Couteau and S. Guérin, Phys. Rev. B, 2016, 93, 045422.
Nanoscale
Accepted
Manuscript
Published on 31 January 2020. Downloaded by Bibliotheque de L’Universite de Rennes I on 1/31/2020 2:30:01 PM.
View Article Online
Nanoscale
Accepted
Manuscript
Published on 31 January 2020. Downloaded by Bibliotheque de L’Universite de Rennes I on 1/31/2020 2:30:01 PM.
View Article Online