HAL Id: hal-02883593
https://hal.inria.fr/hal-02883593
Submitted on 29 Jun 2020
HAL is a multi-disciplinary open access
archive for the deposit and dissemination of
sci-entific research documents, whether they are
pub-lished or not. The documents may come from
teaching and research institutions in France or
abroad, or from public or private research centers.
L’archive ouverte pluridisciplinaire HAL, est
destinée au dépôt et à la diffusion de documents
scientifiques de niveau recherche, publiés ou non,
émanant des établissements d’enseignement et de
recherche français ou étrangers, des laboratoires
publics ou privés.
On excess bandwidth usage of video streaming: when
video resolution mismatches browser viewport
Othmane Belmoukadam, Muhammad Jawad Khokhar, Chadi Barakat
To cite this version:
Othmane Belmoukadam, Muhammad Jawad Khokhar, Chadi Barakat.
On excess bandwidth
usage of video streaming:
when video resolution mismatches browser viewport.
NoF 2020
-11th IEEE International Conference on Networks of the Future, Oct 2020, Bordeaux, France.
�10.1109/NoF50125.2020.9249133�. �hal-02883593�
On excess bandwidth usage of video streaming:
when video resolution mismatches browser viewport
Othmane Belmoukadam
Universit´e Cˆote d’Azur, Inria, Franceothmane.belmoukadam@inria.fr
Muhammad Jawad Khokhar
Universit´e Cˆote d’Azur, Inria, Francemuhammad-jawad.khokhar@inria.fr
Chadi Barakat
Universit´e Cˆote d’Azur, Inria, France chadi.barakat@inria.fr
Abstract—Video streaming is, without a doubt, the most dom-inant application on the Internet. Each time a video streaming platform (e.g., YouTube, Dailymotion or Netflix) is requested, the browser loads a web page, setups the video player, then retrieves and renders the requested content. The video streaming transmission is based on the dynamic adaptive streaming over HTTP (DASH) which takes into consideration the underlying network conditions (e.g., delay, loss rate and throughput) and the terminal characteristics (viewport) to select the video res-olution to request from the server. We question in this work the efficiency of this transmission in taking into account the terminal characteristics, the viewport in particular, knowing that requesting a resolution exceeding the viewport results in waste of bandwidth. Such bandwidth waste can either save money when the user is on a pay as you go data plane, or steal bandwidth from other users who are in need for it to further improve their Quality of Experience (QoE). To narrow the stats, we present a controlled experimental framework that leverages the YouTube and Dailymotion video players and the Chrome web request API to assess the impact of browser viewport on the observed video resolution pattern [1]–[3]. In a first attempt of kind, we use the observed patterns to quantify the amount of wasted bandwidth. Our data-driven analysis points to high sensitivity of the Dailymotion player toward small viewports (240x144 and 400x225) compared to the YouTube player resulting in 15% and 8% less bandwidth waste respectively. However, as the users shift toward large viewports, the YouTube player becomes more viewport friendly compared to the Dailymotion player with shows an estimated bandwidth waste of 28%.
Index Terms—Video streaming, video resolution pattern, band-width waste, YouTube and Dailymotion.
I. INTRODUCTION
Around half of the world’s population uses the Internet regularly by means of different types of technologies. Even though the share of mobiles is fastly increasing, desktops still account for 45% of the worldwide market share [4]. Browsers and HTTP-like mobile applications serve as the main channel through which users from across the globe access the Internet every day [5]. Nowadays, we have a plethora of browsers with different features and characteristics, yet all performing the same tasks. As of September 2019, Google Chrome accounted for about 70% of the global market share held by leading desktop Internet browsers, increasing by around 13% in just
This work is supported by the French National Research Agency under grant BottleNet no. ANR-15-CE25-0013 and by Inria within the Project Lab BetterNet.
three years [6]. In general, with the help of a web browser, users can access a huge variety of content including entertain-ment sites, social media, and online shopping retailers. To that aim, browsers use different rendering engines making websites not all time appearing the same across multiple browsers. Video streaming, in particular, is the killing application of the Internet today. A study done by Ericsson suggested that by 2022, the global share of video traffic is expected to grow by nearly 50% [7]. The huge amount of video requests traveling through the Internet makes it an important service that both content providers and network operators seek to improve. For Internet services in general, Quality of Experience (QoE) is the metric to assess the user satisfaction. In particular, the video streaming QoE is either dependent on the content itself (the video bitrate and resolution) or the application level QoS metrics such as start up delay, duration of stalls and resolution switches [8]–[12]. The latter application level metrics are proved to be tightly correlated to the network level QoS (e.g., throughput, delay and loss rate) [13]–[15].
Today, and almost on every platform, video streaming is governed by the DASH protocol. For DASH, the client player automatically switches between video resolutions according to underlying network performance [16]–[19]. The video resolu-tion pattern as requested from the server is thus determined by the network conditions captured by the DASH client, and has normally to take into consideration the viewport size, which is defined as the number of pixels, both vertically and hori-zontally, on which the video is displayed. In scenarios where bandwidth is scarce, either because of congestion or because of limited bandwidth at the access, the impact of the screen is expected to be negligible. However, when network is in good conditions, the user fair share of bandwidth exceeds the viewport requirements, which raises the question of whether the players stick to the viewport requirements, or exceed it to download more than their needs. Downloading any resolution exceeding the viewport will be automatically downsized, hence resulting in a waste of bandwidth. This waste can go unnoticed in cases of abundant bandwidth, however in cases when bandwidth is billed at the byte level (the pay-as-you-go data planes) or network is saturated, understanding and controlling such waste could lead to less economical loss for the end-user and improved Quality of Experience (QoE) for the other users
who are in need for it (e.g., users with large viewports). Our paper tries to shed light on this open question.
In terms of QoE, as stated before, the video QoE is affected by video stalls, joint time and resolution switches, which are all related to the achieved bandwidth by the video flow. Cermak et al. [20] answered partially the question concerning the bandwidth needs for acceptable video experience on a set of screen resolutions. They show that different screen resolutions have different bandwidth requirements for the same QoE level. Other researchers have worked on QoE-driven network optimization, providing solutions both at the network and the application level [21]–[23]. For instance, and among many other related work, routing of video flows is optimized in [21], [22] so as to improve the QoE of end users, whereas the adaptation of video streaming quality is optimized in [23] using Deep Reinforcement Learning for smoother playout and improved end-user QoE. In a previous work [24], we have also contributed to this topic by taking into consideration the relationship that exists between screen resolution, video resolution and end-user QoE, and by proposing a resource allocation problem that maximizes the overall QoE over a set of users sharing the same bottleneck link.
To the best of our knowledge, we are the first to propose a complete study based on real experimentation to investi-gate how far the browsers today take into consideration the viewport size and to quantify the bandwidth waste in video streaming applications. For this, we build web pages that em-bed video players for two main streaming platforms (YouTube and Dailymotion). Every time called, the video player gets automatically a random video ID and a specific viewport, then starts playing the video while we collect measurements from within the browser. We leverage the Chrome web request API to read in real time the HTTP clear texts and record on a remote database the video chunks information [2]. We then use this information to derive models for the video resolution pattern on different viewports for both YouTube and Dailymotion and use these patterns to identify if there is a waste of network resources and estimate the amount of this waste. Overall, the contributions of the paper are:
• We provide an overview of today’s YouTube and
Daily-motion video catalogues (e.g., popularity, video formats and bitrate). To that aim, we rely on an open source dataset of YouTube video metadata [25]. For Dailymo-tion, we build our own catalogue of trending videos covering several categories and we make it available to the large public [26].
• We present a controlled experimental methodology to
identify the video resolution patterns on different view-ports. Our methodology is general and can be used to extend the work to streaming platforms other than YouTube and Dailymotion as long as these platforms provide video player and data API’s. Moreover, our framework accounts for the high variability of video content by considering a large YouTube catalogue and several Dailymotion playlists.
• We provide a detailed performance comparison for
0
25000 50000 75000 100000125000150000175000200000
Total unique videos
Movies TrailersShows Nonprofits & ActivismPets & Animals Travel & EventsComedy Science & TechnologyEducation Howto & StyleGaming Autos & Vehicles Film & AnimationMusic News & PoliticsSports People & BlogsEntertainment
Category
(a) Cumulative number of videos per category
0 5 10 15 20 25
Cumulative duration(Million seconds)
Movies TrailersShows Nonprofits & ActivismPets & Animals Travel & EventsComedy Science & TechnologyEducation Gaming Howto & Style Autos & Vehicles Film & AnimationNews & Politics Music Sports People & BlogsEntertainment
Category
(b) Cumulative video duration per category
0 20 40 60 80 100 120
Cumulative views(billion)
Movies Trailers Nonprofits & ActivismTravel & Events Shows Autos & VehiclesNews & Politics Pets & Animals Science & TechnologyHowto & Style Sports Gaming Education People & BlogsComedy Film & AnimationEntertainment Music
Category
(c) Cumulative view count per category
Fig. 1: YouTube catalogue overview per category
YouTube and Dailymotion players with a focus on the bandwidth waste on a set of viewports. For YouTube, we collect the HTTP requests to highlight the chunk resolution pattern [1], [2]. For Dailymotion, we propose a probabilistic methodology able to quantify the bandwidth waste based on the real time periodic player updates. The rest of the paper is organized as follows. In Section II we provide a descriptive analysis of both catalogues used in our experiments. In Section III we discuss the archi-tecture of our framework for the two considered streaming platforms. Later in Section IV, we discuss the data-driven video resolution patterns discovered using different Chrome browser viewports for YouTube and Dailymotion. Then, in Section V, we leverage the underlying patterns to approximate the resulting bandwidth waste. Last, we conclude and present our future work.
II. CATALOGUES OVERVIEW
We use an open source YouTube catalogue. The catalogue was built using the YouTube API where YouTube was searched with specific keywords obtained from Google Top Trends
website. The authors of [14] rely on Google’s getvideoinfo API to return the video metadata for each video identifier. The dataset includes around 1 Million unique video identifiers. For Dailymotion, we fetch 200 trending videos from different categories. Regarding the diversity of content in the dataset, we observe that the YouTube videos belong to several categories such as sports, entertainment and gaming. In Fig. 1, we plot statistics regarding YouTube video categories. As can be seen in Fig. 1(a), the entertainment and people & blogs categories are the largest ones representing each more than 200K unique videos, then followed by sports category with almost 150K unique videos. On the other hand, the least represented categories are movies and trailers with less than 10K videos each. In terms of duration, the people & blogs videos are the longest with a cumulative duration of 8 Million seconds followed by the entertainment category with a total of 6 Million seconds. At the bottom of the list , we find movies with a cumulative duration less than 1 Million seconds. We also evaluate the popularity of each category in terms of number of views. For this, we aggregate the total views for videos belonging to the same category and show the results in Fig. 1(c). As highlighted in the figure, the entertainment and music videos are the most popular with a cumulative number of views almost equal to 120 Billion each followed by film & animation with up to 60 Billion views. At the bottom of the list, one can find movies and trailers with less than 1 Billion views each. We sum up views for top channels, and notice that the leading categories are news and sports with 5 and 4 Billion views respectively followed by games and lifestyle & entertainment with 1 Billion views each. Unfortunately, we couldn’t perform the same study for Dailymotion because of the lack of the corresponding metadata and the difficulty to measure it at large scale. However, to give an idea of trending categories on Dailymotion, we refer to the statistics on most viewed channels available in [27].
A. From video resolution to bitrate
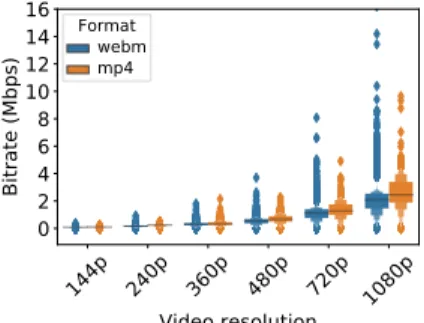
The adaptive video streaming requires different video reso-lutions, each of which is characterized by an encoding bitrate that differs from one video to another depending on its content (high motion, slow motion, no motion or static, music video, . . . ). It also differs from one resolution to another for the same video. The video bitrate is an important feature in our study that allows to estimate the bandwidth waste. In terms of video distribution per resolution, 60% and 99% of the videos featured by the YouTube and Dailymotion, respectively, support video resolutions up to 1080p. Thus, we study the bitrate distribution with respect to main video resolutions, ranging from 144p to 1080p. In the YouTube catalogue, videos are available in two major video types encoded by the H.264 and Google’s VP9 standards [28], [29]. The individual video type formats are ”mp4” and ”webm”, respectively. By analyzing the catalogue, we found that 82% of the videos are available in mp4 and webm. The remaining 18% of videos are only available in mp4. To study the difference between the two formats, we illustrate their bitrate distribution using
boxen plots, which are enhanced version of box plots featuring several quantiles and offering more details while describing empirical distributions.
The overall distribution of the video bitrate w.r.t. the sup-ported resolutions and video types is given in Fig. 2(a). The two video formats have slightly different bitrates for the same resolution with an advantage for the webm format making it the preferred format by Google to handle the video content bulk. Overall, and as expected, the figures show a clear positive correlation between video resolution and the bitrate. On the other hand, for Dailymotion, we use a video downloader to obtain the actual size of all videos used in our experiments for every available resolution. We then calculate the reference bi-trate per resolution as being the video size divided by the video duration. Note that our method does not distinguish between audio and video packets, they both contribute to the video size. This can still be considered as a good approximation of the real video bitrate especially in view of the low standard audio bitrate highlighted in the Dailymotion official documen-tation [30]. We highlight in Fig. 2(b) the bitrate distribution w.r.t. video resolution for Dailymotion videos. In general, Dailymotion shows the same macro behavior as YouTube where the encoding bitrate increases with the video resolution. These values highlighted in our study correlate with the results mentioned in the Dailymotion official documentation [30]. By comparing the two plots in Fig. 2, we can see a clear difference in bitrate values between the two platforms, especially for the 1080p resolution. Overall, YouTube features lower encoding bit rates for high resolutions hence suggesting more efficient utilization of network resources for videos of same resolution. Such difference could be partially related to the encoding parameters such as the frame rate. Further, YouTube video encoding shows more variability in the bitrate compared to the Dailymotion one.
III. EXPERIMENTAL SETUP
We plan on highlighting the video resolution pattern played on a given Chrome browser viewport. Normally, this pattern is affected by the viewport, but also by the underplaying network conditions [8]–[10]. As we are focusing in this work on the viewport and the extent to which it is respected by the player, we exclude the network impact by only experimenting with good network conditions able to support the best resolutions available for each video. Regardless of the streaming platform, good network conditions in our framework consist of a wired connection ensuring high download bandwidth monitored to never go bellow 10 Mbps. This choice is also motivated by the bitrate distributions for both YouTube and Dailymotion (see Fig. 2). Our overall experimental setup described in Fig. 3 consists of a local mainController running on MacBook Air machine of 8 GB RAM. Videos are visualized on a Dell screen 27’ of 2560 x 1440 resolution. The local mainController stores the video catalogues and the viewport list, and provides a random combination of video ID and viewport for every new experiment as illustrated in Fig. 3. We cover a large space of viewports by considering a list of default standard viewports
144p 240p 360p 480p 720p 1080p Video resolution 0 2 4 6 8 10 12 14 16 Bitrate (Mbps) Format webm mp4
(a) YouTube video bitrate (webm vs mp4)
144p 240p 360p 480p 720p 1080p Video resolution 0 2 4 6 8 10 12 14 16 Bitrate (Mbps)
(b) Dailymotion video bitrate (mp4)
Fig. 2: Video bitrate per resolution for YouTube and Dailymotion
Fig. 3: Experimental framework description
such as the current YouTube and Dailymotion small media player mode (400x225) along with other default SD viewports (e.g., 240x144, 640x360 and 850x480). These latter viewports represent the current player dimensions adopted by streaming platforms for several watching modes. We also account for larger viewports by considering the standard 1280x720 and 1920x1080 (HD and FHD).
A. YouTube use case
For YouTube, and to study the chunk resolution pattern on a given viewport, we stream up to 2K YouTube videos covering different categories (e.g., sports, entertainment, education) and a large span of video bitrates. First, we use the iframe player API to embed a YouTube video player on our web page and control the player using JavaScript functions [1]. While playing a video, the audio and video chunks are requested using separate HTTP requests, each with a specific resolution. We leverage the Chrome web request API to extract the HTTP
clear requests and get the chunk related information (e.g., itag). To interpret the chunk itags, we use the YouTube open documentation which is publicly available and which allows to map itags to chunk resolution and coding standard [31], [32].
B. Dailymotion use case
Along with YouTube, we consider the Dailymotion video-sharing application. Dailymotion is available for Windows 10, Windows Phone, iOS and Android mobile operating systems, and most recently for the PlayStation 4 and Xbox One gaming consoles. From one side, we aim at confronting YouTube to Dailymotion in terms of their video resolution pattern for dif-ferent viewports and the amount of bandwidth wasted on each viewport. From the other side, we will get to understand the particular interaction between the Dailymotion video player and today’s interactive web pages. While the HTTP messages can be intercepted following the previous methodology applied for YouTube, no documentation is available to shed light on the raw metadata included in the messages, making it hard to interpret in terms of resolution and coding standard. To over-come this limitation, we propose a probabilistic methodology to estimate video resolution patterns using real time updates from the Dailymotion player accessed through its own API. In general, regardless of the streaming platform, the player API does not give access to chunk resolutions neither chunk sizes, instead, it can be used to access player properties such as current playback time and resolution. The same API can be used to collect application level QoS features such as stalls and joint time, which are very useful for QoE monitoring.
So, we use the Dailymotion JavaScript SDK (Software developer kit) to embed their video player in our web page and access all its features [3]. Among the features available, we capture the real time player updates on downloaded resolutions and export them to our database where they are stored for later processing. The mainController highlighted in Fig. 3 performs the main offline tasks of setting up the Dailymotion player within a specific viewport (same viewport list as in YouTube experiments) and launching the streaming of one of the considered videos. However, instead of intercepting HTTP clear requests as in the case of YouTube, we periodically report to our database the player updates in a real time fashion.
IV. THE IMPACT OF BROWSER VIEWPORT ON VIDEO
RESOLUTION PATTERNS
In this section, we leverage our controlled experimental framework (see Fig. 3) to conduct a data-driven analysis of video resolution patterns observed on different browser view-ports. We assume that each resolution results in the best visual experience when displayed on the corresponding viewport (i.e., equal number of pixels) without any stall and with a reasonable start time. To motivate this assumption further, we leverage an ITU-T Rec. P.1203 standalone implementation with an open source dataset based on controlled experi-ments. The dataset maps network-level QoS to application-level QoS [14], [33] and calculates the QoE according to the
Video resolution Viewport (pixels) 1080p 1920x1080 720p 1280x720 480p 850x480 360p 640x360 240p 426x240 144p 240x144
TABLE I: Standard video resolution with matching viewport
ITU-T recommendation. For low throughput scenarios, video is downloaded using low resolution, but still shows higher QoE for small viewports compared to large ones. Moreover, authors of [20] show that different screen resolutions have different bitrate requirements for the same MOS level. For further information, we recall in Table I the recommended resolutions for the set of viewports we consider in our experiments1.
A. YouTube chunk resolution pattern
For YouTube, every experiment consists of one video ID and one specific viewport. Once the player is ready, we start the video session and intercept the requests of the player for every chunk during playback. Chunk requests include indicators such as video ID, chunk size and chunk itag that can be used to extract the chunk resolution and codec type. Overall, we stream up to 2K unique YouTube videos using 6 standard viewports. For fairness, we consider only videos available in at least 6 main streaming resolutions (from 144p to 1080p). Our first analysis shows that 99% of the videos streamed where fetched in the video/webm format which corresponds to the Google VP9 compression standard. This result confirms the previous observation regarding the Google servers’ preference to video/webm format when serving content.
1) Video resolution pattern: For every chunk request, we
leverage the itag, range and mime (Multi-purpose Internet Mail Extensions) parameters to infer the corresponding resolution, the codec and the size. To derive the rate of occurrence of each chunk resolution during the playback of a video on a given viewport j, we use Equation (1), where CR(i, j) refers to the set of chunks of resolution i encountered on viewport j. The same formula is used to calculate the video resolution pattern over all videos.
ChunkResolutionRate(i, j) = P|CR(i, j)|
i
|CR(i, j)|. (1)
The heatmap in Fig. 4 illustrates the chunk resolution patterns in an easy and interpretative manner. Overall, regardless of the browser viewport, the default startup chunk resolution is 360p even though lower resolutions matching the viewport are available. Note that lower resolutions can still be asked by the DASH client if the network conditions degrade, but it seems that in our case of good network conditions, they are not requested even though some of the viewports we consider require lower resolutions than 360p. Moreover, small viewports such as 240x144, 400x225 and 640x360 form one
1https://support.google.com/youtube/answer/6375112
cluster characterized by the same overall pattern; starting with 360p and scaling up toward higher chunk resolutions (up to 720p). In particular, for 400x225, which is the official YouTube viewport for the small player mode, 94% of the chunks played out are in 360p, only 1% are in 480p and up to 5% of the chunks are in 720p. We note here that neither the 720p resolution nor the 480p one can be displayed directly on the small player mode, for that they need to be downsized to match the viewport thus resulting in what we call bandwidth waste. Meanwhile, the HD and FHD viewports result in chunks of higher frame rates such as 1080p60 and 720p60. As example, the 1920x1080 viewport results in 15% of chunks at 1080p60, which corresponds to a 1080p resolution with 60 frames per second. The normal 1080p resolution from its side is 30 frames per second. We can thus conclude that the first YouTube viewport which is network friendly, i.e., minimum waste, is the 640x360 one, other smaller viewports exceed the required video resolution.
2) Chunk size analysis: We use the chunk sizes observed
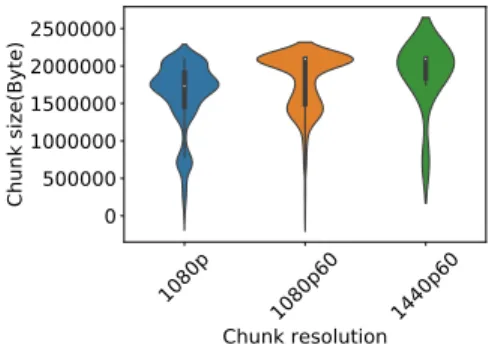
in the clear text HTTP traces (from within the browser) to understand the impact of the observed behavior on the bandwidth consumption. We illustrate the results in Fig. 5. In Fig. 5(a), we illustrate the chunk size CDF per resolution. As expected, the chunk size correlates with the chunk resolution with higher resolutions leading to larger chunks. Here, we make sure to include all encountered chunk resolutions even those rarely appearing such as 1440p and 1440p60. Thanks to this information on chunk sizes, we will estimate later the playback bitrate and the bandwidth waste given the observed chunk resolution pattern on each viewport. In Fig. 5(b), we plot the distribution of the chunk size per browser viewport. The figure shows that indeed the 240x144, 400x225 and 640x360 screen resolutions form one cluster and exhibit the same chunk size distribution under good network conditions. Larger viewports tend to download larger resolutions. In general, we shall confirm that the pattern of chunk resolutions does carry a signature of the viewport size. In Fig. 6, we compare the distributions of the sizes of chunks (in Bytes) whose resolution matches or exceeds the resolution of the 640x360 and 1920x1080 viewports (one small and one large). For the 640x360 viewport, the chunks exceeding this display capacity are characterised with a higher median and 50% of them vary in a larger size space ranging from 150K to 1.5M Bytes. This already gives an idea on the order of bandwidth wasted on these viewports.
B. Dailymotion pattern
We perform controlled experiments with up to 200 unique Dailymotion videos on different viewports. To overcome the lack of assets to extract chunk information from raw Dailymo-tion HTTP messages, we propose an alternative methodology that consists in leveraging the periodic information provided by the Dailymotion API coupled with a probabilistic approach. Instead of intercepting chunk requests as with YouTube, every second our mainController receives player updates accessed through its API and stores them in our local database, with
144p240p360p480p720p
720p60
1080p
1080p60
240x144
400x225
640x360
850x480
1280x720
1920x1080
0.00 0.000.970.00 0.03 0.00 0.00 0.00 0.00 0.000.940.01 0.05 0.00 0.00 0.00 0.00 0.000.970.00 0.03 0.00 0.00 0.00 0.00 0.00 0.100.860.04 0.00 0.00 0.00 0.00 0.00 0.10 0.050.830.02 0.00 0.00 0.00 0.00 0.06 0.02 0.02 0.000.750.15 0.0 0.2 0.4 0.6 0.8Chunk reoslution playback rate
Fig. 4: The YouTube chunk resolution playback rate as extracted from HTTP request clear text
0 1000000200000030000004000000 Chunk size(Byte) 0.0 0.2 0.4 0.6 0.8 1.0 CDF 1440p60 1440p 1080p60 1080p 720p60 720p 480p 360p
(a) Chunk size CDF per chunk resolution
0 50000010000001500000200000025000003000000 Chunk size(Byte) 240x144 400x225 640x360 850x480 1280x720 1920x1080 Viewport
(b) Chunk size box plot per viewport
Fig. 5: Analysis of YouTube chunk sizes
every update including: (i) the video identifier and title, (ii) the viewport size, (iii) the video duration, (iv) the available video resolutions, (v) the video resolution played out, and (vi) the buffer size occupancy. Later, we use this information to estimate the video resolution playback rate by transforming resolutions into bitrate using statistics on the Dailymotion codec (Fig. 2(b)). Regarding the list of streamed videos, and as we don’t have a public catalogue of Dailymotion video metadata, we work with a solution that consists of crawling up to 20 Dailymotion playlists covering several trending categories (e.g., trailers, news and sports), where every playlist includes on average 10 videos of the same topic. In Fig. 7, we illustrate the rate of occurrence of video resolutions as reported by Dailymotion for the different considered viewports. These
360p 720p Chunk resolution 5000000 500000 1000000 1500000 2000000 2500000 Chunk size(Byte)
(a) Chunk size violin plot for 640x360 viewport
1080p 1080p60 1440p60 Chunk resolution 0 500000 1000000 1500000 2000000 2500000 Chunk size(Byte)
(b) Chunk size violin plot for 1920x1080 viewport
Fig. 6: Chunk size violin plots, matching and exceeding resolutions, case of 640x360 and 1920x1080 viewports
144p240p360p480p720p1080p
240x144
400x225
640x360
850x480
1280x720
1920x1080
0.00 1.00 0.00 0.00 0.00 0.00 0.00 0.00 1.00 0.00 0.00 0.00 0.00 0.00 0.00 1.00 0.00 0.00 0.00 0.00 0.00 0.95 0.05 0.00 0.00 0.00 0.00 0.00 0.75 0.25 0.00 0.00 0.00 0.00 0.03 0.97 0.0 0.2 0.4 0.6 0.8 1.0Video resolution playback rate
Fig. 7: Video resolution pattern reported by Dailymotion player
rates are calculated according to Equation (2), where P U (i, j) denotes the set of player updates of resolution i on viewport j.
V ideoResolutionRatio(i, j) = P|P U (i, j)|
i
|P U (i, j)|. (2) As can be noticed in Fig. 7, the 240x144 viewport only requests the 240p resolution which is different from what we observed with YouTube. In general, for small viewports, the Dailymotion player does not go high in requesting resolutions (e.g., 720p) even though network conditions can support them. For the 640x360 viewport, Dailymotion shows an interest-ing behavior with the 480p resolution beinterest-ing the only one downloaded over all video sessions even though the suitable
0 2 4 6 8 Playback time(s) 0.0 0.2 0.4 0.6 0.8 1.0 CDF
Fig. 8: CDF of 720p video resolution vs playback time for the FHD viewport (1920x1080)
360p resolution is well present. One reason could be that Dailymotion encoder adapts a non-standard width encoding for the 360p which restricts its use to lower resolution viewports (with height less than 360 pixels). Another interesting behavior is highlighted by the HD viewport (1280x720) where 25% of the reported video resolution updates appear to be of 1080p. In other words, for the HD viewport, the Dailymotion player tolerates downloading chunk resolutions exceeding the view-port capacity, these chunks will be unfortunately downsized during playback to match the viewport hence incurring waste of bandwidth. We can thus conclude that for small viewports, the Dailymotion player is more restricted to the viewport capacity than the YouTube player, whereas for large viewports it tends to show an opposite behavior.
For the 1920x1080, we can see some low resolutions occurring, as the 3% of 720p video resolution. We hypothesize that these low resolutions correspond to the startup phase where the network state is not well estimated. To validate our hypothesis, we plot the CDF of the 720p video resolution w.r.t. its playback time for the FHD viewport. Indeed, Fig. 8 confirms our intuition: all the 720p updates are seen at the very beginning of the video before the 8-th second.
V. QUANTIFYING THE WASTE OF BANDWIDTH
In this section, we leverage the observed patterns to estimate the bandwidth waste resulting from this behavior. In fact, downloading higher video resolutions than needed does not necessarily contribute to a better QoE as it will be anyways downsized to match the viewport, hence resulting in what we call bandwidth waste. We extend our data-driven analysis to approximate the level of this bandwidth waste.
A. The estimated playback bitrate
To derive the bandwidth waste for a video, we need its estimated playback rate together with the reference playback rate for the best resolution suitable to the viewport (see Table I). Here, in the light of Section II results, we explain how we estimate the playback bitrate.
1) YouTube playback bitrate: We leverage the experimental results to estimate the real playback bitrate for every video session. For that, we use the chunk size and the video duration. Overall, as in Equation (3), the playback bitrate is set equal
to the sum of chunk sizes of a video session divided by the duration of the session.
playback bitrate =
P
c∈video chunks
size(c)
video duration (3)
2) Dailymotion playback bitrate: As explained previously, we cannot infer chunk related information such as resolution and bitrate from Dailymotion HTTP requests as we did for YouTube. The reason is the lack of open documentation to interpret the raw data embedded in the requests. Instead, we resort to a discrete probabilistic approach that allows us to estimate the playback bitrate of Dailymotion video sessions. Our solution relies on the resolution patterns and the reference Dailymotion bitrate per video resolution. In practice, the playback bitrate for a video session is derived according to the following equation:
playback bitrate =X
j∈S
αj∗ bitrateref (j), (4)
where S is the set of unique video resolutions after video playback, αj refers to the video resolution j playback ratio
and bitrateref (j) represents the reference Dailymotion bitrate
for video resolution j (as in Fig. 2(b)).
B. The estimated bandwidth waste
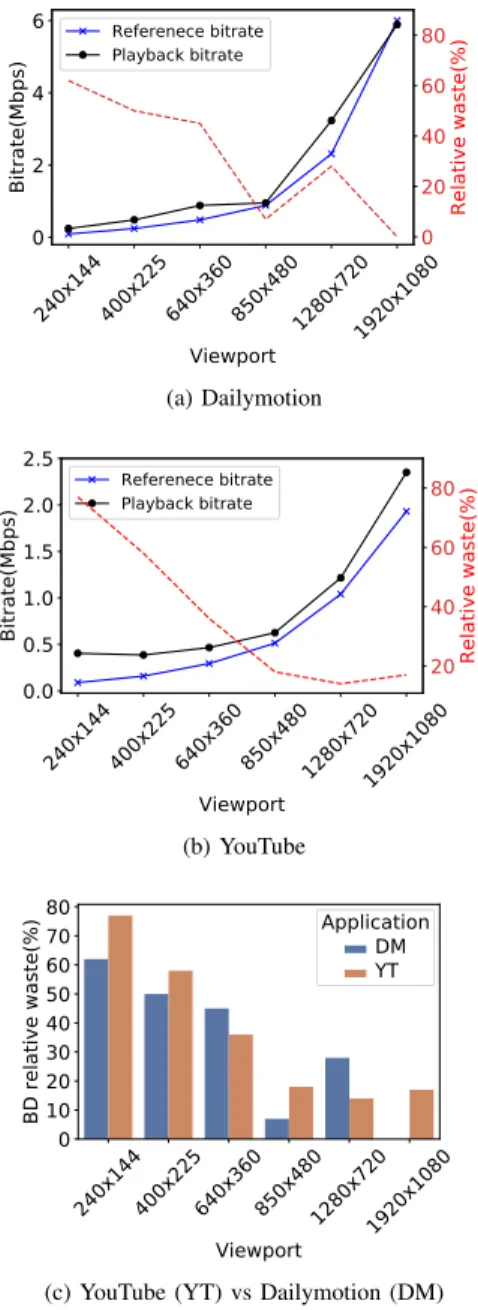
We define bandwidth waste for a giving browser viewport as the difference between the estimated playback bitrate and its matching reference bitrate calculated using the fixed resolution suitable to the viewport as highlighted in Table I.
We plot in Fig. 9 (red dashed line) the relative bandwidth waste in percent for both YouTube and Dailymotion and for different viewports. As reference, we also plot the average reference and playback rates of both platforms (blue ”x” and black ”o” lines respectively). Fig. 9(a) is for Dailymotion and Fig. 9(b) is for YouTube. Fig. 9(c) compares them to each other using a bar plot. A first look at the results shows that no player outperforms the other one for all viewports. Dailymotion comes first for four viewports on six, but this result has to be tempered by the fact that Dailymotion’s encoder produces higher bitrates than the YouTube one for the same resolution (see Fig. 2). We can notice that for small viewports, the Daily-motion player results in less waste on average than YouTube, still the waste of both players is around 50%. In plain, for the small player mode of 400x225, YouTube and Dailymotion players result in 58% and 50% bandwidth waste, respectively. For Dailymotion, the bandwidth waste stays almost at the same level at the beginning, then drops and can reach even 0% over the FHD viewport. For the HD viewport, the Dailymotion player reveals a poor performance with 28% waste compared to 14% with YouTube. On the other hand, on the 1920x1080 viewport, the YouTube player shows almost 20% bandwidth waste as result of the exceeding resolutions cited in Fig. 6(b), compared to no waste for Dailymotion. The good news comes from the fact that bandwidth waste is negatively correlated to the viewport size. Yet, even for large viewports, the amount
240x144 400x225 640x360 850x4801280x7201920x1080 Viewport 0 2 4 6 Bitrate(Mbps) Referenece bitrate Playback bitrate 0 20 40 60 80 Relative waste(%) (a) Dailymotion 240x144 400x225 640x360 850x4801280x7201920x1080 Viewport 0.0 0.5 1.0 1.5 2.0 2.5 Bitrate(Mbps) Referenece bitrate Playback bitrate 20 40 60 80 Relative waste(%) (b) YouTube 240x144400x225640x360850x4801280x7201920x1080 Viewport 0 10 20 30 40 50 60 70 80 BD relative waste(%) Application DM YT
(c) YouTube (YT) vs Dailymotion (DM)
Fig. 9: Bandwidth waste
of bandwidth wasted cannot be neglected. We project that this waste will have a particular impact on those users with limited data planes. From the side of the network, such waste can improve network efficiency by reducing energy consumption and redistributing the excess bandwidth to other flows in need for it in scenarios of bandwidth shortage.
VI. CONCLUSION
In this paper, we presented a hybrid methodology combin-ing controlled experiments and a probabilistic approach to investigate the impact of Chrome browser viewport on the streamed video resolution patterns. To infer the video patterns we followed two approaches, one for YouTube that consisted of reversing the HTTP clear messages and the other one for Dailymotion by using its video player feedback seconded by a probabilistic estimation of playback rate. Later, we reused the
discovered patterns to approximate the bandwidth waste for the two video streaming platforms. We also presented a descriptive analysis of an open source YouTube dataset of more than 1M videos metadata and statistics on the encoders used by YouTube and Dailymotion. Even though the DASH algorithm is supposed to account for the terminal characteristics, our experimental results showed a non-negligible waste of network resources that can be of order 50% for small viewports and 20% for the large ones.
In general, the bandwidth waste tends to decrease when the viewport size increases, however, it remains considerable for operators and end users to care about. We think in particular about users with limited data plans. We also think about scenarios where this excess bitrate can be used by concurrent flows, whether videos or other, for a better quality of experience of end users. Reducing the bill of network energy consumption is an objective we have in mind as well.
VII. FUTURE WORK
As future work, we plan to extend our study to cover prepaid video streaming platforms (e.g., Netflix and Amazon prime) and to develop plugins that generalise our experiments for other browsers such as Firefox, Opera and Safari. Moreover, we also plan on considering new popular video formats (e.g., 4K, 8K and 360°) and advanced display technologies such as mobile phones and smart TV’s.On another complementary topic, we aim at reusing our results to build strategies able to perform optimal resource allocation at the edge of the network leveraging terminal characteristics and aiming at maximizing the Quality of Experience of end users.
REFERENCES
[1] YouTube, “IFrame player API.” https://developers.google.com/youtube/ iframe api reference, 2020.
[2] Google, “Chrome Web Request Extension.” https://developer.chrome. com/extensions/webRequest, 2020.
[3] Dailymotion, “JavaScript SDK.” https://github.com/dailymotion/
dailymotion-sdk-js, 2020.
[4] Statcounter, “Desktop, mobile and tablets worldwide market share.” https://gs.statcounter.com/platform-market-share/desktop-mobile-tablet, 2020.
[5] Statista, “Internet Usage Worldwide, Stats & Facts.” https://www.statista. com/topics/1145/internet-usage-worldwide/, 2020.
[6] Statcounter, “Browser Market Share Worldwide.” https://gs.statcounter. com/browser-market-share, 2020.
[7] Ericsson, “Ericsson Mobility Report, June 2018.” https://www.ericsson. com/assets/local/mobility-report/documents/2018/ericsson-mobility-report-june-2018.pdf, 2018.
[8] R. R. Pastrana-Vidal, J. C. Gicquel, C. Colomes, and H. Cherifi, “Sporadic frame dropping impact on quality perception,” Proc. SPIE 5292, Human Vision and Electronic Imaging IX, 2004.
[9] Y. Qi and M. Dai, “The effect of frame freezing and frame skipping on video quality,” Proc. IEEE Int. Conf. Intell. Inform. Hiding Multimedia Signal Process., 2006.
[10] A. K. Moorthy, L. K. Choi, A. C. Bovik, and G. D. Veciana, “Video quality assessment on mobile devices: Subjective, behavioral and objec-tive studies,,” IEEE J. Sel. Topics Signal Process., 2012.
[11] ITU-T, “Subjective video quality assessment methods for multimedia applications,” ITU-T Recommendation P.910, 2018.
[12] M. Khokhar, T. Spetebroot, and C. Barakat., “A methodology for perfor-mance benchmarking of mobile networks for internet video streaming,” ACM MSWIM, 2018.
[13] T. Hoßfeld, M. Seufert, M. Hirth, T. Zinner, P. Tran-Gia, and R. Schatz, “Quantification of youtube qoe via crowdsourcing,” IEEE International Symposium on Multimedia, 2011.
[14] M. Khokhar, T. Ehlinger, and C. Barakat., “From network traffic measurements to qoe for internet video,” IFIP Networking Conference, 2019.
[15] O. Belmoukadam, T. Spetebroot, and C. Barakat, “Acqua: A user friendly platform for lightweight network monitoring and qoe fore-casting,” The 3rd International Workshop on Quality of Experience Management, 2019.
[16] T. Stokhammer, “Dynamic adaptive streaming over http – design prin-ciples and standards,” ACM MMSys, 2011.
[17] G. Tian and Y. Liu, “Towards agile and smooth video adaptation in dynamic http streaming,” Proc. 8th Int. CoNEXT, 2012.
[18] C. Liu, I. Bouazizi, M. M. Hannuksela, and M. Gabbouj, “Rate adap-tation for dynamic adaptive streaming over http in content distribution network,” Signal Process., Image Commun, 2012.
[19] D. J. Vergados, A. Michalas, A. Sgora, and D. D. Vergados, “Fdash: A fuzzy-based mpeg/dash adaptation algorithm,” IEEE Systems Journal, 2016.
[20] G. Cermak, M. Pinson, and S. Wolf, “The relationship among video quality, screen resolution, and bit rate,” IEEE Transactions on Broad-casting, 2011.
[21] G. Calvigioni, R. Aparicio-Padro, and L. Sassateli, “Quality of experience-based routing of video traffic for overlay and isp networks,” IEEE INFOCOM, 2018.
[22] P. T. A. Quang, K. Piamrat, K. D. Singh, and C. Viho, “Video streaming over ad hoc networks: A qoe-based optimal routing solution,” IEEE Transactions on Vehicular Technology, 2017.
[23] H. Mao, R. Netravali, and M. Alizadeh, “Neural adaptive video stream-ing with pensieve,” ACM SIGCOMM, 2017.
[24] O. Belmoukadam, M. Khokhar, and C. Barakat, “On accounting for screen resolution in adaptive video streaming: a qoe driven bandwidth sharing framework,” CNSM, 2019.
[25] YouTube, “Video Catalogue.” https://drive.google.com/open?id=
1tu0sBInt8xJ9Zn32IDlh6DW ju2FhEou, 2020.
[26] Dailymotion, “video catalogue.”
https://github.com/asap-code/Dailymotion-video-catalogue.git, 2020.
[27] S. blade, “Dailymotion top viewed channels.” https://socialblade.com/ dailymotion/top/category/news, 2020.
[28] D. Mukherjee, J. Bankoski, A. Grange, J. Han, J. Koleszar, P. Wilkins, Y. Xu, and R. Bultje, “The latest open-source video codec vp9 - an overview and preliminary results,” Picture Coding Symposium (PCS), 2013.
[29] W. Fischer, “Video coding (mpeg-2, mpeg-4/avc, hevc),” Signals and Communication Technology book series (SCT), 2020.
[30] Dailymotion, “Dailymotion video encoding recommendation.”
https://faq.dailymotion.com/hc/en-us/articles/203655666-Encoding-parameters, 2020.
[31] YouTube, “Itag documentation.”
https://www.genyt.xyz/formats-resolution-youtube-videos.html, 2020.
[32] YouTube, “Itag Git catalogue.” https://gist.github.com/sidneys/
7095afe4da4ae58694d128b1034e01e2, 2020.
[33] “ITU-T Rec. P.1203 Standalone Implementation.” https://github.com/itu-p1203/itu-p1203, 2020.