HAL Id: hal-02814725
https://hal.inrae.fr/hal-02814725
Submitted on 6 Jun 2020
HAL is a multi-disciplinary open access
archive for the deposit and dissemination of
sci-entific research documents, whether they are
pub-lished or not. The documents may come from
teaching and research institutions in France or
abroad, or from public or private research centers.
L’archive ouverte pluridisciplinaire HAL, est
destinée au dépôt et à la diffusion de documents
scientifiques de niveau recherche, publiés ou non,
émanant des établissements d’enseignement et de
recherche français ou étrangers, des laboratoires
publics ou privés.
Fine root density, branching pattern and mycorrhizal
diversity across Pinus pinaster stands in south west
France: methodology and first results
Claude Plassard, Céline Meredieu, Mark Ronald Bakker, Frederic Danjon,
Pierre Trichet, Jacques Guinberteau, Laurent Augusto, Etienne Saur, Odile
Domergue, Antoine Galiana, et al.
To cite this version:
Claude Plassard, Céline Meredieu, Mark Ronald Bakker, Frederic Danjon, Pierre Trichet, et al.. Fine
root density, branching pattern and mycorrhizal diversity across Pinus pinaster stands in south west
France: methodology and first results. COST 38 Meeting, Roots, mycorrhizas and their external
mycelia in carbon dynamics in forest soil, Sep 2006, Rovaniemi, Finland. n.p., 2006. �hal-02814725�
Fine root density, branching pattern and mycorrhizal diversity
across
Pinus pinaster
stands in south west of France:
methodology and first results
C. Plassard
1, C. Meredieu
2, M.R. Bakker
3, F. Danjon
2, P. Trichet
2, J. Guinberteau
5, L. Augusto
4, E. Saur
3,
O. Domergue
6, A. Galiana
6, Y. Prin
6, M.A. Ali
1, D. Loustau
2Objectives
The Pinus pinaster forest in South-west France produces the fifth of French wood. It covers 0.9 million hectares over sandy spodosols and is characterised by a large variation in productivity. As a contribution for understanding these variations we carried out a project aiming at linking them to both hydrological and nutritional soil status.
Methods
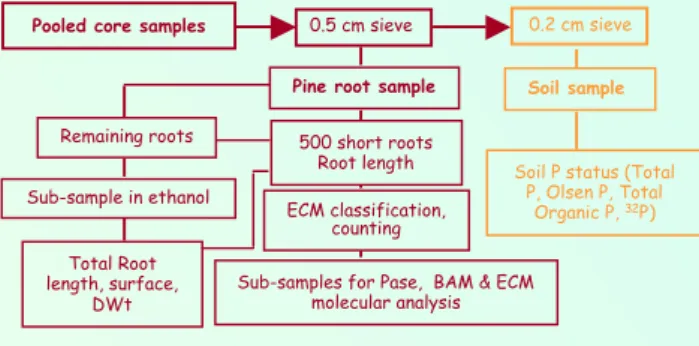
25 experimental plots were selected in order to cover a range of forest productivity, fertilisation and water availability levels. Site productivity was estimated from a standard forest inventory carried out in 2005. In April 2006, 8 pairs of sample points (soil cores 15 cm deep and 8 cm diameter) were chosen on the tree line and between the tree lines close to random selected trees. Figure 1 gives the procedure applied to core soils and the experimental data obtained. Statistical analysis of data was carried out to compare plots without any P application (control) or with P application once at the plantation (standard), or repeated P (P) or N (N) application; in addition, P or N plots received irrigation or not (irrigated or not irr).
Results
Root parameters: Fine root length density
(FRLD) and specific root length (SRL) were affected by fertilisation, especially by repeated fertilisation, and not by irrigation (Fig. 2).
Root branching, estimated by the total number of short roots (SR), ranged from 37 to 45 SR/m root and was little affected by fertilisation or irrigation (not shown).
Conclusions and perspectives
To our knowledge, our methodology to address the question of productivity determinism of Pinus pinaster stands has not been used
before. The first results show that there are differences between experimental plots affecting root growth and ECM activities. This first set of data will be completed by a second campaign in November 2006, the whole data should enable us to carry out a statistical analysis between stand productivity and all the studied variables. In addition, this project should provide information about the actual role of ECM and their associated bacterial populations on organic P mobilisation.
Figure 1. Simplified scheme of sampling and analysis
Ectomycorrhizal diversity: Number of ECM types ranged from 2 to 13 among the
sites and examples of ECM are given in figure 3. However, mean ECM types per treatment ranged from 4 to 8 and was not significantly affected by fertilisation, irrigation or water availability .
Soil P status and ECM Pase activity: As expected, mineral P
availability estimated using
Olsen P was increased in soil receiving regular N and P
fertilisation (not shown).
Interestingly, total content of organic P was clearly increased by the P fertilisation supplied regularly (P) and by irrigation (Fig. 4). ECM Pase activity was highly variable but a significant difference was only found between irrigated plots and non
irrigated plots (Fig. 4),
suggesting that the regulation of this activity may depend on numerous soil factors.
Figure 2. Effect of human practices on root growth of P. pinaster in spodosol. Mean differences are tested against control or not irrigated treatment using Student-t-test.
Figure 4. Effect of human practices on soil Organic P status and Pase activity of ECM from P. pinaster.
Mean differences are tested against control or not irrigated treatment using Student-t-test. Figure 3. Examples of ECM sampled on P. pinaster roots.
1Rhizosphère & Symbiose, INRA-Agro-M, Montpellier; 2Ecologie fonctionnelle et physique de l’environnement, INRA, Bordeaux; 3,4Transfert
sol-plante et Cycles des Eléments minéraux dans les Ecosystèmes Cultivés, 3ENITAB & 4INRA, Bordeaux; 5Mycologie & Sécurité des Aliments, INRA,
Bordeaux; 6Laboratoire des Symbioses Tropicales et Méditerranéennes, INRA-IRD-CIRAD-Agro-M, Montpellier - FRANCE
Pooled core samples 0.5 cm sieve
Pine root sample
500 short roots Root length Soil sample Remaining roots Sub-sample in ethanol Total Root length, surface, DWt
Soil P status (Total P, Olsen P, Total
Organic P, 32P)
Sub-samples for Pase, BAM & ECM molecular analysis ECM classification,
counting
0.2 cm sieve
For all information, contact: Claude.Plassard@ensam.inra.fr
Acknowledgements: This study is financially supported by ECCO-PNBC (2005-2006 project), INSU, FRANCE
Control P N
Control Standard Not
irrIrrigated 0.2 0.3 0.4 0.5 0.6 FRLD (cm/cm 3) SRL (m/g) 6 8 10 12 p=0.37 p=0.03 p=0.03 p=0.44 p=0.006 p=0.07 p=0.03 p=0.44 Tot Organic P ( ug /g soil ) Pase (nmol pPNP /h/ m root ) Control P N
Control Standard Not
irrIrrigated 40 50 60 70 0 20 40 60 80 100 120 p=0.20 p=0.01 p=0.22 p=0.03 p=0.06 p=0.20 p=0.27 p=0.32