(ii)
THE. EFFECT OF COI PN BOUNDArY LAYEiU TrtANSITION IN A GAS
by
STEPHEN JAY KLINE B.A., Stanford
(1943)
M.S., Stantorci(1949)
SUBMITTED IN PA&TIAL REQUIRENENTS FOR DOCTOR OFUniversity
University
FULFILLMENT OFV THE THE DE(kEE OF SCIENCE
at
tne
MASSACHUSETTS INSTITUTE OF TECHNOLOGY
(1952)
Signature redacted
Signature o~t Autnor.-,..r...
.
... 0V I*# 3 *4 a0 ISDepartment ei Menanical Engineering
August 15, 1952Signature redacted
derti:riw ay.w....-...r...
Thesis Supervisor
Signature redacted
(5 I r7 , 1 4 4 - '4 INST. Tc
FEB 10 1953
itfB RA R*4 7 LI .1. .(i)
'Room 31--267
Massacnusetts Institute of Technology
Cambrage
39,
Wassachusetts
August 15, 1952
Proressor J. P. Den Hartog
Onairman, Committee on Graduate Students
Mecbanical Engineering Department
Massacousetts Institute of Tecnuology
Gambridge, MassachusettsDeaL Professor Den Nartog:
A tnesis entitled "The Muiect of Cooling on Bounmary Layer
Transition in a GasN is ke.eby submitted in paAtial fulfillment or the
requirements for the degree of Doctor of Science at the Massachusetts
Institute of Technology.
Very truly yours,
Signature redacted
Stepnen J. Kline38
ABSTEAGT
IHE EFFECT O1 COOLING ON BOUNDAhY LAYEA TdANSITION IN A GAS
S. J. KLINE
Sabmitted to the Department of Mecnanical Enginee.ing on August 15, 1952 in pa.tial fulfillment or tne requirements for the degree of Doctor of Science.
The effect of cooling on transition in the steady flow of air in the entrance of a smootn round tube has been investigated. xns were maae at diamoter iieynolds numoers varying from 50,000 to 106,00 and for levels of disturbance corresponaing to adiabatic tteynolds numbers based on tne length to the start of transition i. rom 500,000 to 1,800 O,. Transition was cleteLrined from log-log plots of local apparent friction
factor versus free stream Reynolds nunoerc based on length. Apparent friction iactoi s weie obtained ILom pressure measurements on twenty-one
carexully manuiactured static taps using a Foxboro micromanoeter. The local apparent triction factor is a measure ol. the pressure arop
along the tube aue to botn tne skin iriction and the cnange in the momentum Ilux or the flow arising irom changes in the velocity profile. Temper-ature differences up to 2700F were applied in these tests. The results of eight sets ol iuns are piesented. Eact set consists or three iuns wita all variables held constant but wall temperature which was variea
fiom run to run. Each set of runs is also compared to an adiabatic run made at te same diameter Reynolds number. No significant eifect of cooling on transition was found in any case.
For a gas the theory of stability based on vanishingly small dis-turbances predicts a large increase in the minimum value of teynolds number at wnich tne laminar velocity profile first becomes unstable on a flat plate wnen the plate is cooled. In addition the theory prediets that the initial rate of amplification of the disturbance is reducea
by cooling. While the situation in the entrance or a tube is not the
same as that on a flat plate, the benavior of the Ilow is very similar to that on a ilat plate in the early part of the tube entiance used throughout these tests. For the case of the maximum amount or cooling used in these tests, the calculations ol both Lees ana Van Driest for a flat plate indicate aigne. values or tie tteynolds number at wnicn the laminar velocity prorile first becomes unstable than the Reynolds number actually found at the beginning of transition. It woul, therefore, appear that transition may not be brought about by tne amplixication of unstable waves in this case. This suggests that study oi the non-linear terms ol. the differential equation will be necessary before tile mechanism o. transition can be fully understooa.
The present results taken ttogetaer witn tnose of otner investiggtors, primarily on tne effect of -neating, indicate that the effect of heating or cooling on transition is not likely to be signiricant in any normal internal flow. For the case of external flows some effect is found in the direction predicted by tne stability tneory. But the measured effect on transition, even wnen only very slight disturbances are present, is always at least one orcder of magnitude less than the eirect predicted
for the point at waich the laminar velocity profile first becomes unstable. Calculations concerning the point at wnien the laminar profile becomes unstable -shoula, therefore, not be used to predict the effect o aeating or cooling on transition at the present time.
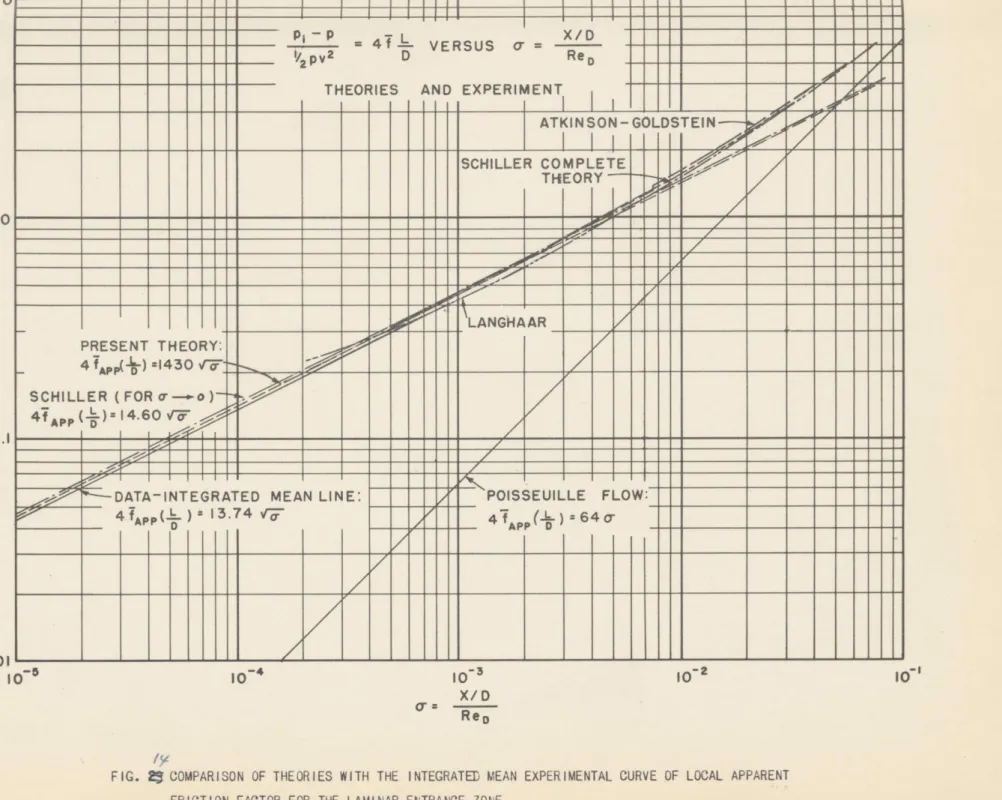
All the laminar adiabatic local apparent friction factor cata
ob-tainea for the entrance or smooth round tubes is correlated to + 6%
by the equation 41PReD
=
6.87/(
x/D)
in t ne zone x D 10. pe DeD
For the same region a simple theory based on flat plate-like behavior derived in Appendix D appears to give the best agieement with the data yIelaing tne equationj
4r
, e
=7.15/
.P D Re D
Thesis Supervisor: Ascher H. Shapiro
4 a
ACKNOWLEDGMENTS
The present investigation was mae possible by runas supplied by the National Advisory Committee Vor Aeronautics.
The author woulct particularly like to thank Pro:. A. H. Shapiro who not only prepared the proposal for this work, but also consistently
contributed ideas, time, ana encouragement. Prof. C. C. Lin, whose
theoretical work provides motivation for the present study, has
generously contributed guidance in the theoretical aspects. Mr. S. S. Sturgeon oi the Foxboro Company arranged for tne manutactu e and use of the Foxboro micromanometer free of charge and has been consistently cooperative and helpful in developing techniques tor its use in the present application. Mr. Harry Foust was oi considerable assistance in
the modification ot the apparatus and also aided in the taking o all the cooled aata ana in oari7ing oub the computations. Mebsrs. Hands, Mesmiankine, anck Baugh of the Las Turbine Laboratory Technician Staff were of assistance in the construction of the apparatus. Mr. H. K. Larson
assistea in the initial phases of the test work and by thorough
calib-ration or the Foxboro uicromanometer. Prof. . S. Taylor, Prob.. E. P. Neumann, and Prof. R. C. Dean arranged the use of the Gas Turbine Laboratory facilities and contributed many nelpful suggestions.
Mr. u. Dugan, Mr. G. Popper and Mr. M. Echardt assisted in the computations and the preparation of graphs. Mr. D. von tosenberg lent his time
and hot-wire anemometer equipment for use in measuring the turbulence scale and intensity.
TABLE OF CONTENTS
Page
I. General
A. Letter of Transmittal ...
(1)
B.
Title Page ... (ii)C.'Abstract
...
ii
D.
Acknowledgments ...1. Table of Contents. ... ...
(vi)
F. List of Figures ana Tables ... e...(viii)
II. Introduction
A. Summary of oxisting
Theory
... 1B. Definition of the Transition Point and the
Instability Point ... ..
2
C.
Object
...
*
2
D.
List of Symbols ...4
III. Description of Apparatus ...6
IV.
Test Procedures
A. First Group of xuns
-
(No Boundary Layer Suction)
1.
Adiabatic Us ...12
2.
Cooleduens
...B. Second Group of
aun
-.(Boundary Layer Suction).... 14
C. Accuracy of uesults Summarized ... 14V.
The Effect of Cooling on Transition
A. Behavior oi Flows in the Entrance Zone or
Smooth Kound Tubes at
High
heynolds Numbers....
.. 16
B.
Adiabatic Performance of Present System ... 181. First Group of
wins
(No Boundary Layer Suction)
18
2.
Second Group of iuns
(Boundary
Layer Suction) .21
3.
Demarcation of the Transition Point ... , 24C.
Effect of Cooling on Transition
Page
D. Summary of Other Data
-(Zfect
of Heating and Cooling on Transition) ...2?
.. Implications of the esults ... 31
1.
Internal Flows ... 0... 312. The Flat Plate ... 32
3. General Theory of Transition .,... 32
VI. The Local Apparent Friction Factor in the
Laminar Entrance Zone of Smooth Mound Tubes
A. iteview of Existing Theories ... 39B. Correlation of Present
itesults
... ... 42V11.
Conclusions ... ... 48VIII. Suggestions for Future Work . ... 51
IX.
Bibliography ... * 3..Appendix A - Biographical ... 57
Appendix B - Analysis of Data ...'... 59
1. Discussion ... 59
2. Development of Computing Equations ... 63
a.
Calculation of the Flow Coeificient
for the Contraction Nozzle ...63
b. Calculation of te, anc
ite
...64
c. Calculation oa 4* ... 65
APP
3.
The Proper Value of
xfor Landnar Flow
in the Entrance of a Tube forrJ'
0.005 ... 66Appendix C - Accuracy of the nesults ... 71
Appendix D
-
Development of Theories of Local Apparent
Friction Factor in the Laminar Entrance
Zone of a Tube
75
1. Transformation of the Equations to
the Correlated Form ...76
a. Schiller's Approximate Theory
75
b.
Present Theory ... 75LIST OF FIGURES
1.
Schematic Diagram of Apparatus
2. Photograph -
iight
side or Apparatus 3. Photograph - Lett side of Apparatus4. Photograph
-Foxboro Mioremanometer and Manometer Panel
5.
Photograph
-Foxboro Micromanometer
6. Photograph
-
Temperature and Heater Controls
7. Photograph
-
Test Section without Stirring
8. Photograph
-
Test Section with Stirring
9.
Photograph
-Bounaary Layer Suction Apparatus
10. Adiabatic Perfojmance of
systemBelow Pulsation,
4f
vs.
te
1. Adiabatic Performance or System Above Pulsation,
4ZAP vs.
he
12. Adiabatic Periormance
of
System All Data,
4
vs.
Re
IAPP
X
13a. Correlation
or
Laminar Entrance Data, 41
A(Rep) vs. 0'
13b. Correlation or Laminar Entrance Data, Comparison with
Theory and Best iRoan, 4X
(RD) vs.
-14. Mean Apparent Friction Factor, Comparison ot Iata and Tneories,
4XAWP(L/D) vs. (r
ecision or
Flow
Measurement, 4, vs 1/Rerect
or
Cooling on Transition at ReD
102,000,
" u U " ft V " 80,000
"
" " " "70,000
"t
U V"
U
"
"
59,000
" U "f U "t " U 51,000 " a "t " " " U 102,000"
""80,000
"t " "t " " " 70,000 Uv
"
"i
"
a"
59,000
" " " "f "t " "51,000
41
APP
V Vs. le . "t " N U " V " U "t U " U "HO
" e " "t U N ft U " N ii N15. Pr
Ex
16.
17.
18.
19.
20.
21.22.
23.
24.
25.
26. Comparison o the adiabatic performance of tie system b efore and after modiication at ReD 78,00
27. Exrect of boundary layer suction on the adiabatic performance
of the system after modification, D e 111,000.
28. Effect of boundary layer suction on the adiabatic performance of the system after moailication, keD *97000.
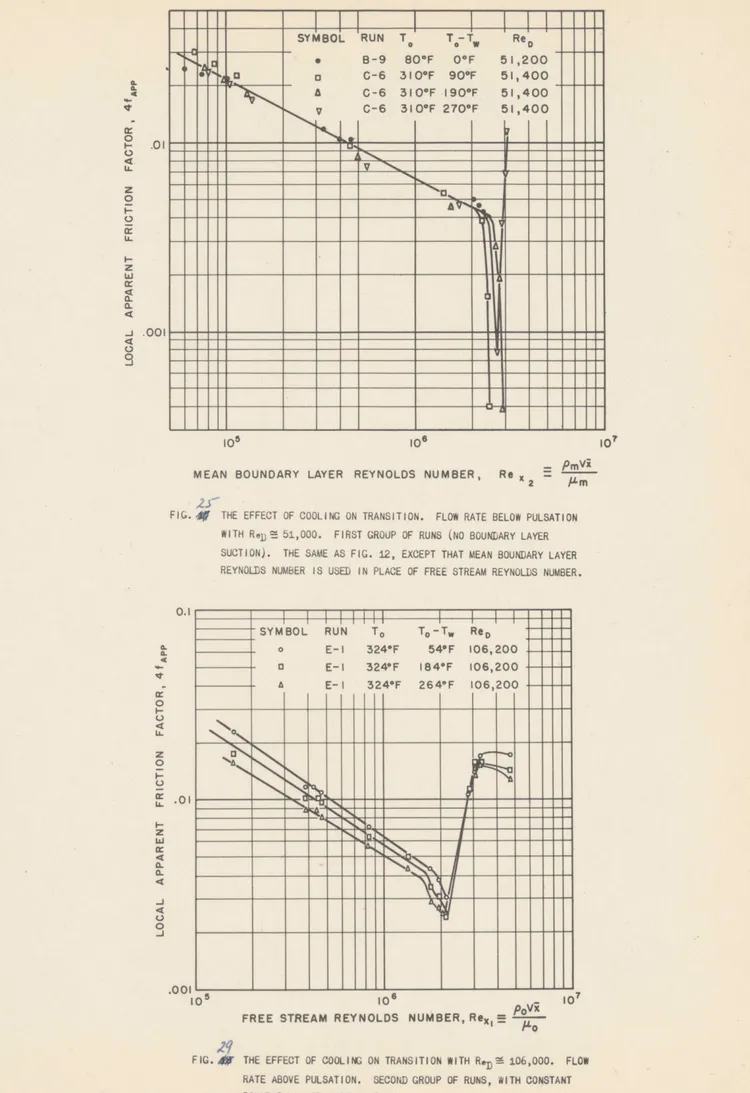
29. Tne efrect ol cooling on transition with constant boundary layer suction, ReD 106,000, 41'P vs. Re
30. The exrect of cooling on transition wita constant boundary layer suction, Re S 97,000. 4.P vs. he .
31. The effect oi cooling on transition with constant boundary layer 9uin lie = 106,O0, 4 AP vs . ite 2
32. The errect of cooling on transition with constant bounary layer
suction,
e 97,000, 4APP vs. ieX
33. Comparison of the cAlculated flow coefficient of tne contraction nozzle with tne recommended ASME curve.
34. Correction required to the aritnmetic mean of the tap distances to the proper x in the laminar flow near the entrance of a tube.
TABLES
Page Table I Summary of the accuracy of the results. ... 15 Table II Location of taps in the test section and the values of x
II. INTIODUCTION
A. Suiary of Existing Theory
The theoretical studies of Tollimien, Schlichting, Prandtl (1)* through (4) and others have shown that beyond a certain critical Rteynolds Number the laminar boundary layer becomes unstable to small disturbances in a certain critical frequency range. This remarkable mathematical theory has been verified beyond question by the experimental work of Schubauer and 8kramstat,(6), and Lielmann (9) and (10). More recently Lin, and Lin and Lees (5) and (7), have improved the mathematical theory and extended it to cover the case of the compressible fluid. Lees (8)
and Van Driest (12) have carried out numerical calculations showing
the effect of heating or cooling on the critical "eynolds Number at which the boundary layer becomes unstable for the flow ol a gas past a flat plate. both Lees and 4an Driest find the critical meynolds
number in gases to be greatly increased by cooling and greatly decreased by heating. Bat Van Driest's calculations show much less eilect, par-ticularly of cooling, than do Lees. The technique employed by all these theoretical investigators is to introduce a small perturoation into the airferential equations of motion, discard tems involving disturb-ances to the square, and then determine whether the disturoance increases or dies out with increasing time. The theory is thus able to predict the point at which the laminar profile becomes unstable to vanishingly small disturbances but is unable to predict the location of the trans-ition point or how a laminar boundary layer will behave in the presence of large disturbances.
* Numbers in parenthesis refer to the bibliography
B. Detinition of The Transition Point and The Instability Point.
In any discussion
ol
transition
the
distinction between the
trans-ition point and the point at widcn tne laminar prorile becomes unstable
to small disturbances must be kept clearly in mind.
At the point where
the laminar profile becomes unstable the disturbances present may be
very small. In this case turbulence will not appear immediately, but
will start considerably further downstream after the disturbances have
had time to amplify.
In this discussion the point at which turbulence
first begins to appear and the velocity profile begins to change from
laminar to turbulent will be relerrea to as transition point. The point
at waich the laminar profile first becomes unstable will be called the
instability point.
It should be noted that if transition occurs by
amplification
or
unstable waves, the transition point must lie at or
downstream
oi
the instability point.
C. Object.
In
most technical applications the transition point is or interest
rather than the instability point. The theory cited above gives nodirect information about
the
transition point. It does predict that
the initial amplification of unstable waves is proportional to the
one-fourth power 91 the reciprocal of the ieynolds number at the instability
point. Thus if the heynolds number at the instability point
is increased
by cooling, one might surmise from tihe theory that the heynolds
number
at the transition point would be increased even more.
Such a delay or
the ueynolds number
ol
the transition point would be
oi
considerable
importance in many technical applications since the primary design
par-ameters such as the skin drag and local heat transfer coefficients
'S
depend strongly on whether the flow is laminar or turbulent. Examples where direct application could be made are: cooled turbine blades or
airfoil sections, aircraft oil coolers, and gas turbine plant regenerators and interboolers.
Since the present theory is unable to predict directly anything regarding the transition point, it, is necessary to resort to experiment. The primary purpose ol: the present experiment was to investigate -he
practical possibilities of delaying transition, and thus increasing the ieynolds number at the transition point, by cooling the laminar boundary
layer in a gas.
The present investigation was carried out in the entrance zone of a smooth round tube. A tube was used primarily for simplicity. However, many of the important tecknical applications are actually of this geometry
and in addition the klow near the entrance of a tube behaves essentially like that on a flat plate. A second objective .of the present
investig-ation was to obtain better data for the local apparent friction factor in the entrance zone of a tube than that measured by Shapiro and Smith (26)
List or Symbols
A
cross sectional area of tube, ft
2.CD
flow coefficient of the contraction nozzle, non dimensional.
Cf
skin drag coeffieientLr
w
- , non dimensional.D diameter ol the tube, tt.
g)
indicates an unspecified Vrnctional relation
4PP
apparent local
riction factor, non dimensional, defined
by the equation: 14 (' Bp
4T mean apparent
frietion
ractor up to a section x L, nondimensional, defined by the equation:
44
APP
/
APP
Re
Reynolds number based en length from the tube entrance and
free stream properties, LO?.2
,non dimensional.
ie
Reynolds number based on length rrem the tube entrance and
properties taken at the aritbmetic mean or streax and wall
temperatures, V , non dimensional.Re D
Reynolds number based on tube diameter and free stream
prop-erties, POV V
non dimensional.
p
static pressure at the section x, psia.
Pi
static pressure at the entrance to the tube, psia.
po
total pressure in the stilling chamber, psi*.
Q
volume flow rate through the test section, It,/see.
0 0
T
total temperature in the stilling chamber,
or
F,
abs.
i
axial velocity at any section x and y, rt/soc.
5.
V
one dimensional velocity in the x direction, Q/A, rt/sec.
w
mass flow rate in
tae test
section, lbs/sec.
x
axial distance down the tube from the entrance, ft.
x
proper distance x for a measured value of local apparent friction
facter, ft.
y
radial ooerdinate in the test
section measured from the wall, ft.
ei'
boundary layer thickness, ft.
viscosity, lbW(sec it).
0 density, 'lb/ft3
.
entrance parameter, (x/D)/ReDp non dimension
kinematic viscosity,
ft2/gee.
w
snear stress at the wall, lb,/'t
Subscripts:
( )
denotes a free stream condition whica is essentially
tue same
as stagnation in these tests.
(
)m
denotes a mean taken at the arithmetic average of wall and stream
temperatures.
Special torus:
The term "Reynolds nmber" will always mean Re
unless otherwise stated.
ReD will be referred to as "diameter Reynolds number.
The term *transition point" Will mean the point at whica the velocity
profile begins to deviate significantly XroM that ol laminar tlow as
evidenced by a change in the local apparent riotion factor.
The te.Lu *instability point" ill
mean the point at which the laminar
profile first becomes unstable to a vanishingly small disturbance of
any frequency.
III. DESCfIPTION OF TEST APPAkATUS
A schematic drawing of the test apparatus is shown in Figure la.
The main components are the air supply system, air heaters, stilling chamber, test section, and instrumentation. A photograph of the heaters,
stilling chamber, and test section is shown in Figure 2. Atmospheric air was used in all tests. It was supplied to the test apparatus from 125 psia, 400 cim iree air reciprocating compressor through an after-cooler, eceiver tank, and approximately 150 feet of two. incr pipe. The air then passed through two vertical 12 kw air heaters in series
and through two inch piping containing three short radius elbows with the same direction or rotation. The .low was carried Irom the two inch
diameter to a 9 1/2 inch diameter by a 7 degree conical diffuser made of sheet metal inside the first section of the stilling chamber. The
flow was next smoothed by a 9 1/2 inch diameter honeycomb made of an
annular shell tightly packed with aluminum tubes. Each aluminum tube hag an inner diameter of 0.196 inches, a length o. 8-7/8 inches and a wall thickness ox approximately 0.0004 inches. The small tubes give a
high length to diameter ratio in a small distance ana also maintain laminar flow in and between the tubes for all available flow rates. The honeycomb is Zollowed by 15 aamping screens made of monel screen
soldeeied to annular Aings of 9 1/2 inches inner diameter. All the
screen retainers and the noneycomb shell were cut from a single piece
of steel tubing and reassembled inside a section or 10 inch steel
pipe which acts as a pressure shell. A large n uber of screens was employed to maintain a low turbulence intensity at the entrance to the
7.
by the valves, air heaters, and elbows in the upstream flow system. The screen used was of
mesh
ana wire diameter such that it shoula notshed vortices for any available flow rate acording to the data of refer-ence (28), (29), and (30). The stilling chamber and piping downstream from the heaters were coverea with xour inches of Aibreglas insulation and sealed with a coat of Insulag. This was sufficient to reduce the temperature drop between the main flow and the stilling chamber wall to a few per cent of the total temperature difference. A diagram of the stilling chamber is shown in Figure lb.
Velocity and temperature traverses were made at the exit plane of the stillibg chamber before the initial assembly of the test section. The velocity profile was found to be flat to within less than 2 per cent
except in the bogdary layer wicn extended 0.1 to 0.15 inches xiua the wall. The temperature prorile was flat to approximately l*F except in the boundary layer even when the most uneven neater element combination was employed.
Alter the tests haa been completed an attempt was made to measure the intensity and scale oi turbulence in the exit plane of the stilling chamber. The only net wire asemeter equipment available was designed for application to flows or bigner- turbulence intensity and scale.*
Gon-sequently the actual value or scale in te apparatus could not be measured and the intensity measurements except in the boundary layer were almost
entirely masked by the random electronic noise intrmaueuee by stray electromagnetic radiation. It was found however that the a cale was
considerably less than 0.015 inches for the range of hlow rates used in the tests. The turbulence intensity u/I in the boundary layer along
8.
tae
stilling chamber wall was round to be approximately
0.003
for low
flow rates and 0.02 lor flow rates. corresponaing to the highest used inthe tests.
The turbulence intensity inthe
core of the flew was completely masked by the random noise output on the electronic voltmeter at all flow rates. If the actual voltage due to the turbulence is taken as the order of the least eount of the voltmeter (and it was apparently not larger than this), a value of u/l of 0.005 to 0.001 is obtained. This is the order of the design turbulence intensity.From the stilling chamber the flow passea through the contraction nozzle. The contraction was achieved in two steps: the first from
9
1/2 to
3
inches and
the
second fircm
3
to 1 1/4 inches.
2acW step
was designed to completely avoid positive pressure gradients using the data or keuse and Bassa (35). In the second group el tests a boundary layer -maetion piece was inserted between the stilling chamber and the the contraction nozzle. It consists of two pieces of 248T aluminum machined to give a 0.125 long nozual boundary layer suction slot bqtween them. The slot was designed according to the co-mendations of Loftin and Burrows (33). Ine flow was moved from the slot tarough twelveaxially symetrie holes and led out through equal lengts of 1/4 inch tubing to a header. Prom the header the flow was discharged through a standard ASME flange tap oeifies plate and a control valve. The contraction
wirh
nozzle *ae the boundary layer suction apparatus installed is shown in Figures 9 and lk.
The contraction nozzle was smoothly joinea to the test section by press fitting and forming tne last part of the contraction contour ever the joint. The test section consisted of a piece of seamless brass tubing 60 iiches long ana 1 1/4 inches in inner diameter with a
one-9.
eighth inch thick wall. The test tube had twenty one static pressure taps ot 0.020 inches in diameter. Except for the first few taps the
spacing was arranged to give a distance between successive taps of approx-in ately twelve per cent of the length irem the inlet of the t.t s ection. The taps were lecatea en a helix with 700 of are between suenssive taps
so that no two taps lie on the same axial line. All taps were macte with extreme care by four stages of alternate drilling of the hole and lapping of the inside of the tube to insure freedm irom burrs. The
test tube was finally polished bright inside. The test section was enclosed in a tank wvica could be filled with water to centrol the test tube wall temperature. The tank is also supplied with air Jets to agitate
the water and maintain uniform temperature. The test section with the stirring tarned off is shown in igure 2 and with the amount of stirring noinally used in Figure 8, A diagram of the test section is shown in
Figure le and the tap locations given in Table II.
The pressure taps were connected by a manifold system to the Foxboro micromanometer. The manifold system had two needle valves in each line and was so arranged that each pressure tap could be connected to either meni old box. The maniiold system and Foxboro nieromanometer are snown in Figures 4 and 5.
Flow measurement was obtained by use ei three manometers and a temperature measurement system. Either ox two manometers with dii fering
ranges could be used to measure the pressure drop across the contraction nozsle or across a standara ASNE tlange tap oririce plate installed
up-stream of the heaters. The third manometer was used to measure the total pressure in the stilling chamber. The temperature measurement system
10.
consisted of iron constant themocouples comnected tarough an isothermal zone box and a Leeds and Northrup thermocouple switch to a Leeds and Northrup type K potentiometer and iQWicen Spotligit alvanometer. A water-ice relerence junction was always employed. Tne manometers and temperature measurement system are snown in Figures 3 and 6.
The most important instrument in the measurement' s xrietion factors was the Foxboro mireanometer. The instrument usea was a pilot model custom designed for this application and supplied rroe of charge through the generosity W: the Foxboro Opmpany, Foxboro, Mass. It measures
pressure dirferences witA an uncertainty interval based on 20 to one odds* of 0.0008 to 0.001 inches of water. The range of the instrument is now 2 inches of water but can be extended to 6 inches of water with
slight modification. It can be used at static pressures up to 150 psia. Figures 4 and 5 show the essential f eatures of the instrment. It operates
as a null device. An applied pressure difference causes a change in the elevation of the water in the two glass tubes. Te float in tae right tube moves with the water. The coil surrounding the float is then man-ually repositioned by movement @1 the precision mierometer at the top of the carriage until the output oz an inductance bridge of whien the coil is one-4uaf is again zero. The signal Iroa tUe briage is sensed by a phase-sensitive circuit and amplified in a portion of a standard SR-4 strain gage ndioator. The output from the amplifier is sne-a on the 51-4 galvanometer. The circuit is arranged so that one division on the SR-4 galvanometer corresponds to approximately 0.002 inches of micrometer travel. A more complete description of this instrument and analysis of its accuracy is given by Larson (42) in a thesis done as a part of this study under the supervision 6f the present author.
11.
The uign precision oX the present work was made possible by tue use of tue FoXbore uiermanemter. The instrument perforueao in a very
satisfactory manner througnout the, tests. It is simple to operate, accurate ever a wide range of pressure ifferences ana static pressures, and readily adaptable to automatic operation. The Foibero Co. is new marketing a fin4 neal of this instrwment witu an improved. mechanical
carriage which redcues the uncertainty interval based on twenty to one odds to the order or 0.0005 iness of water.
IV.
TEST PROCEDUES
A. First Group of RMNO (No boondary Layer Suotion).
I. Agabatic &%is. After preliminary runs were made and t1e leaks reded to a satisfactoL-y level, ten Lns were made to determine the adiabatic performance of tue system. In those runs the empressor was run steadily at vull capacity ana tiae excess air by-passed to maintain steady ilow. Neasuremeats were tnen made or tue pressure drop between tie various taps using the Foxboro Micremanemeter. Cincident with each pressure drop measurement tke total temperature ana pressure in the stilling chamber and the pressure drop across the centraction nossle were recorded. kom temperature and barometric pressure were recorded from time to time. In general measurements or pressure drop in the tube were taken in sets er three in such a way -tat two er them coln be checked against the third. For example, measarements might be taken successively between taps 1 and 2, 2 and 3, ana 1 and 3. Tke Uirst twe readings were then added to check against the thira. Ir a check was not obtained to .0015 inches of water, the readings were in general repeated. In a few cases, where the reaoings were greater than 0.200
inenes of water, discrepancies up to 0.003 inones of water were not repeated.
In eacin run a reading was taken wita tie same tap connected to both legs
of the Foxboro Micromanometer at the beginning and end or each run to further insure that the system was initially and finally without signi-rioant leaks.
2. gooled Auns. The p'ooedure in the cooled runs was essentially the same as that in the adiaoatic rtms with the addition of temperature
13.
measurement on nine thermocouples. Three e these
thermocouples
wereinstalled in tangential slots in te test tube wall and carefully soldered. ever. Three were used to check the temperature e the contraction
nossle and the shoulder
joining
it to the test tube. The last three were used to check thermal equilibrium in the stilling chamber. One additional therseceuple vas installed in a manitrld box to insure that the air reaching the Foxboro micromanomter was not hot. Neosurements on this thermeeuple were made only in e xirst two coeled runs since no measurable temperature increase was Lound.In all cooled runs a warn up period or approximately teur hours precedea testing. During this time temperature readings were reoos1ded approximtelf every malt aeur ana the various controls adjusted. Air temperarur. was usually controlled to a value of approximately 325*F. Despite the radial slots cut in the small end of the contraation nosle
as insulation, it was found that end conduction from the test section
lowered the equilibrium temperature of the contraction nossle to a value
about half way between the cooling water an the air stream temperatures. To overcome this three 110 volt AC electrical heaters were installed
on the contraction nossle each controlled through a separate variac.
The variacs were trimmed to maintain th contraction nozale at
essen-tially air stream temperature.
When thermal equilibrium had been mached, three complete sets of data were taken. All variables were neld constant througa all three sets except wall temperature. Tne three wall temperatures, corresponding to the three sets of data, were obtained by filling the tank surrounding the test section successively with hot water, air, and sold water.
when water was used as a coolant a trickle or air was bubbled through as a stirring device (see Figure 8). To eneck that tais amount of
stilring aid not eilect transition, te air was turnea on an oil several times and measurements repeated at points near the end of tae laminar
zone. This was done in several runs and with amounts of stirring con-siderably greater than normally usea. No shift in the t ransition point was tound.
B. Second Rou of Ruas (Bounaaiy Layer Suction).
In this group ot runs all procecures were the same as described for the rirst group bat in aadition the flow turough the boundary layer suction slot was Aela constaat tarougeut all taree ot tae sets ot cata in each run. The ilow rate through the boundary layer suction slot was measured by use oi a manometer eonnectea to Uhe orifice plate in the
discharge line ana by measurement of total pressure ana temperature in the header preceding the orifice.
C. Accuracy of tue kResults
umiarised.
A discussion of the acauracy of the results is given in Appendix C. The conclusions reached in that appendix are sumuarizea in the nomenclature
15.
TABLE
I.
Result Uncertainty Interval for 20 to 1 Odds as a Per
Gent
of iesults for muioh Speciried.Low Flow Rates Nigh Flow Rates
near entrance near exit nea entrance near exit
Rex
3.
2.
2.5
1.
4'
APP5.
2.
5.
2.
4APP(ReD)
6.
3.
5.5
2.5
3.
2.
2.5
1.
16.
V* THE EFFECT OF COOLING ON TRANSITION
A. Behavior of Flow in the hntrance Zone of Smooth Round Tubes at MIgh
y~nolds Numbers.
Shapiro and Smith (26) investigated the local apparent friction
factor in the entrance section of smooth round tubes. They
found
a
zone near the entrance wlnere the boundary layer was laminar inaicated
by a straight line with a slope
or approximately minus one-hall on a
log-log plot or local apparent friction
factor versus Reynolds number.
The laminar
some
extended to 4ynolds
numbers
between 100,000 and 500,000.
It was
followed
by a rapid 'increase in
local apparent friction factor
tarouga the transition region. The local apparent friction factor
then decreased again along a line with a slope
of approximately minus
one-fifta in
the
turbulent entry
some
and finally approached the
Karman-Nikiradse Iriction Xactor as the velocity profile became steady.
It should be noted that the local apparent friction factor is not
the same as the skin drag coeiricient of aerodynamics. The velocity
profile in the entrance sone
is not steady
but changes
as
the flow
moves down
the tube
causing a pressure onange
due to the change in the
From
momentum IluxAsection
to section. Since the square velocity proxile
at the tube inlet has
the
least momentuml lux or
any profile for
a given
flow rate, the momentum changes in
theentrance section cause a drop
in pressure
in
addition to that due to friction. The local apparent
friction Lactor is derined by the equation:
IC
dP/d(x/)
17.
It is thus the sun ox the pressure drops due te mentumn change; and rriction and is always greater tban the skin rriction ooetricient in the laminar entrance zone.
In the present work it was decided to utilize the characteristics ox
the
entrance Sone O tubes to studythe erect
*1 coolingen
t ransition. All tests were run at low veloities to eliminate the additional oemp-lication ot Macn numoer. Teperature ditrerences up to 27007 were applied.In order to create a oonaition as like that of the theory of small dis-turbanoes as possible considerable care was taken to make the flow as Iree from aisturbance as possible (see aescription of apparatus above).
This resulted in Meynolds numbers at t transition point varying irom 400,000 to ever 3,750,000. The large variation was (me to the cnange in the disturbance level ox the stream as the 11ow was aLtered, to certain moifications that were made between the first and second group of rums, and to the use of boundary layer suction in the second group o' runs. The distinction oetween he first and second group of runs is that the
joints in the contraction nozzle were further lapped and the boimdary layer suction apparatus was added between the two groups of runs. In the first group of runs no boundary layer suction was used; in the second group o1 runs constant boundary layer suction was applied. Since the adiaratic performance of the system was not the same in the first and second groups of runs, it is necessary to describe the two groups of rims separately. In the following discussion the adiaoatic perormance of the first group ana then te secona group oi runs will be described xollowed by a discussion ox tne results obtained in the comparable cooled runs.
18.
B. Adiabatic Performance ox Ue Present System.
1. First GrOIp
.r
'uns (No Boundary Lay r Suction)*
Five
prolix-inary runs were made tox the purpose of leariing tAe best teonniques foi testing and to eliminate difficulties f rom the system. AteL theseruns woL e completed, seven adiaoatic runs were made with diameter
Aeynols
nambers varying irom 50,000 to 113,000. Ten cooled runs were then made eaca with two or three different wall temperatures. 0 these runs four were discarded. The irst run was discarded because adequate temperature control was not maintained. Tue 1i1th run was discaraeu because a leak developed in the test section at a soldeied shoulder during the run. Tae last two runs were made at a total pressure ez two atmospheres.At this pressure adequate pressure cnecks between sets or three taps could not be obtained and the scatter ol the data increased greatly. This was attributed to tAe inereased ellect o. undetectable leaks in
valves and rittings at high pressures, and these runs were discarded. In all these discarded runs no evicience contrary to that in the results presented could be disoerned. Alter the completion of these cooled runs three more adiabatic runs were made. Tais completed the first group of runs.
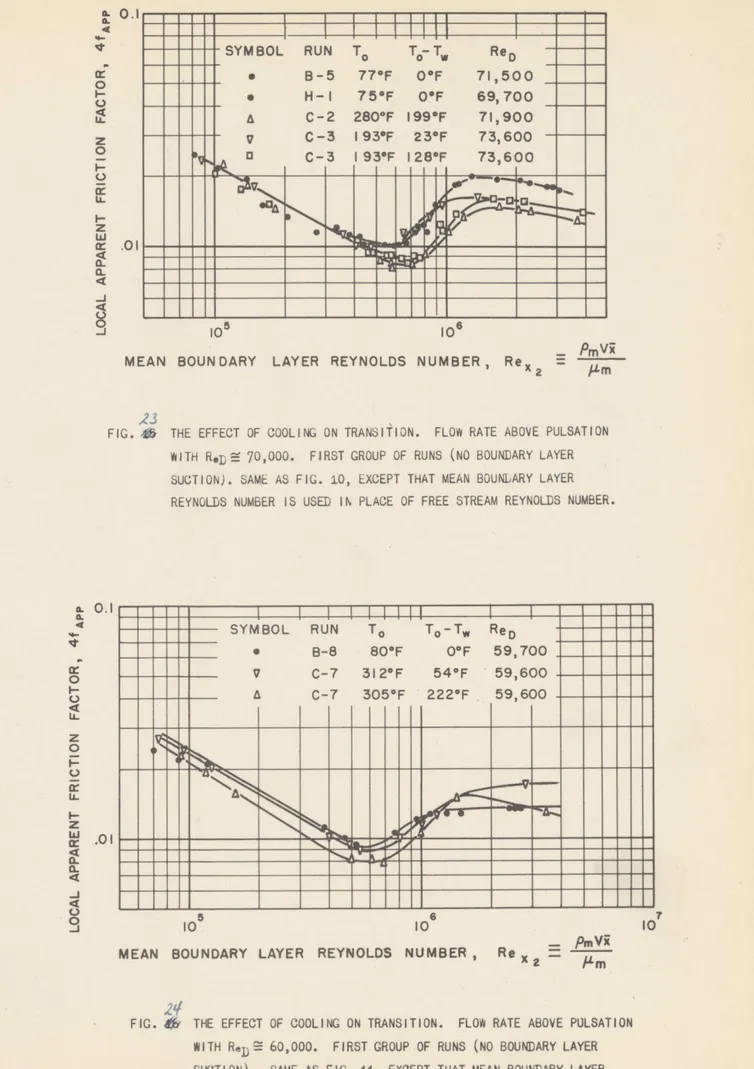
Tue adiabatic carateristics oX the system er the rirst group or runs is shown in Figures 10, 11, and 12- These are all log-log plots oX apparent rriction lactor versus tree stream Reynolds nummer. The points shown n those plots were computed rro the data as des-cribed in Appendix B. both the data and the computations are on rile
19#
in tro Gas Turbine Laboratory at the Massacausetts Institute or Teonoloy. The point lnere the transition begins is taken to be the point
at wkien tiao data deviates recO te straigat line with a slope of approx-imately minus one-nalf. In Figure 10 it will be seen tuat this point occurs in all runs between 475,000 and 550,000. The value increases steadily as the diameter Reynolds number uw decreases. In Figure 11 the transition Reynolds number varies from 1,600,000 to something
greater than 2.300,000 again increasing with deoreasing diameter Reynolds number. All tie adiabatic data from the rivst group or uns is ariown on Figure 12. Tn figure clearly suows a sudden jump in tae value of the t ransition Reynolds number wricf occurred in tne initial adiabatic runs at a diameter Reynolds number oi about 65,000. At this same
nlow
rate an audible pulsation with a rrequency or approximately 2 cycles per second occurred in the ilow and could be observed on the manometers whica were normally exceptionally steady aue to the action of the stilling chamber. For all flow rates-below that or the pulsation the uynolas number at the transition point was of the order of 2 x 10 ; for allflow rates at or a ove that of tne pulsation the Reynolds number at
5
tie transition point was or tao order of 5 x 10 . Tne sudden decrease in the transition Reynolds number witu increasing 'low was attributed to tne some portion ox the tunnel reaciing a critical eynolds number at waica vortices were aned or the ounaary layer became turbulent. The increased disturbince tien caused te decreased t ransition Reynolds number. The audible pulse occurred because the end or tre tube was open
to tile atmosphere and tnere anarently was a narrow range of flow for wnica neituer regime oi rlow in the test tube gave a nead loss matoning
that
of
the supply pressure.
It was suspecte tnat a transition occurred
in tne boundary layer on the sidewall of the
stilling
chamber becaltse
the wall
was known to be rough at the screen joints ana the neyn6lds
number based on length down the stilling
cnamber
wall was ot the order
of
100,000
for
the flow rate corresponding to the pulsation.
It snould
also be noted that the diameter iteynolds number at which the pulse occurred
gradually decreased with time. This is shown by run B-8 taken on the
last aay oi tne rirst group ox runs. Run B-8 was taken in tne zone
where the auible pulse occurred ana was at a diameter Reynolds number
or
59,700.
The transition Reynolds number is seen to be
at approximately
500,000.
This small and very gradual deacease in the critical value
or diameter Reynolds amer is believed due to the accumulation or dirt
in the tunnel.
Tnis change in the ilow regime allowe tests
o
the exiects
o0
cooling
at what amounts to
aiix
erent levels oi disturbance in the tunnel.
Un-rortunately it also limited tne diameter Reynolds number range over wnicn
gooci tests could be made.
This was
due
to
the
tact that -tests in which
the transition begins nearer than six incnes to or more than I'orty inones
irom the entrance do not allow enough points in tne various zones to
verify the behavior beyond question. Tfe maximum useful diameter Reynolds
number was approximately 100,000 giving a transition point about six
inches down the tube.
As the diameter Reynolds number was cieereased,
the transition point moved
slowly down
the
tube reaching 12 or 13 inches
at a flow rate Just above that oi the pulsation. As soon as the klow
rate was decreasea below that oi the pulsation, the transition point
moved out to approximately 35 or 40 inenes. Witn only a twenty per cent
iurtner decrease
in flow rate the transition point moved on out the
end of the tube as shown in runs B-6
and B-9.
As a
21.
result the data taken in te fL st gioup or runs wita transition Reynolds number of the order of 2,000,000 migat be subject to some question in
interpretation.
2. gecond Group of tuns (Uoudary Layer Suction). The second group of runs were undertaken to verify tae Lesults obtained at hign values of transition Meynolds number and if possible to test at still higher transition Reynollas numbers. For this purpose the boundary layer sution apparatus described &bove was constructed and installed. In the required disassembly it was found that some oil residue and dist had accumlated
on the spacer retaining the screen rings juat ahead of the contraction nozzle . This was probably te cause ol tile gradual lowering in tre
critical value et the diameter Reynolds number with time. It was also noticed that a discoloration nad occurred in one sone just behind the joint of the test tube to the contraction nozzle and that the converging portions of the nozzle had accumlatea a tin film of sludge and very
ine dirt particles. All of this dirt was removed. In addition both joints in the contraction nozzle were further lapped) About one day
oeing spent en eacn joint. The entire contraction nozzle and test section were then polisned bright on the inside. At the end of this operation neither joint could be found by touch.
The adiabati..periormance of the system during the second group of runs is shown in Figures 26, 27, and 2. The behavior of the system was aiflerent ler each oi tour zones oi ilow rate. The Uirst zone extended
from no ilow to. a ilow rate corresponding to a diameter fieynolas number
o approximately 80,000. In this zone laminar low extended down tae entire lengta of the tube for all rates of flow through the boundary
22.
layer auction slot. jun D-2 at a diameter ueynolds number of 78,000
is snown in Figure 26. Figure 26 snows laminar flow extending to a
Asynolds number of at least
3.75
x 10
*wnD-2 was taken with special
care using vi.tually all tap combinations to provide a new oheck on tap
periormanee and to obtain
e
best possible apparent local I rition
iactors for Us laminar entrance sone. The appai-ent frietion iactors
measured in this ran are believed to be tae best obtained not only
because ot the care used but also because the ilow rate was high enough.
to give very good precision or measurement in the pressure drops
for
all but a tow points and because there was no turbulent lw anywhere
in the pipe to act as a disturbing influence.
For flow rates in the zone of 85;000 to 100,000 diameter uoynolds
number an auaible pulsation again occurred in the system at a frequency
of approximately two cycles per secon
if
no boundary layer suction
flow was used. The pilsation persisted over a wider range than in tae
rirst group oi tests. Tnis was probably due to the nature
oz the
disturbance imposed
by
the boundary layer suction slot as compared to
the spacer it replaced in acting as a trip on the boundary layer along
the
stilling chamber wall. The fact tat
tae pulsation occurs at roughly
lixty per cent greater low rates ,is believed due to the improvement
of the joints macte at the end of the stiing
chamber when the boundary
suction system was installed.
At low rates above the pulsation zone, te
transition point occurred
at a Ireo stream aeynolds nuber or approximately 700,000 when no boundary
layer suction was applied as shown by the curve marked q stqbion/Qt. tOp
in Figures 27 and 28. This increase in the transition aeynolds number
ecmpared to that in the i:irst gioup of rmns ter tae zone above pulsation
23.
ilow was probably due to the rrther lapping ot the joints in tne contraction nosle. Application 01 bounda7 layer suction in the some ot flow rates corresponding to diameter ieynolds numbers irea 85,000 to 125,000 brougat about a marked increase in transition ueynolds number. This is shown in Figures 27 and 28 were tae transition Iteynolds number
6
is increased Xrom 700,000 to 1.8 x 10 by application of boundary layer suction. In general there is an optimum amount of boundary layer suction flow which gives Ue greatest neynelds number at the transition point. Although for any amount oi ilow gr eates. than a certdin critical amount, the change in the transition Aeynolds number was not significant in this system. This was probably due to the low flow rate through the boundary layer suction slot even at full 1ew. In the zone of flow rates giving a pulsation wita no boundary layer suction flew, the application of any amount of zhow tirougn the boundary layer suction slot greater than tae critical amount would elimate the pulsation in tne main zilow entirely. In the some of flow rates greater than that at which pulsations occur, but less than that for a diameter neynolds number of 125,000, application of increasing amounts of boundary layer suction ilow would first cause no change then bring about a pulsation and finally eliminate the pulsation
was
again. Tnis series of events accompanied in each case by an increase in the ueynolds number at that transition point from approximately 700,000 to 2,000,000. This is a good verification of the theory proposed above to explain the sudden Jump in the transition Meynolds number enountered in the first group of tests.
For flow rates above that corresponding to a diameter usynolds numoer of 125,000, boundary layer suction was no longer effective. The neynolds number. at the transition point remained at approximately 700,000 for all rates of boundary layer suction flow available and no pulsation could be induced. It is probable that the zone of application of the
boundary layer suction could have been somewhat extended by use of a
suction pump on the discaarge of tne boimdary layer suction line. However, it was felt that the important thing was to test the elfect or cooling at the highest possible transition Reynolds number. And since increasing the flew rate in general decreases the Reynolds number at the transition point, no gain was to be expected by testing at higner flow rates.
Accoraingly two carefml cooled runs were made using an optimum amount
e boundary layer suction at diameter iteynolds numbers ef 97,000 and 106,000 This completed the second group or imns.
3. DRMarcation or te Transition Point* In comparing Figures 10, 11, 12, 26, 27, and 28 it will be noticed tnat in some instances the iriction taater first deviates d1wnwara I.em the laminar line before increasing to the turbulent value. In oter instances it does not.
This downward deviation is believea to be due to a momentum elfect assoc-iated with the onset of transition. This belief is strengthenea by the fact that the devnwara dip is always more pemounced for those runs where the transition heynolds number is iagner. For these cases, tne bounaary layer tl'be thicker and a change in velocity prorib within the boundary layer would thus exert a greater influence on the momentum
xlux and pressure drop. There seems to be little unifreimity concerning the amount of decrease in the friction factor. This would be expected
since it depends in a large measure on the exact location or the pressure taps vita respect to the beginning oi transition. This same large
decrease in apparent iricti6n ractors nas been iouna by [aye, Toong, and Brown in current investigations of neat transfer and I riction data in supersonic air flow in tubes at M.I.T. The transition point in tUe
present tests has been taken as the point where the apparent friction
factor deviates from the straight line of laminar flow eitnex up or uovn on the log-leg plots o1 4i versus et. * This point is harci to aetermine
exactly due to the uncertainty in Ue data, and the finite number of: 'taps. Observations of te figures will snow that tue onset ox transition is defined in most oases to within ten or at most twenty per cent . To be technically significant as a means of controlling transition cooling would have to cause a shift of at least one and half or two times. An uncertainty oi even twenty per cent is, therefore, satisractory.
0. Irject of Cool n on Transition -, Present itssults.
The results or the first group or runs, without boundary layer suction, are shown in Figure 16 througn 25. Tne results or the a secon group of runs, with boundary layer suction, are shown in Figures 29
through 32. Each grapa snows a set of Lvns wita all variables nela constant. but wall t emperature. All te data is presented in two ways. For tie
first group of runs, Figures 16 tnrouign 20 are log-log plots or local apparent rriction ractor versus free stream aeynolds number while Figures 21 tmrough 25 are log-log plots o the same data snowing local apparent friction tactor versus mean boundary layer Reynolds number. Similarly, for the second group of runs Figures 31 and 32 show the same data as Figures 29 and 30 but Figures 31 and 32 are plotted on the basis of mean boundary layer instead of rcee stream Feynolds numbeA.L The distinction between the Reynolds numbers is that ree stream maynolds number is formed with the kinematic visosity corresponding to toat in the frictionless core or tie flow wile the mean boundary layer issynolas number is rotmed wita the kinematic viscosity based on a temperature
half way between that of the wall and of the irictionless core of tne
flow.
In Figures 16 through 25 and 29 through 32 the cooled runs presented
on each figure were generally made on the same day, one immediatelyafter the other to maintain all conditions as constant as possible.
But the adiabatic run for the same diameter heynolds number superimposed on each graph was necessarily made on a different day.
The graphs shown in Figures 16 through 25 and 29 througg 32 cover a range of diameter ueynolds numbers iron 50,000 to 106,000 and include cases showing xeynolds numbers at the transition point in the adiabatic flow from 500,000 to 1,800,000. All of these graphs show the same
resultst The free stream Reynolds number -where transition begins is not significantly changed py cooling; the mean .boundary layer heynolds number where transition begins is usually increased by cooling. The maximum increase in mean boundary layer Reynolds numoer where transition begins is or the order seventy-five per cent for an applied temperature diii er-ence of 270OF and a ratio of wall to stream temperature of 0.66. The increase in mean boundary layer Reynolds number at te transition point indicates increased stability due to cooling as would be predicted i rom the calculations oi Lees and Van Driest. But tne temperature viscosity Ve 10,hln
A is sun that the iree stceam Aeynolds numoer is not signiricantly enanged. In a row cases it will be observed that the i ree stream Reynolds nuiber at the transition point is actually deareased slightly by cooling
(e.g. Figure 30). Fromtine design point of view the significant thing is tae pysical location of the transition point. The physical location of the transition point was not signiticantly axiected in any of the present tests since the distance down the tube is proportional to the
rree stream heynolds number.
Taus while cooling appears to stabilize the ooundary laye, tne ellect is so small that it is just about compensated ior by the cnange in vis-cosity in the boundary layer aue to the cfangect temperature. The net errect is almost no shitt in the physical location or the transition