Assessing socio-economic risks in the supply chain of
materials required for vehicle electrification
by
Karan Bhuwalka
B.Tech, Metallurgical Engineering and Materials Science
Indian Institute of Technology Bombay , 2018
Submitted to the Institute for Data, Systems, and Society
and the Department of Electrical Engineering & Computer Science
in partial fulfillment of the requirements for the degrees
of
Master of Science in Technology and Policy
and
Master of Science in Electrical Engineering and Computer Science
at the
Massachusetts Institute of Technology
February 2021
c Massachusetts Institute of Technology 2021. All rights reserved.
Author
Technology & Policy Program Department of Electrical Engineering and Computer Science January 15, 2021
Certified by
Randolph Kirchain
Principal Research Scientist Materials Systems Laboratory Thesis SupervisorCertified by
Ronald L. Rivest
MIT Institute Professor Computer Science and Artificial Intelligence Laboratory Thesis ReaderAccepted by
Noelle Eckley Selin
Associate Professor, Institute for Data, Systems, and Society Technology & Department of Earth, Atmospheric and Planetary Sciences Director, Technology and Policy ProgramAccepted by
Leslie A. Kolodziejski
Professor of Electrical Engineering and Computer Science Chair, Department Committee on Graduate StudentsAssessing socio-economic risks in the supply chain of materials required for
vehicle electrification
by
Karan Bhuwalka
Submitted to the Institute for Data, Systems, and Society on January 15, 2021, in partial fulfilment of the
requirements for the degree of Master of Science in Technology and Policy
and
Master of Science in Electrical Engineering and Computer Science
Abstract
Modern automobiles are composed of more than 2000 different compounds comprising at least 76 different elements. Identifying supply risks across this range of materials is important to ensure a smooth transition to renewable-energy based transportation technologies. This thesis provides insight into how electrification of vehicles is changing their material composition and how that change drives supply risk vulnerability. To make these contributions, we analyze part-level data of material use for seven current year models, ranging from internal combustion engine vehicles (ICEVs) to plug-in hybrid vehicles (PHEVs). The dataset is one of the most detailed ones analyzed in academic literature with almost 360,000 records of material composition of parts. We provide a comprehensive, high resolution (elemental and compound level) snapshot of materials use in both conventional and hybrid electric vehicles.
We propose and apply a metric of vulnerability and find that the vulnerability to supply risks doubles as fleets shift from conventional to hybrid. We analyze three socio-political risks in the materials supply chain that are of concern to manufacturers and policymakers: a) the risk of supply concentration, b) the risk of conflict in the supply chain and c) the risk of modern slavery in the supply chain. We find that the prevalence of all these risks increases as fleets electrify. The fact that both the cost of supply chain disruptions (vulnerability) as well as the likelihood of disruptions (supply risk) increases is concerning for manufacturers and policymakers. Stakeholders should identify strategies to minimize risks in the supply chain such as material substitution, supply chain diversification and responsible sourcing of materials.
Thesis Supervisor: Randolph Kirchain
Acknowledgements
It’s crazy to think about how much I have learnt about the world (and myself) in the last two and a half years that I have been a student in TPP and an RA at MSL. I have the pleasure to learn every day at work from my fantastic advisors and I hope to continue to do that in the years to come. Randy, my supervisor, is the best I could have asked for. He’s been understanding and kind and has pushed me forward in every conversation we have had. An equally large thanks to my other research advisors — Frank, Rich and Elsa — and my TPP advisors — Frank (same man, different hat), Barb, Noelle and Ed. They have always been there to help me out and made me feel like I had a protective community in a new land.
I want to also thank all the great instructors I’ve had over these years: Prof. Rivest, Prof. Townsend, Prof. Knox-Hayes, Prof. Solomon, Prof. Oye, Prof. Hosoi, Prof. Chase, Prof. Jegelka, Prof. Autor, Prof. Angrist, Prof. Broderick, Prof. McLaughlin and Prof. Paarlberg. Most of all, I’d like to thank Siddharth Kara whose investigative reporting about cobalt mining in Congo and course on human trafficking inspired me to focus parts of this thesis on the labour abuses in mining.
The beauty of my time at TPP has been how much I have learnt outside the classroom from all my peers: Nico, who taught me to live in the moment and was always there with advice for the future. Gabe, who taught me so much about shoes, keyboards and everything in between. Frank (different man), who taught me about living simply and following the international drinking rules. Lydia, who reminded me to be kind. Benny, who taught me how to defend tactically in football and Brandon, who pushed me to be more confident. I have had conversations with all of my classmates and each of them have been rich and fulfilling.
The same is true beyond TPP for everyone else at MSL — Bensu, Jeremy, Greg, Terra, Jasmina, Josh, Liz, Tanguy, Hessam and Ehsan — thank you so much for making coming to work fun. I can’t ask for anything more. And a thanks to all my other friends back home, who taught me how to stay connected and check in on each other from afar before a global pandemic forced us all to learn how to.
Finally, and most importantly, I want to thank those closest to me. Himani, who has taught me the most over this period — she taught me why I need to take care of myself, and how to do it. Juhi, who taught me how to live each day with a smile. And my parents, who taught me all the values I try to live by.
This thesis presents a small snippet of what I have learnt over the last two years, and I hope you learn something new from it as well.
Table of Contents
ACKNOWLEDGEMENTS ... 4
TABLE OF CONTENTS ... 6
1. INTRODUCTION ... 10
1.1. PROBLEM SETUP ... 10
1.2. LITERATURE AND CONTRIBUTION ... 12
1.3. SUMMARY OF FINDINGS ... 13
2. ESTIMATING THE COMPOSITION OF VEHICLES ... 14
2.1. LITERATURE REVIEW ... 14
2.2. DATA ... 16
2.2.1. Data issues ... 17
2.3. ESTIMATING THE ELEMENTAL MASSES FOR MISSING DATA ... 19
2.4. OBSERVATIONS ON VEHICLE COMPOSITION ... 21
3. EVALUATING THE EXPOSURE OF AUTOMAKERS TO MATERIALS SUPPLY CHAIN DISRUPTIONS ... 23
3.1. LITERATURE ON CRITICALITY: VULNERABILITY TO SUPPLY CHAIN DISRUPTIONS ... 23
3.2. DEFINING THE EXPOSURE METRIC ... 24
3.2.1. Interpretation and usefulness of the exposure metric ... 25
3.2.2. Price as an indicator of vulnerability to supply chain ... 26
3.3. THE INCREASING EXPOSURE TO MATERIALS SUPPLY CHAIN RISK WITH ELECTRIFICATION ... 27
3.3.1. Where in the vehicle is the exposure concentrated? ... 29
3.3.2. Which elements drive this price exposure? ... 29
3.4. DISCUSSION ... 32
4. SOCIAL AND GOVERNMENTAL RISKS IN MINERAL SUPPLY CHAINS ... 33
4.1. LITERATURE REVIEW ON ASSESSING RISKS IN MATERIALS SUPPLY CHAIN ... 33
4.2. WHY WE SHOULD NOT AGGREGATE RISK INDICATORS INTO A SINGLE RISK SCORE ... 35
4.2.1. Loss of information from aggregated risk scores ... 36
4.3. INDICATORS TO MEASURE SOCIAL AND GEOPOLITICAL RISKS ... 38
4.3.1. Risk due to Supply Concentration ... 38
4.3.2. Risk due to Conflict ... 39
4.3.3. Risk due to modern slavery (forced labor) in the supply chain ... 40
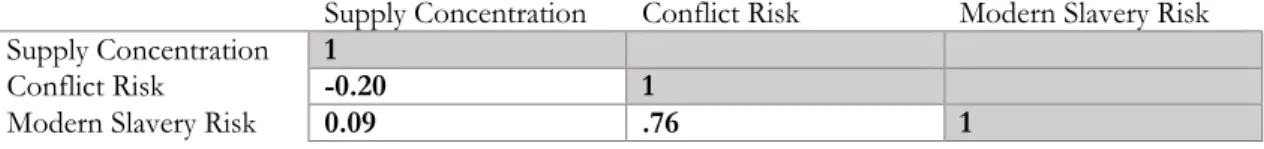
4.3.4. Correlation between risk indicators ... 42
4.4. RESULT ... 43
4.4.1. Increasing supply risk as vehicle fleets electrify ... 43
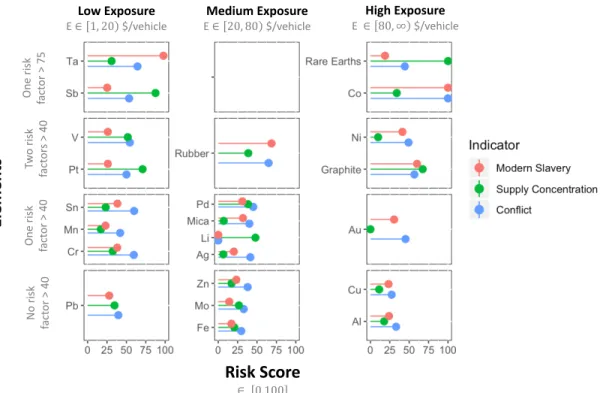
4.4.2. Supply Risks for the different materials used in automobiles ... 45
4.5. DISCUSSION ... 49
5. CONCLUSION ... 50
APPENDIX ... 53
DATASET CHARACTERISTICS ... 53
MASS AND EXPOSURE AFTER FILLING IN MISSING DATA ... 56
PRICING ASSUMPTIONS USED ... 57
NOTE ON MATERIAL PRODUCTION DATA ... 59
SUPPLY RISK VALUES ... 60
List of Figures
Figure 1. Relationship among part mass characteristics within the dataset. ... 18
Figure 2. Performance of KNN model to estimate missing compositional information ... 20
Figure 3a) Distribution of mass across the periodic table b) Mass distribution for an average - hybrid-electric vehicle c) Changes in mass of elements as vehicles electrify ... 22
Figure 4a) Exposure for three hypothetical million vehicle fleets comprising b) Exposure for the - six type of vehicles in our data each broken down by subsystem ... 28
Figure 5. Top twenty elements driving exposure for three hypothetical fleets ... 30
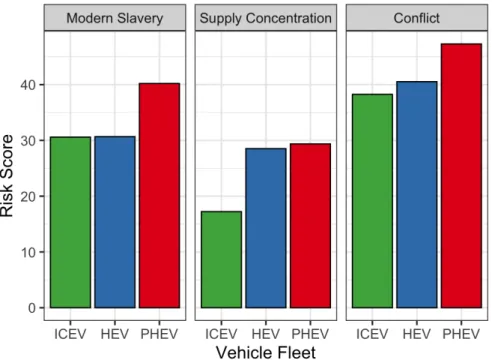
Figure 6: Weighted Average Supply Chain Risk Scores for three hypothetical fleets ... 44
Figure 7: Supply Chain Risk Scores for materials used in vehicles ... 45
List of Tables
Table 1. Summary of key characteristics, including unique part and compound count, for vehicles - included in this study. ... 161. Introduction
1.1. Problem setup
Vehicle fleet electrification is a vital component in the world’s efforts to tackle global warming. In the USA, transportation is the industry with the largest greenhouse gas emissions, accounting for 28.2% of the total1.
Globally, transportation accounts for 15% of all greenhouse gas emissions2. Vehicles that are powered by
electricity rather than gas-powered internal combustion engines are one way to reduce this impact. As electric vehicles (EVs) are becoming comparable to internal combustion engines vehicles (ICEVs) in terms of production costs and performance, sales of these vehicles are increasing rapidly. Electric cars accounted for 2.6% of total vehicle sales in 2019, a 40% increase from the previous year3. Electric car sales (including
hybrids) are projected to increase to 66% of annual automotive sales by 20504.
As many researchers have noted, the clean energy transition is “materials intensive”5. Clean energy
applications require much larger quantities of certain materials (like cobalt, lithium, nickel and graphite) than are required in traditional vehicle technologies. The total demands for cobalt and lithium are projected to grow 466% and 480% respectively by 2050, compared to current production5. The increased need for
these untraditional materials suggests that materials availability could be a potential bottleneck to scaling up EV manufacturing to meet projected growth. Research has shown that materials costs set practical lower bounds on battery prices and that stabilizing materials prices is vital to achieve fleet electrification6. If
materials supply chains cannot meet this increased demand at a low price, the EV growth projections may prove to be over-optimistic. There are many different sources of risk that can disrupt stable supply of materials — including price volatility, geopolitical tensions and the consequences of exploitative labor conditions in mining.
In the last 5 years, both cobalt and lithium have had periods of limited supply causing price increases of over 200%7. This volatility has made automotive manufacturers increasingly concerned about sourcing
materials at a low and stable price. Just over the past year, Teslaa - the world’s largest EV producer - has
urged miners to produce more nickel, secured lithium mining rights in Nevada8, and struck an
industry-record-setting deal with mining firm Glencore to supply Tesla with 6000 tons of cobalt per year9
Concern about availability of materials is not restricted to whether material supply can be scaled up in a way that materials prices are stable and low. Disruptions to the supply of materials can occur due to various socio-political reasons. One example is the case of the embargo that China placed on the export of rare-earth materials10. The properties that rare-earth elements (REE) impart to products are vital for many
aThe CEO, Elon Musk, also said “we will coup whoever we want” in response to a tweet about the US
modern technologies including vehicles and smartphones, and China controls over 95% of REE production. In 2010, China placed an embargo on rare-earth exports to Japan over a territorial dispute in the South China Sea10 and prices of these materials rose by over 600% in the aftermath11. The price increase
caused large scale disruptions in the manufacture of technologies that relied on the use of rare-earths. China has made threats of similar export restrictions recently as trade tensions with the United States have escalated. Examples such as the case of China’s embargo on rare-earth exports show us that the nature of materials supply chains leaves manufacturers exposed to many sources of availability risks. Over time, as fleets electrify and new materials are used, these risks change. In order to devise strategies to mitigate these various risks to supply of materials required in electric vehicles, it is important to quantify how these risks are evolving.
When evaluating issues in the materials supply chain, it is important to not just consider whether enough materials will be available in the future, but also how they will be made available. There are many concerns that are not captured in the cost of materials sourcing. For example, the extraction of minerals is often done under extremely exploitative labor conditions. The cobalt mining industry employs around 40,000 children and over 200,000 informal miners digging for cobalt with their bare hands in deep tunnels without protection, often leading to their injury and death12–14 Due to the lack of supply chain transparency and
traceability, no manufacturer knows if the supply chain of materials used in their vehicles are free from this kind of exploitation. As electric vehicles sales increase, ensuring that the supply chain is free from exploitation is a growing social justice issue that must be addressed by policymakers and industry. There has been a growth in media reporting about these labor abuses which has increased consumer awareness and pressure on large corporations that rely on these materials12–14. Failing to address these issues
in the supply chain also constitutes a business risk to companies in terms of damage to reputation and brand image. These social issues also constitute a business risk from a legal and regulatory standpoint. International Rights Advocates, a human rights firm, recently filed a lawsuit against large multinational companies — including Apple, Google and Tesla — for being complicit in the death and serious injury of African children engaged in resource extraction in their supply chain15. Moreover regulations such as
The UK’s Modern Slavery Act requires companies to publish an annual slavery and human trafficking statement that discloses the steps taken to ensure supply chains are free from slavery16.
Creating the infrastructure for responsible sourcing of materials requires investment from companies into auditing and certification in order to guarantee the absence of exploitative conditions in their supply chains. Making the financial case for this investment requires evaluating the business risk these social issues create for manufacturers. Under investor and consumer pressure, industries have begun to estimate environmental, social and governance (ESG) risks in their businesses. However, there is no clear and consistent method to estimate these risks.
1.2. Literature and Contribution
In the academic literature, the task of evaluating the risk of an industry to materials’ supply is known as material ‘criticality’ evaluation. As we discuss extensively in the literature review in Chapter 3.1, most authors define criticality of materials as a function of a) the supply risk in the procurement of the materials and b) the economic vulnerability of the stakeholder to those supply risks. The literature on evaluating criticality of materials differ widely on scope, goal and method — something that must be reconciled for manufacturers who are trying to accurately estimate these risks.
For a material, the vulnerability of the stakeholder to supply risk captures the impact that the particular stakeholder would face if a disruption to the supply of that material occurred. The supply risk itself depends on the characteristics of the material supply chain (external to the stakeholder) while the vulnerability depends on intrinsic factors such as how important the material is to the stakeholder. As fleets electrify, the vulnerability of automotive manufacturers to materials supply chain risks changes as they become more dependent on some materials (like lithium) and less dependent on others (like palladium). Evaluating the change in vulnerability of stakeholders in the automotive industry requires quantifying how the material composition of vehicle changes with electrification.
While the task of quantifying the material composition of vehicles sounds trivial, academic literature often fails to comprehensively estimate this composition. As we will show in the literature review in Chapter 2.1, research quantifying vehicle composition suffers from issues in data collection and therefore report high variation in materials content (for example, copper content in plug-in hybrid (PHEV) motors ranges from 7kg to 45kg)17. While there is research that studies the composition of certain parts (like the battery),
different studies use parts from different vehicles making it hard to compare across the literature and come up with one comprehensive measure of vehicle composition.
In the light of these research gaps, we shall make two main contributions in this thesis:
1) Provide the most detailed assessment of vehicle material composition to-date in academic literature- for both combustion engine vehicles as well as hybrids
2) Assess the change in exposure of manufacturers to social and geopolitical risks in materials supply chain as drivetrains electrify by
a. Quantifying the cost of materials supply chain disruptions to manufacturers
b. Evaluating the risks of supply concentration, modern slavery and conflict in the supply chain of materials used in vehicles.
1.3. Summary of findings
The goal of this work is to provide a risk assessment that motivates and informs decision-makers who have an interest in reducing risks and externalities in the supply chain of materials used in vehicles. Through the analysis in this thesis we demonstrate a large increase in social and political risks in materials supply chains as fleets electrify, as well as a large increase in the cost impact of these risks to manufacturers.
Combining composition data on over 15,000 vehicle parts from suppliers, we find that modern vehicles use over 75 different elements and over 2000 different compounds. Many of these materials face availability concerns and price volatility. We develop a metric we call “exposure” that quantifies the relative importance and economic volatility of materials used in vehicles. Our exposure metric captures the additional cost to manufacturers if a disruption occurred in the supply chain of the materials used in their vehicles. Using that metric, we found that a fleet constituted entirely of PHEVs has a ~100% larger exposure to supply chain risks than a fleet of only ICEVs. The largest contributors to this are battery-related elements like cobalt, nickel, and graphite (together nearly 40% of total PHEV fleet exposure), but other materials such as copper, gold and natural rubber also contribute significantly.
Given research showing that stabilizing materials prices is vital to achieve fleet electrification6, the increase
in automakers’ exposure to materials price volatility is an important finding. Achieving a smooth and rapid electrification of vehicle fleets will require mitigating the exposure of vehicle manufacturers to disruptions in the supply chain of the materials they use.
We evaluate three distinct risks in materials supply chain that have been of increasing concern to policymakers and industry: the risk of supply concentration, the risk of modern slavery in the supply chain and the risk of conflict in the supply chain. Through our analysis, we find that all our three categories of supply risk increase significantly as vehicle fleets electrify. The supply concentration risk indicator for a PHEV fleet is 70% higher than that for an ICEV fleet. The modern slavery risk indicator and conflict risk indicator are 33% and 26% higher, respectively. While these numbers don’t directly quantify the increase in probability of disruption, they capture the trend of increasing risk as fleets electrify.
For automobile manufacturers, the increase in risk makes a business case for investing in risk mitigation strategies such as long-term sourcing contracts and materials substitution research. For the general public, the increase in social risks highlights the increasing likelihood that electric vehicles will be manufactured using materials extracted under conditions of conflict or slavery. This revelation makes the case for regulations and policy interventions that promotes ethical sourcing of materials.
2. Estimating the composition of vehicles
This chapter is largely derived from a publication “Characterizing the changes in material use due to vehicle electrification” that has been submitted to ‘Environmental Science and Technology’. The publication was co-authored by myself (Karan Bhuwalka) alongwith Dr. Randolph Kirchain, Dr. Frank Field, Robert D. De Kleine, Hyung Chul Kim and Timothy J. Wallington
2.1. Literature Review
There have been many attempts to quantify the material composition of vehicles in the criticality, LCA, and trade literature. Generally, these can be organized in terms of either scope or method of inquiry. When organized by scope, analysis can be thought to consider materials use within specific parts, the use of specific materials, or with an intent to be comprehensive. When organized by method, studies can be broadly categorized as synthesizing secondary data or creating and analyzing primary data. Those that create primary data do so through three methods: assay of dismantled parts, assay of shredder output, or analysis of material reporting databases.
Historically, the scope of most vehicle composition studies focused on base materials including metals like iron, copper, aluminum, lead and zinc as well as plastics, rubber, and glass to better understand broad economic impacts 18–21 or the impact on automobile recycling. 22–24 In the last decade, awareness has
increased that minor constituents can have a significant impact on the environmental, social, and economic characteristics of a product. 25 This awareness has translated into increased focus on the minor metals
composition of passenger cars.
A large body of work on automotive material use focuses on a specific set of materials. The most expansive set of this type examines the use of platinum group metals (PGMs) in catalysts and fuel cells.26–32 Similar
studies focus on battery-related materials, including lithium 33, cobalt 34, and more comprehensive studies
that include the former as well as nickel, manganese, and copper. 35–37. Given the strategic importance of
rare-earth elements, studies have also focused exclusively on magnets.38,39 Studies also focus on materials
used in automotive electronics 40, materials used in vehicle controllers and navigation41 and light-weighting
materials 42,43 .
A review of literature on research quantifying the use of materials in vehicles reveals a gap in comprehensiveness. Given the increasing use of materials in vehicles, a comprehensive
quantification of material composition is necessary for manufacturers to understand risks. Due to large variation in metal content across different manufacturers, there is the need to use consistent primary data to accurately understand material composition. Many primary data studies have missing or incomplete data which needs to be imputed for comprehensiveness.
These material-component specific analyses have provided important insights into emerging economic, environmental, and social risk. Aggregating such results, however, may provide an inaccurate picture of overall risk. This shortcoming occurs for two reasons – incompleteness and inconsistency in analysis. Ortego et al44 note that studies that focus on specific materials and subsystems may overlook material in
less prominent parts of the vehicle. Therefore, such studies may have missing mass. 44 Although most
studies are quite clear about what is included, the lack of standards in this field means that there is inevitable inconsistency in analytical framing across analyses.
Nevertheless, because comprehensive analyses from a consistent data source are rare, many studies provide the best possible estimates of vehicle composition by aggregating secondary data from individual material-component specific analyses. This research either uses estimates from publicly available reports 17,45,46, or
from life-cycle inventory databases such as EcoInvent or GaBi 47–50. A broadly cited estimate of vehicle
composition is found in the GREET simulation tool, which uses “a wide variety of data sources”.51–54
Nordelöf et al.55 note that in doing this kind of aggregate analysis it is difficult to define and maintain
consistent system boundaries and that this often leads to very divergent results. As an example, Knobloch et al.17 note that the literature describes large variation in metal content - with copper content in PHEV
motors ranging from 7kg to 45kg.
A few studies have developed primary data to characterize the material composition of vehicles. We are aware of three studies that have done this using experimental methods – one study that analyzed the composition of selectively dismantled components56 and two studies that analyzed shredder outputs56,57.
As pointed out in earlier literature, both these methods appear to underreport the presence of critical metals. Shredder outputs may underreport because either some parts are selectively removed before shredding or difficulty in quantifying trace masses. As an alternative, we use a database method, similar to Cullbrand and Magnusson58 and in a previous work by Kirchain and Field59. We are unaware of a previous study that has
applied primary data methods to compare conventional and electric vehicle composition comprehensively. As pointed out by Du et al.57, database methods often have incomplete reporting. In this thesis, we
introduce a novel algorithm to estimate missing data. Further, as we noted above, there is large variation in metal content between different manufacturers. This makes it difficult to identify the effect of electrification when comparing variability in metal content across vehicles. In this thesis we analyze data that covers the entire vehicle for a set of similar vehicles. Given that the data is from one manufacturer, vehicles are comparable in terms of product strategy. While the sample is small, we believe that looking at trends within a set of similar vehicles can help identify changes due to electrification that are not confounded by design choices made among different companies.
2.2. Data
We analyse a dataset of 358,401 records describing the materials composition of the entire set of parts which make up seven 2019 and 2020 model year vehicles produced by a single large automobile manufacturer (producing more than five million vehicles per year globally). The vehicles and their characteristics are listed in Table 1. Of the seven vehicles, four were variants of a sedan and three were variants of an SUV. For each vehicle type, we had one internal combustion engine vehicle (ICEV) with automatic start-stop capabilities, one hybrid electric vehicle (HEV) and one plug-in hybrid (PHEV). We had an additional ICEV variant for the sedan set. A description of the characteristics of the seven vehicles can be found in Table 1. We chose this set of vehicles to provide a range of electrification levels and vehicle sizes.
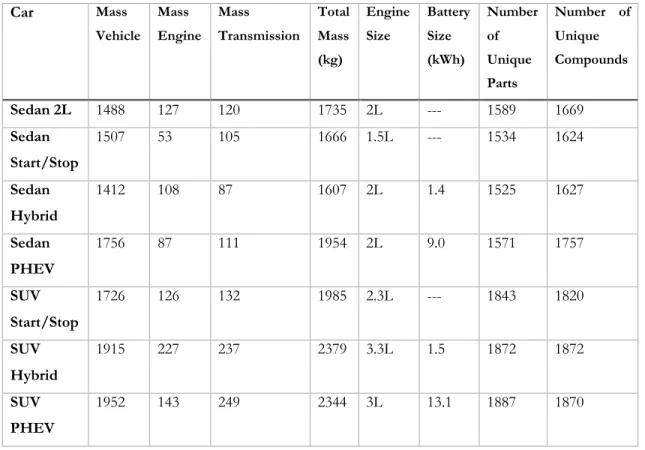
Table 1. Summary of key characteristics, including unique part and compound count, for vehicles included in this study.
Car Mass Vehicle Mass Engine Mass Transmission Total Mass (kg) Engine Size Battery Size (kWh) Number of Unique Parts Number of Unique Compounds Sedan 2L 1488 127 120 1735 2L --- 1589 1669 Sedan Start/Stop 1507 53 105 1666 1.5L --- 1534 1624 Sedan Hybrid 1412 108 87 1607 2L 1.4 1525 1627 Sedan PHEV 1756 87 111 1954 2L 9.0 1571 1757 SUV Start/Stop 1726 126 132 1985 2.3L --- 1843 1820 SUV Hybrid 1915 227 237 2379 3.3L 1.5 1872 1872 SUV PHEV 1952 143 249 2344 3L 13.1 1887 1870
We analyze a high-resolution dataset of over 350,000 records detailing the material composition of 7 vehicles. The data studies the composition of 1700 parts per vehicle with masses of materials reported at a precision of 10---6g. The 7 vehicles including sedans and SUVs at different levels of
electrification from ICEV to PHEV. We select similar builds of vehicles to maintain consistency in analysis. We identify data issues like duplicates, incomplete data and hidden data.
The dataset was drawn from the International Materials Data System (IMDS). IMDS is a platform used by more than forty automakers and over 100,000 suppliers 60 to facilitate materials reporting.
An IMDS database query was executed to retrieve the records that describe the set of parts required to construct one instance of each vehicle (referred to as a single build). Each part in the query was described by a part identification number, total part mass, quantity used to build one vehicle, and a bill of materials reporting the mass of each compound in the part. Compounds were identified by their Chemical Abstracts Service (CAS) Registry numbers, a reporting scheme operated by the American Chemical Society. 61,62 We
found the seven vehicles to have 5556 unique parts, averaging 1690 parts per vehicle, and 2539 unique CAS numbers, averaging 1730 per vehicle.
The manufacturer’s part numbering system comprises three alphanumeric strings separated by two hyphens. The middle string is referred to as a ‘Base Part Number’ and allows a part to be categorized into a system and a sub-system. Using this classification system, the dataset can be divided into 11 systems – Drivetrain, Electrical, Fastener, Body, Closures, Controls, Suspension, HVAC, Chassis, Interiors and Others – and 142 unique subsystems.
Because discussions of criticality have focused primarily on metals, most are organized at the elemental level 63,64. For the most part, we adopt that approach here. For this purpose, we decompose CAS data,
which is at a compound level, into elements molecular formula listed in the CAS database field “Formula”. There are three materials that we analyze at the compound level- mica, natural rubber and graphite. These materials are known to have risks in their supply chain65–67, even though the elements that compose them
are unremarkable.
The dataset itself is rich, with some masses specified at a 10-6 g precision. For these seven vehicles, we find
use of 82 different elements (76 different if we exclude elements with less than 1mg mass present) distributed across 2,539 compounds.
2.2.1. Data issues
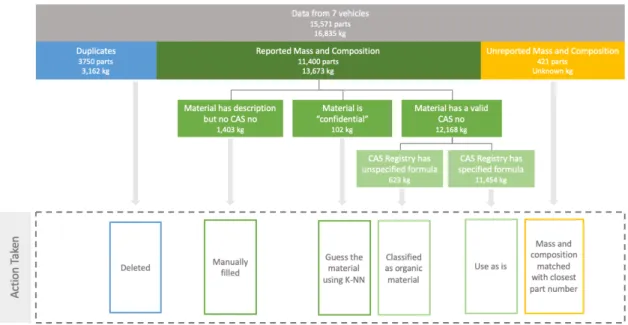
As would be expected for a dataset of this size, there were some quality issues. Generally, these fall into one of two categories: duplications and omissions (missing data). The relationship among these issues within the dataset is represented in Figure 1.
Within the dataset, about 20% of parts have duplicate records because they are produced by more than one supplier. Composition and mass of these duplicates is averaged to prevent double counting.
Four types of data omissions were observed. The first type of omission is parts with all mass information, but where some CAS numbers are omitted and replaced by textual descriptions. As an example, the part may be described as being comprised of “carbon black” or “PA6”. Although generally informative, these
descriptions of type are less precise (more obscure) than a specific CAS number. This part type will be labeled ObscureType and represents around 10% of the weight of the vehicle. The second type of omission are parts where there is mass information but where some material components have neither CAS numbers nor textual description (NoType). IMDS allows suppliers to hide some details of the elemental composition for proprietary reasons.
The third issue involves CAS numbers that have no chemical formula in the database. This means we are unable to use the formula directly to convert the CAS numbers into elemental compositions. These parts are labelled as NoFormula and represent about 3.7% of the mass. The final type of omission is parts labelled as “unreported” at the time at which the data was queried. “Unreported” parts have no mass or composition information (type or mass). These make up approximately 2.7% of parts. For each vehicle, a detailed breakdown of the proportion of data of each type is given in Table 2
Figure 1. Relationship among part mass characteristics within the dataset.
Table 2: Summary of data by source for each vehicle. Percentage defined on total mass after removing duplicated. The large duplicates in the SUV S/S due to repeated engine block entries
Unit Sedan 2L Sedan S/S Sedan Hybrid Sedan PHEV SUV S/S SUV Hybrid SUV PHEV Unreported Part (% parts) 11.6% 4.8% 2.1% 1.6% 6.5% 4.8% 4.5%
Duplicate (% mass) .5% 22% 22% 7% 110% .5% .4%
NoType (% mass) .71% .67% .69% .73% .29% .58% .72%
ObscureType (% mass) 10.4% 10.7% 9.9% 10.2% 4.4% 10.2% 10.3%
NoFormula (% mass) 5.7% 5.8% 5.4% 4.9% 1.4% 3.4% 3.5%
2.3. Estimating the elemental masses for missing data
Each type of data omission – ObscureType, NoType, NoFormula, and Unreported – was addressed with a different analytical approach.
ObscureType parts have some omitted CAS numbers, but textual descriptions of composition. The best judgement of the authors was applied to map textual descriptions to appropriate CAS numbers. As an example, parts described as comprising “PA6” and “glass fiber” were assigned CAS numbers 32131-17-2 (nylon 6/6) and 7631-86-9 (silica), respectively.
NoType parts have some portion of their mass with no specified CAS number and no textual description. Although NoType parts represent less than 2% of the total mass, we apply special effort to estimate their composition because the research team felt that these parts were more likely to contain critical materials. Using an average composition as a proxy for these parts would underestimate that risk.
To better estimate composition of NoType parts, we make use of the two facts: 1) various suppliers produce equivalent parts and 2) each supplier has a unique policy for labeling compositional information as confidential. In light of this, we train a k-nearest neighbors (KNN) model to identify the parts most similar to the NoType part 68. A distinct model was developed for each vehicle where the training dataset
comprised all fully detailed parts (i.e., parts without data omissions) from all six of the other vehicles. Each part in the training data is described by a part number and its mass percent composition for 76 elements. For each NoType part, we predict the three nearest neighbors of all parts, based on a Euclidian distance of the elemental mass. We then estimate which elements have a higher average composition in the three nearest neighbors than the composition in the NoType part. We distribute the mass of the hidden material to these elements, based on a weighted average where the weights are determined by the difference in mass between the actual and predicted compositions.
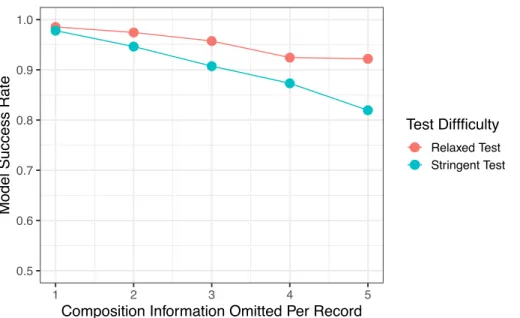
To test this algorithm, we take 20% of the dataset (only taking parts with no missing information) and randomly delete an element from the part data. We then predict the part it was originally and test the algorithm in two ways. The stringent test classifies a prediction as successful only if the nearest neighbor of the modified part is the original part. For the relaxed test, a prediction is classified as successful when any of the three nearest neighbors is the original part. Figure 2 shows the model performance as the number of omitted materials increases from one to five. For both tests, our algorithm performs well. If
We develop methods to estimate the composition from different kinds of missing information. For data in which a supplier keeps the composition of a part confidential, we estimate the hidden information using a k-nearest neighbors algorithm. It is important to fill in missing information because it is likely that suppliers under-report high value materials.
only one element is omitted, success exceeds 90% (Relaxed 96%, Stringent 93%). Although the accuracy of prediction decreases as more materials are omitted, even when five materials are omitted, the algorithm can still correctly identify the actual part more than 65% of the time and it is one of the three most likely parts more than 80% of the time. These results provide confidence that this algorithm improves our estimate of vehicle composition.
Figure 2. Performance of KNN model to estimate missing compositional information based on known composition. Performance as more compositional information is hidden (omitted from the test set). Stringent test is a success only if nearest neighbour is the original part. Relaxed test is a success if any of the three nearest neighbours is original part.
‘NoFormula’ compounds are typically organic materials that do not have well-specified molecular formulas such as “cellulose” or “fatty acid”. Therefore, we classify NoFormula compounds as ‘organic materials’ and report these with polymers as “polymers and other organic”.
Mass and composition information for Unreported parts was estimated in one of two ways based on the uniqueness of the part. For parts with analogs in the dataset (i.e., with the same base part numbers), we use the average of mass and composition of the analogs as an estimate of the Unreported part. Of the 411 unique Unreported parts (out of ~12,000 unique parts), 236 have analogous parts. For Unreported parts without analogs, we use a fuzzy matching of the unreported part number to reported part numbers based on the Levenshtein (LV) distance. The LV distance represents the minimum number of character substitutions required to convert one string to another. In these cases, the unreported part is represented as the average of the parts with the minimum LV distance. Details of the material composition of each data source are given in the Appendix.
● ● ● ● ● ● ● ● ● ● 0.5 0.6 0.7 0.8 0.9 1.0 1 2 3 4 5
Composition Information Omitted Per Record
Model Success Rate
Test Diffficulty ● ● ● ● Relaxed Test Stringent Test
2.4. Observations on vehicle composition
For the seven vehicles analyzed here, we find the use of 82 different elements (76 different if we exclude elements with less than 1mg mass present) distributed across 2,539 compounds. This represents more than 80% of the 94 naturally occurring elements in the period table (see Figure 3a). As many of the substances in our dataset are different types of organic compounds, we manually group them into elastomers and polymers. Figure 3b shows the distribution of masses in an average hybrid electric vehicle (i.e. average mass of each element across all HEVs and PHEVs). As one would expect, iron and steel represent the largest material by mass and there are large amounts of polymers, elastomers and rubber in a vehicle as well.
a)
b)
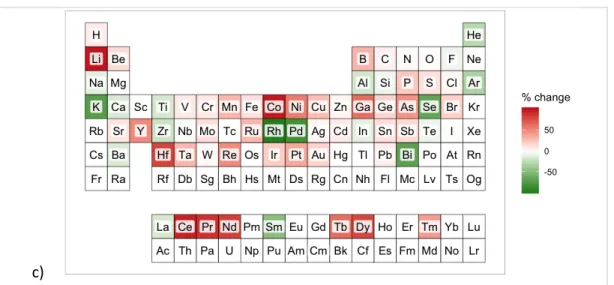
More than 80% of naturally occurring elements are used in producing a vehicle. Securing the supply of all these materials is complicated and leaves manufacturers exposed to risks in supply chain. Many changes take place in material use of vehicles as they electrify. There are sharp increases in the use of cobalt, rare-earths and nickel but sharp decreases in the use of platinum and palladium.
c)
Figure 3a) Distribution of mass across the periodic table. Average mass of all vehicles in the analysis set. b) Mass distribution for an average hybrid-electric vehicle -- average of all HEVs and PHEVs in the analysis set. c) Changes in mass of elements as vehicles electrify. Color indicates difference between SUV PHEV and SUV ICEV. Positive values reflect increasing use of a material with electrification.
The most striking observation from analyzing the material composition of vehicles (Figure 3a) is the large number of materials needed to make a modern automobile. The use of a large range of materials represents the increasing complexity of technology and the increasing reliance on materials. As manufacturers continue down the path of using more materials, they expose themselves to increasing risks of disruptions in materials supply chains. Disruptions in the supply of any one of these elements can fundamentally halt the production of the vehicle. This potential for disruption is why manufacturers need to quantify risks in materials supply chain and prioritize important materials for which they need to develop sourcing strategies. The next major observation is that the importance of materials to a technology cannot be determined exclusively by the quantity of material used. A majority of materials are used in a quantity of less than a kilogram, while 1200kg of iron is used in the production of the vehicle. However, disruptions to the supply of materials that are used in limited quantities can be as damaging as disruptions in iron supply. Evaluating the importance of these materials is a complex task- one that we shall undertake in the following section. Finally, Figure 3c highlights the large number of changes in materials use that occur as vehicles electrify. There are a larger number of materials that show increase in use (55), compared to the number of materials that show a decrease (21). The increase in material use suggests, as other research has noted, that the clean energy transition is likely to be material intensive i.e. we will use more materials for clean energy applications. There is an increased use of rare-earths in traction motors as well as battery materials like Li, Co and Ni. However, there is also decreasing dependency on PGMs like Pd and Rh that are used in catalytic converters of ICEVs to reduce emissions. So, while there is increasing reliance on certain materials, there is a decreasing reliance on others. Evaluating how the overall risk profile of a company evolves with electrification requires a metric to understand and evaluate risk.
3. Evaluating the exposure of automakers to materials
supply chain disruptions
This chapter is largely derived from a publication “Characterizing the changes in material use due to vehicle electrification” that has been submitted to ‘Environmental Science and Technology’. The publication was co-authored by myself (Karan Bhuwalka) alongwith Dr. Randolph Kirchain, Dr. Frank Field, Robert D. De Kleine, Hyung Chul Kim and Timothy J. Wallington
3.1. Literature on criticality: vulnerability to supply chain disruptions
The tasks of assessing both the importance of materials to technological and economic growth, as well as potential availability issues in their supply is commonly known as material criticality evaluation. Criticality evaluations are important to industry and policymakers alike and facilitate strategic planning for product design, trade agreements and investment decisions.
Most authors define criticality of materials as a function of 1. the supply risk in the procurement of the materials and
2. the economic vulnerability of the stakeholder to those supply risks
In a global market, of these two characteristics, supply risk is less specific to the focal stakeholder, while
vulnerability is inherently stakeholder-specific. In this section, we focus on the vulnerability exposure
to the automotive industry associated with critical materials use and how that might change due to electrification.
In the literature on criticality, a number of factors associated with vulnerability have been identified. Graedel et al.69 describe vulnerability at a national level as deriving from three issues: importance (of the material to
the stakeholder), susceptibility (of the economy to international supply constraint), and substitutability (of the material). A recent review by Schrijvers et al.70 identifies eight specific metrics that have been used to
quantify aspects of vulnerability.
A review of literature on research quantifying the vulnerability of a firm to materials supply risk reveals that the fundamental components of vulnerability are a) importance to the firm, b) susceptibility and c) adaptability. We use the concept of susceptibility and importance to define a metric for exposure to risk.
Generally, these can be grouped into categories akin to those proposed by Graedel69:
A) Importance (to the firm): 1) revenue impacted 2) demand growth
B) Susceptability (to impact from supply restriction): 3) share of global production
4) trade restrictions 5) price volatility
C) Adaptability (if faced with supply restriction): 6) substitutability
7) capacity to innovate
8) ability to pass through cost increases
In the analysis presented here, we focus on importance and susceptibility. To describe the combination of these two effects, we coin the label exposure. To be clear, we do not evaluate adaptability, which represents the firm’s internal ability to respond to exposure, in this section. In our context, the ability to pass through cost increases at the product level (automobiles) would be similar across materials and, therefore, not additionally diagnostic. Substitutability and the ability to innovate are other important aspects of vulnerability that should be evaluated in future work.
3.2. Defining the exposure metric
Specifically, we define exposure (Ec,e) due to an element, e, for a component, c, as the product of importance
(I) and susceptibility (S). Stated mathematically, this is
(1) where !!,# is the importance of element e in c and ## is the susceptibility of element e.
We define importance as the impact on revenue (growth in this impact, item two on Schrijvers list, is explored through scenario analysis). Stated formally, Ic,e is defined as:
(2) , , c e c e e E =I S , , c e c e e I =m P
We define a metric for exposure to supply chain risk incorporating concepts of susceptibility and importance. A materials’ mass and price signify its importance to a manufacturer. Its price volatility signifies how susceptible a material is to supply chain disruptions. Our ‘exposure’ metric for a material signifies how much more expensive it would be to produce an automobile if the price of the material faced a price-shock determined by its historic price range.
where mc,e is the mass of the element, e, in c and Pe is the price ($/g) of e to the firm. For our analysis, we
use the average price in the period from 1998-2015 71.
We define susceptibility as the historic price volatility for e as measured by the normalized, root-mean-squared error (NRMSE) of price referenced to a linear trend. Expressed mathematically that is:
(3)
where Pt,e is the price of e in year t and is the trend-based estimate of price of e in t. We normalize the
RMSE of this trend against the average price of e between 1998-2015. We estimate as the ordinary least squares linear trend of the data over that period.
Combining equations (1) to (3), we see that an element-part combination can therefore have high exposure either if the manufacturer needs a large quantity (i.e. large mc,e), if the price is high (high Pe), or if there is
high susceptibility from the high price volatility (high S#) .
We can find the exposure for a component c by summing exposure across all elements present.
(4) Similarly, if we define C to be the set of all components in a vehicle ( ), we can take a sum across all components in C to find the exposure attributable to an element.
(5)
3.2.1. Interpretation and usefulness of the exposure metric
Unlike other vulnerability metrics that are a unit-less aggregation of different indicators, our Exposure metric has physical meaning. The exposure to a material for a part represents the increased cost in making that part if the price of that material were to rise by its historic 95% confidence price range. By summing across sets of parts and vehicles, we can interpret the additional cost of making an entire vehicle or of manufacturing a fleet due to change in material prices. By providing a monetary quantification of vulnerability, manufacturers can estimate the value of more reliable supply chains. The quantification can aid decision making such as contracts with mining companies as well as investment in substitution and material reduction.
(
)
( )
0 0 2 , , ,ˆ
N N t t e t e t t e t t e t tN
P
P
S
P
= =-=
å
å
,ˆ
t eP
,ˆ
t eP
, , c c e c e e e eE
E
I S
" "=
å
=
å
c CÎ , , e c e c e e c C c CE
E
I S
Î Î=
å
=
å
3.2.2. Price as an indicator of vulnerability to supply chain
As shown in Chapter 3.1 there are many different ways researchers have tried to quantify vulnerability. For example, Ortego et al44 use changes in thermodynamic rarity to quantify vulnerability. We use price-based
indicators in our analysis. As Watson and Eggert72 argue: “while prices are an imperfect measure of metal
availability, they do provide an important measure by which to benchmark availability's determinants.”72
The price of a material reflects some aspects of its availability (but not all). For example, materials that have lower abundance in the earth’s crust are more expensive as deposits are harder to find and more energy is required in mining. However, materials like gold can have very high price but manufacturers have many financial mechanisms to hedge against the price risk — meaning that the exposure to these risks is low. Price and mass of materials used, therefore, capture the ‘importance’ of a material to a manufacturer, but not their ‘susceptibility’ to risks. The combination of mass and price leads to a high materials cost. Since manufacturers are minimizing production costs, the materials that constitute a greater proportion of these costs are considered more important.
As price alone does not capture vulnerability to supply risks, we incorporate volatility. We use price volatility as an indicator of ‘susceptibility’. In our case, a firm is susceptible to supply chain disruptions if the cost of production increases due to a disruption occurring in the materials supply chain. Price volatility captures whether a material is subject to high price increases if supplies are constrained. Large price swings are indicative of a steep supply curve around the level of supply where the market clears. If materials have high price volatility, manufacturers face the risk that prices for a material will rise after the choice has been made to use that material in the vehicle design. For these reasons, price volatility is commonly used by researchers as an indicator of vulnerability.70 When disruptions to materials supply chain occur due to
socio-governmental issues like trade embargoes or conflict, they are typically followed by increases in prices. For example, when China restricted rare-earth exports to Japan, prices went up by 600%10. The extent of
price shock for a material during these disruption events captures the cost of disruption to which manufacturers are susceptible.
3.3. The increasing exposure to materials supply chain risk with
electrification
Using compositional information, we compute exposure for each component (Ec) which can be aggregated
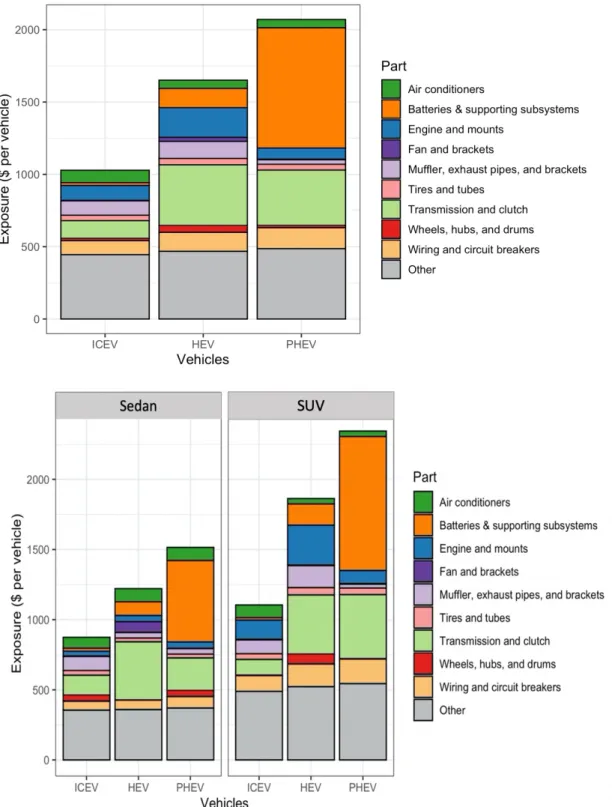
by subsystem and vehicle. As displayed in Figure 4, we find that exposure vulnerability increases from a minimum of $870 per vehicle for ICEV passenger vehicles to $1530 for PHEV passenger vehicles and from a minimum of $1210 per vehicle for ICEV SUVs to $2344 for PHEV SUVs.
To put these values into context, consider the implications for an automaker producing a fleet of 1 million vehicles annually (There are at least twenty manufacturers globally that produce at or above this rate.73)
made up of two SUVs for every sedan. (This ratio aligns with average US car sales from 2015-2020. 74) As
displayed in Figure 4, we find that the overall economic exposure in an all PHEV fleet is 100% greater (a difference of nearly $1 billion per year for a million vehicle fleet) than the exposure in a conventional all ICEV fleet. The exposure to materials supply risk based on a 100 million vehicle fleet of sedans and SUVs (estimated automobile sales in 2018 were 97 million) grows by a $100 billion a year. The $100 billion represents 2% of the total revenue of the automobile industry
We find that as fleets go from all ICEV to all PHEV, the exposure to materials supply risk doubles. For a 100 million vehicle fleet, the difference in exposure is over $100 billion. If all commodities faced a price shock (equal to their historic 95% confidence price range), it would cost the
automobile industry an extra $200 billion to make a PHEV fleet, compared to an extra $100billion for an ICEV fleet. The exposure is likely to go up further as fleets go full electric. The increased exposure (driven by cobalt, copper, nickel and rare-earths) more than counteracts the decreasing exposure to (PGMs and aluminum). The increasing exposure is driven not just by the battery but also increases in traction motors and sensors for automation.
Figure 4a) Exposure for three hypothetical million vehicle fleets comprising i) all ICEVs (All Conventional), ii) all HEVs (All Hybrid), and iii) all PHEVs (All Plug-in) each broken down by subsystem b) Exposure for the six type of vehicles in our data each broken down by subsystem. All three fleets assume 2:1 proportion of SUV:Sedan, an approximate distribution of light-duty vehicle sales in the United States.
3.3.1. Where in the vehicle is the exposure concentrated?
The detailed nature of the dataset allows us to map the change in exposure to the specific components and materials that are driving that change. As shown in Figure 4, the majority of the $1.04 billion increase in exposure when going from conventional ICE vehicles to PHEVs is associated with the batteries subsystem (orange area in plot). In fact, the growth in exposure attributed to batteries (increase of $810 million) represents 80% of the total net change in exposure ($1.04 billion). The contribution of batteries grows from 1.7% of the ICEV fleet exposure to 40% for the PHEV fleet. Electrification also increases exposure by $258 million in the transmission and clutch subsystem (light green area – a 210% increase on going from ICEV to PHEV) and by $48 million in the wiring and circuit breakers subsystem (light orange area – a 49% increase).
The PHEV fleet also displays a significant reduction in exposure in the muffler, exhaust, and brackets subsystem (a 69% reduction in the light purple region; an exposure decrease of $68 million). The decrease is due to reduced needs for PGMs in the catalytic converter. The PHEV fleet also sees smaller reductions in exposure in the engine and mounts subsystem (a 26% reduction in the blue region; an exposure decrease of $26 million) and in the air conditioner subsystems (a 44% reduction in the green region; an exposure decrease of $37.5 million).
The largest contributor to exposure in the engine and mounts subsystem is the turbocharger which uses Ni based superalloys. Exposure in the transmission and clutch subsystem is dominated by aluminum castings, copper wiring, and rare earth content in the traction motors. One notable driver of exposure are motors and electronics in the HVAC subsystem because of the use of rare-earths and mica in the HVAC. Although it is not a major overall contributor, it is interesting to note that the exposure within the tires system is due to natural rubber content which is below 20% of the tire weight on average, but contributes to over 95% of the exposure resulting from the tires. Aluminum drives exposure in the wheels, hubs, and drums system.
3.3.2. Which elements drive this price exposure?
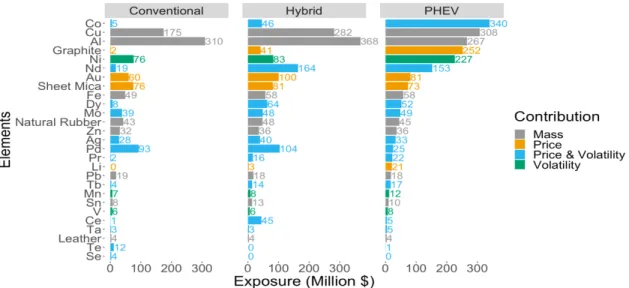
Figure 5 shows how specific elements contribute to exposure (Ee) across three scenarios. (All materials and
elements contributing at least $5 million dollars per year of exposure are included in the figure. This set represents about 99% of total materials exposure.) Within Figure 5, we also identify for each element whether the contribution to exposure is due to high mass in the vehicle (grey bars), high price levels (yellow bars), high volatility (green bars), or high levels of both price and volatility (green bars). A material is
classified as “mass dominated” if the mass of that material is greater than the median mass of all the materials in the vehicle. Price or volatility dominated a classified similarly.
Figure 5. Top twenty elements driving exposure for three hypothetical fleets comprising i) all ICEVs (All Conventional), ii) all HEVs (All Hybrid), and iii) all PHEVs (All Plug-in). Together these represent 99% of the exposure for the PHEV fleet.
Figure 5 makes clear that while recent focus on battery-related materials (e.g., cobalt, nickel, graphite) is
important, these are not the only elements that drive vulnerability. In fact, aluminum and copper represent 30% of exposure even for the all PHEV fleet (nearly 50% for the conventional and hybrid fleets). For all three fleets, the two elements trail only iron in mass. However, prices for both aluminum and copper are much more volatile than iron and steel prices (Al is 17% more volatile, Cu is almost 90% more volatile; The average price of Al per ton is 20x higher than per ton price of Fe and that of Cu per ton is 50x higher). Interestingly, in this dataset, aluminum and copper show opposing trends with electrification. Copper use increases due to increased wiring, while aluminum use decreases due to smaller engine and transmission systems. It is important to note that aluminum use can be much higher for specific platforms if it is used for mass reduction. Strategies around mass reduction vary even among individual automakers.75
Although other materials are important, increase in exposure is clearly driven by battery elements particularly cobalt, graphitic carbon and nickel. Together, battery materials account for nearly half of exposure for the PHEV fleet. In fact, changes in composition of these three battery elements increase exposure by around $716 million per year for a fleet of this size, of which Cobalt contributes $325M, Graphite contributes $245M and Nickel contributes $146M.
Although not as large in relative magnitude, there are several other interesting elements and materials that create notable exposure. Sheet mica is the eighth largest contributor to exposure, contributing up to $85M.
The supply risks in mica have been analyzed in recent literature 76. It provides unique combinations of
electrical and thermal properties. For these vehicles, its largest use is within the HVAC system. Silver and gold, both precious metal conductors, represent an average of $75 million per year of exposure. The
dataset indicates a growth in use of gold in particular due to an increase in sensors and systems associated with vehicle autonomy (e.g., adaptive cruise control). Although independent of
electrification, growth in vehicle automation is a concurrent trend that will likely increase the presence of these materials in vehicles.
Rare-earth elements like Nd, Dy and Ce are present in large amount in hybrid and PHEV vehicles. The combined exposure from these materials is up to $268 million, a 10x increase from conventional vehicles. These materials are present largely in the traction motors, but are also contained within other parts such as the HVAC, radios and starter motor and switch.
Natural Rubber is an important material that is used predominantly in tires, but is also found in vibration dampeners throughout the vehicle. Natural rubber contributes about $50 million per year in vulnerability to a fleet of this size.
One set of elements provide a notable decrease in exposure with increasing electrification – PGMs (for this set of vehicles this is primarily manifest in decreased use of palladium). Exposure to PGMs drop by about $75M in the PHEV fleet. Manufacturer vulnerability to PGMs are well documented 27,31. They are primarily
3.4. Discussion
We developed a metric that incorporates the concepts of ‘importance’ and ‘susceptibility’ used in literature that evaluates material criticality. We quantified the exposure of automobile manufacturers to disruption in materials supply chains as the increased cost in producing a vehicle fleet if disruption occurs. Our analysis shows that a fleet composed entirely of PHEVs has a ~100% larger exposure to supply chain risks than a fleet of only ICEVs. The largest contributors to the increase are battery-related elements like cobalt, nickel, and graphite (together nearly 40% of total PHEV fleet exposure), but other materials such as copper, gold and natural rubber also contribute significantly. This vulnerability is distributed across many different systems including the battery, transmission, exhaust and engine systems.
Given this increasing exposure, manufacturers need to carefully evaluate the risks and their supply chain and devise mitigation strategies. We will discuss some of the socio-political risks in details in Chpater 4. Automakers should explore the feasibility of dematerialization and substitution for each of the twenty materials identified in Figure 5 with particular focus on cobalt, aluminum, copper, graphite, nickel, and neodymium. Similarly, the firms engaged with supply of these materials should be well aware that increased fleet electrification will likely drive up demand.
Given that materials prices strongly affect the cost-competitiveness of EVs when compared with ICEVs,
an increase in price exposure is a sign of concern for stakeholders promoting fleet electrification.
If disruptions in material supply chains are more likely to increase the cost of EVs compared to ICEVs, the sale of EVs may be slowed down. Stabilizing materials prices and investing in research of alternative technologies will be needed to make EVs cost competitive. Policy makers should explore ways to encourage the development of technologies that will allow for dematerialization, substitution, recycling and environmentally-sound extraction for these materials.
4. Social and Governmental risks in mineral supply chains
4.1. Literature review on assessing risks in materials supply chain
Manufacturers and policymakers aspire to identify materials for which they need to develop a risk-mitigation strategy. Critical materials identification takes place at a corporate level, such as one conducted by General Electric77, as well as the national level such as evaluations conducted by the EU and the US
Department of Energy77–79. This evaluation serves a strategic purpose. The Department of Energy, for
example, developed a materials criticality evaluation with three goals in mind 1) promoting diversification of supply chains to mitigate risk, 2) developing substitutes to materials and 3) promoting materials recycling. Evaluating criticality requires evaluating exposure to risks – as we did in Chapter 3 – as well as evaluating the likelihood of a disruption occurring in the supply chain. The disruption can occur due to many different socio-political reasons that we will discuss further in this chapter. Quantifying these different likelihoods is known as supply risk evaluation.
One could argue that the materials prices we used to define exposure already internalize supply risk. However, price alone is a poor indicator of criticality. For example, gold is a metal that trades at a very high value and is quite volatile, but has a very stable supply for industrial purposes. The volatility in gold prices often stems from speculation, but many financial instruments exist for manufacturers to hedge their risk against gold price volatility. Moreover, gold has a very diversified supply chain and therefore, if supply in one region is disrupted, manufacturers can source gold from other places.
Since materials price and price volatility do not capture the many different aspects of risk in a material’s supply chain, researchers use many indicators to evaluate different social, governmental and geologic risks. Graedel et al69 define a framework for supply chain risk evaluation with three categories:
a) Geopolitical Risk
b) Social and Regulatory Risk
c) Geologic, Technical and Economic Risk
A survey of the literature finds many different types of risks in materials supply chains that have been evaluated by policymakers and industry. The goal of risk assessment is typically to promote supply chain diversification, material substitution and recycling. The risks evaluated can be categorized as a) geopolitical risk, b) social and regulatory risk and c) geologic, technical and economic risk. In this thesis we will focus on social and geopolitical risks.
In this thesis we evaluate the social and regulatory risk as well as geopolitical risk in the supply chain of materials used in vehicles. We do so using three indicators that capture different aspects of risk: supply
concentration, political stability and modern slavery.
We do not estimate the geologic risk as that is not the focus of our study. Moreover, as illustrated by Watson and Eggert72 over 70% of the variability in material prices can be explained by physical and geologic
indicators of supply, such as crustal abundance of a material72. This correlation between geologic and
economic risk indicators with price suggests that we already account for geologic factors in our exposure metric by incorporating price. Using these indicators again would mean double-counting or overestimating the importance of the indicator. Socio-political risks are not often captured by materials price and are therefore important to evaluate independently.