HAL Id: hal-02978265
https://hal-univ-perp.archives-ouvertes.fr/hal-02978265
Submitted on 27 Oct 2020
HAL is a multi-disciplinary open access archive for the deposit and dissemination of sci-entific research documents, whether they are pub-lished or not. The documents may come from teaching and research institutions in France or abroad, or from public or private research centers.
L’archive ouverte pluridisciplinaire HAL, est destinée au dépôt et à la diffusion de documents scientifiques de niveau recherche, publiés ou non, émanant des établissements d’enseignement et de recherche français ou étrangers, des laboratoires publics ou privés.
well-being: lessons learned from localizing the SDGs
Eleanor Sterling, Pua�ala Pascua, Amanda Sigouin, Nadav Gazit, Lisa
Mandle, Erin Betley, John Aini, Simon Albert, Sophie Caillon, Jennifer
Caselle, et al.
To cite this version:
Eleanor Sterling, Pua�ala Pascua, Amanda Sigouin, Nadav Gazit, Lisa Mandle, et al.. Creating a space for place and multidimensional well-being: lessons learned from localizing the SDGs. Sustainability Science, Springer Verlag (Germany), 2020, 15 (4), pp.1129-1147. �10.1007/s11625-020-00822-w�. �hal-02978265�
https://doi.org/10.1007/s11625-020-00822-w ORIGINAL ARTICLE
Creating a space for place and multidimensional well‑being: lessons
learned from localizing the SDGs
Eleanor J. Sterling1 · Puaʻala Pascua1 · Amanda Sigouin1 · Nadav Gazit1 · Lisa Mandle2 · Erin Betley1 ·
John Aini3 · Simon Albert4 · Sophie Caillon5 · Jennifer E. Caselle6 · Samantha H. Cheng1 · Joachim Claudet7,8 ·
Rachel Dacks9 · Emily S. Darling10 · Chris Filardi1,11 · Stacy D. Jupiter12 · Alexander Mawyer13 · Manuel Mejia14 ·
Kanoeʻulalani Morishige9 · Winifereti Nainoca15 · John Parks16 · Jamie Tanguay17 · Tamara Ticktin18 · Ron Vave19 ·
Veronica Wase20 · Supin Wongbusarakum21,22 · Joe McCarter1,12
Received: 16 November 2019 / Accepted: 11 May 2020 / Published online: 25 May 2020 © The Author(s) 2020
Abstract
Achieving sustainable development globally requires multilevel and interdisciplinary efforts and perspectives. Global goals shape priorities and actions at multiple scales, creating cascading impacts realized at the local level through the direction of financial resources and implementation of programs intended to achieve progress towards these metrics. We explore ways to localize global goals to best support human well-being and environmental health by systematically comparing the UN Sustainable Development Goals (SDGs) with regionally-derived well-being dimensions that encompass components of social–ecological resilience across the Pacific Islands. Our research shows that, in the context of the Pacific, there are overlaps but also significant gaps between regional conceptions of well-being and the globally-derived SDGs. Some dimen-sions, related to human health and access to infrastructure and finances, are well represented in the SDGs. Other dimensions of high importance when localizing perspectives of well-being, such as those regarding connections between and across people and place and Indigenous and local knowledge, are not. Furthermore, internationally generated indicators may result in trade-offs and measurement challenges in local contexts. Creating space for place-based values in global sustainability planning aligns with international calls for transformational changes needed to achieve global goals. We identify challenges in applying SDG indicators at the local level and provide lessons learned to foster equitable and holistic approaches and outcomes for sustainability.
Keywords 2030 agenda · Place-based · Sustainable development · International development · Indigenous Peoples and local communities · Pacific Islands
Introduction
The 2030 Agenda for Sustainable Development, adopted by the United Nations in 2015, presents a shared vision for a more prosperous, equitable, and environmentally sustainable
world with no one left behind (United Nations 2015). The underlying Sustainable Development Goals (SDGs) are the result of a complex negotiation process (Kamau et al. 2018; Dodds et al. 2016) and encompass 17 broad and conceptu-ally interlinked global goals, each with nested targets and indicators. Although the SDGs are presented as an indivisi-ble whole, in practice there is little guidance regarding trade-offs and synergies between and across the goals (Nilsson et al. 2016; Singh et al. 2018) or across levels of implemen-tation (Jiménez-Aceituno et al. 2019). Implementation that ignores complex interactions within and across social–eco-logical systems risks increased potential for misdiagnosis and design of interventions with unintended and negative outcomes, including natural resource degradation, perverse incentives, displacement of communities, or loss of food
Handled by Maria Tengo, Stockholms Universitet Stockholm Resilience Centre, Sweden.
Electronic supplementary material The online version of this article (https ://doi.org/10.1007/s1162 5-020-00822 -w) contains supplementary material, which is available to authorized users. * Eleanor J. Sterling
security and sovereignty as just a few examples (Agrawal and Redford 2009; Ramalingam 2013; Waldmüller et al. 2019). Researchers further note that the process of prior-itizing and translating goals and actions across implementa-tion levels ultimately impacts local communities through the direction of financial resources and on-the-ground impact of development strategies (Ramalingam 2013; Schleicher et al. 2018). The Intergovernmental Science-Policy Platform on Biodiversity and Ecosystem Services (IPBES) reports that efforts to meet the SDGs could produce trade-offs for nature that in turn negatively affect human well-being and the achievement of interlinked goals (Díaz et al. 2019).
Thus, achieving the equitable and effective imple-mentation of the interrelated SDGs will require systems approaches—explicitly considering the structure (elements and interactions), purpose, and emergent behavior of com-plex adaptive systems (Preiser et al. 2018). These approaches facilitate a better understanding of how: (i) various SDG goals, targets, and indicators interconnect (Nilsson et al. 2016; Costanza et al. 2016); (ii) SDGs are underpinned by biodiversity and ecosystem services or nature’s contributions to people (Díaz et al. 2019); and (iii) SDGs impact human well-being in different contexts.
As implementation of the SDGs progresses, there is an increasing focus on efforts to “localize the SDGs” at regional, national, and subnational levels. Currently, the term “localizing” emphasizes aggregate reporting that con-tributes to the 2030 Agenda (GTLRG 2016; UCLG 2019). However, ideally localizing should also encompass perspec-tives, knowledge systems, and agencies that address context-specific priorities and actions (Lucci 2015; Jiménez-Acei-tuno et al. 2019). The term “context-specific” or, a related term we use here, “context-relevant” can apply to different policy implementation levels and should include cultural, social, political, economic, environmental, and other reali-ties (Nilsson et al. 2018; IGS 2019; Jiménez-Aceituno et al. 2019). Exploring context-specific nuances also resonates with a place-based approach, i.e., one that emphasizes plan-ning and decision-making by groups of people who share cultural and social systems and make resource decisions within a common geography (McCarter et al. 2018). These approaches recognize that culturally grounded perspectives guide actors and activities within and across socially and geographically meaningful scales (Williams et al. 2013; Sterling et al. 2017b) and reveal contributions of place-based mechanisms and processes toward advancing global sustain-ability goals and transformations (Grenni et al. 2019).
Assessing context-relevant progress towards disparate sustainable development goals depends in part on recogniz-ing the worldviews and perspectives of Indigenous Peoples and local communities (IPLCs), especially given national government commitments to leave no one behind and the United Nations Declaration on the Rights of Indigenous
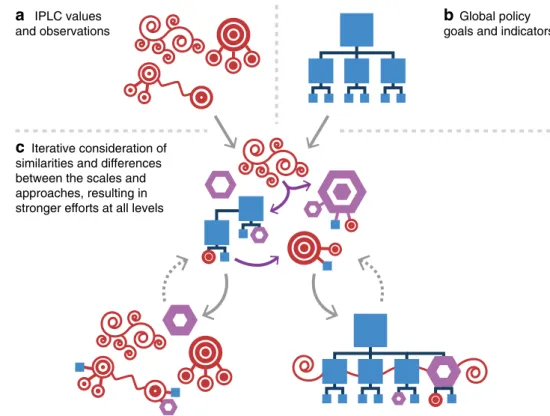
Peoples (UNPFII 2007). IPLCs manage or have tenure rights over more than a quarter of the world’s land surface and their participation and inclusion in environmental governance enhances not only their rights and self-determination but also environmental conservation and sustainable use (Gar-nett et al. 2018; Díaz et al. 2019; Yap and Watene 2019). In addition, IPLC values and observations drive action based on lived and experienced knowledges and expertise (Berkes 2018). Many IPLC perspectives are inherently systems ori-ented because they are based upon and highlight the insepa-rable interconnections between human and non-human parts of a system (Apgar et al. 2011; Jupiter 2017; Artelle et al. 2018) (Fig. 1a), in contrast to the often hierarchical, cir-cumscribed structures of global policy goals and indicators (Fig. 1b). We argue that iterative consideration of similari-ties and differences between these levels and approaches could result in stronger efforts to promote well-being and measure sustainability at all levels (Fig. 1c).
The concept of multidimensional well-being can also contribute to a systems-perspective framing of intercon-nections between human and non-human parts of a sys-tem. Several decades of scholarship on well-being show an evolution from a focus on objective measures of material and social attributes of people’s lives toward more plex approaches, including subjective and ecological com-ponents, that comprise multiple dimensions of living well (King et al. 2014). This recent multidimensional well-being lens moves beyond single-factor human well-being toward including a more holistic and comprehensive set of eco-nomic, political, social, psychological, cultural, and environ-mental factors (Barrington-Leigh and Escande 2018). Using such a well-being lens can provide insights into the power dynamics among social groups, community decision-mak-ing, and the drivers of change (Dawson and Martin 2015), and allows social values and priorities to inform policies and management (Armitage et al. 2012). However, indica-tors of well-being need to be culturally attuned and are best articulated within the well-defined boundaries of a specific place or context (Sterling et al. 2017a, b), for instance among communities of practice in a particular geographic region who manage communal resources (cf. Dacks et al. 2019), or among cultural groups in one particular island nation (cf. McCarter et al. 2018).
To date, several organizations and initiatives have made significant progress in advancing the measurement of well-being in order to monitor societal progress and sustainable development in ways that are attuned to specific local and cultural contexts. For example, at the community level, Indigenous leaders in Tungurahua, Ecuador developed a governance process based on the norms stemming from “buen vivir” (good life), a well-being philosophy based on the vision that nature, community, and individuals all share the same material and spiritual dimensions (Guardiola and
García-Quero 2014). This governance system emphasized, for instance, collective rights over individualism; economic solidarity over economic growth; and sustainable man-agement of resources, education, and health over protect-ing nature from human intervention (Kaufman and Martin 2014). Another example of the contextual development of indicators is the Vanuatu National Sustainable Development Plan 2016–2030 (also known as Vanuatu 2030: The People’s Plan), which characterizes policy objectives, targets, and indicators in relation to traditional and customary values and priorities including “access to land and natural resources, traditional knowledge and production skills, and community vitality” (Tanguay 2015; DSPPAC 2017 “Vanuatu 2030: The People’s Plan”). Other examples of the contextual develop-ment of well-being indicators include organization-specific efforts (i.e., NOAA’s California Current Integrated Ecosys-tem Assessment (Breslow et al. 2017)) and other national-focused plans (i.e., Bhutan’s Gross National Happiness Index (Meier and Chakrabarti 2016), the Aotearoa New Zealand Well-being Budget (New Zealand Government 2019 “Liv-ing Standards Framework”), the United K“Liv-ingdom National Wellbeing Measures (Office for National Statistics 2018)).
Many of these efforts are focused on a single nation, or include several nations, but mostly address human well-being and not environmental components. Dacks et al. (2019) take a different tack with their explicitly multidi-mensional approach to conceptions of well-being (including human and environmental factors) undertaken at a regional scale. Dacks et al.’s regional approach both fills an expressed
need for context-specific definitions of development and provides an important potential scaffolding between inter-nationally derived indicators like SDGs and local-scale impacts (Yap and Watene 2019).
In their regional analysis, Dacks et al. built on a conceptu-alization of resilience being iteratively related to well-being in social–ecological systems (Armitage et al. 2012). Resil-ience or the ability for systems to adapt or transform in the face of change in order to maintain overall function (Folke 2006) is a complex concept. McCrea et al. (2014) consider community resilience as a process “whereby community resources are mobilised in strategic ways by community agents in adaptive responses to change” (p. 270) and well-being is an end state impacted by the adaptive resilience strategies. In this analysis we focus on well-being as an end state, and acknowledge the importance of resilience and other sociocultural factors in achieving well-being outcomes.
The Pacific Islands region is distinguished by its high biological and cultural diversity, and by historical and con-temporary resilience to environmental and social variability (McMillen et al. 2014; Kueffer and Kinney 2017). While specific aspects of well-being can manifest in different ways across the sizable region, Dacks et al. (2019) found common-alities that resonate across Pacific Island communities. They developed a list of regionally-derived factors as an adapt-able road map and entry point for place-based communities in order to address the diverse needs and priorities in the Pacific Islands region. The iterative process used to develop the list involved biological and social scientists, community
Fig. 1 Approaches to devel-opment of goals and indica-tors: learning across levels. a Indigenous Peoples and local community values and observa-tions that drive action result from lived and experienced knowledges and expertise that emphasize the interconnec-tions between parts of a system (represented by red graphics)
b Global policy goals and
indicators are frequently derived using a consensus process and result in highly hierarchical systems where categorized overarching outcomes can be reached through achieving subgoals and targets (repre-sented by blue boxes) c Iterative consideration of similarities and differences between these levels and approaches can result in stronger efforts at all levels (represented by hybrid colors and shapes)
a IPLC values
and observations
c Iterative consideration of
similarities and differences between the scales and approaches, resulting in stronger efforts at all levels
b Global policy goals and indicators
members, and organizers, all of whom work with communi-ties from across the Pacific Islands on resource management and/or cultural vitality, and is described in detail in Dacks et al. (2019). Collectively, the list encompasses a broad suite of critical components of well-being and social–ecological resilience across the Pacific.
Thus, in order to explore how the SDGs can support con-text-specific multidimensional well-being, we systematically compare the SDG indicators with Dacks et al.’s list of factors (Dacks et al. 2019; hereafter described as “Well-being Fac-tors” or “FacFac-tors”) and resulting groupings of Factors (here-after “Dimensions”) (Table 1, S1), We address three main questions: (i) what are the overlaps and gaps between the SDG indicators and the Pacific Islands Well-being Dimen-sions?; (ii) to what extent are the SDG indicators applicable for measuring well-being in the Pacific?, and (iii) based on the above, what are trade-offs or challenges in applying SDG indicators within place-based contexts? Our analysis of over-laps and differences between regional and global levels and approaches can assist decision-makers in navigating the syn-ergies and trade-offs between the SDGs, facilitate localizing the SDGs, and result in better-informed efforts at different levels (Fig. 1).
Materials and methods
SDG indicators
We compiled the 232 SDG indicators from the list finalized by the Inter-Agency and Expert Group on Sustainable Devel-opment Goal Indicators in March 2017 (United Nations Economic and Social Council 2017). Many of these indica-tors are still under construction so we used the list that was available at the time of our analyses, recognizing the poten-tial for our work to contribute to finalizing indicators. Our analyses examined whether the indicators are relevant and well-aligned with place-based decision-making needs in the Pacific; consequently, we eliminated from our analyses those indicators that are intended to be measured through com-parisons at the national level only (e.g., SDG 1.5.3 Number of countries that adopt and implement national disaster risk reduction strategies in line with the Sendai Framework for Disaster Risk Reduction 2015–2030). The resulting list had 162 SDG indicators (Table S3).
Pacific Island well‑being factors
Dacks et al. (2019) identified a list of 89 Well-being Fac-tors and eight overarching Dimensions (including detailed descriptions and place-based examples of each Factor; Fig. 2) that encompass components of social–ecological resilience across the Pacific Islands. The list results from a
series of workshops, syntheses, reviews, and refinement—all conducted across the Pacific Islands region including Fiji, Hawai ‘i, the Marshall Islands, Solomon Islands, and French Polynesia—with cultural practitioners, government and non-government organization representatives, and university stu-dents and faculty. The iterative process used to develop the list carefully accounted for subject matter expert representa-tion, consistency with related explorations, and theoretical saturation of responses; the process to develop and refine the list is outlined in full in Dacks et al. (2019).
Coding: cross‑referencing SDG indicators and well‑being factors
Comparisons of SDG Indicators and Well-Being Factors were undertaken to explore how the SDGs can support con-text-specific multidimensional well-being. In order to do so, we used a multistage expert elicitation approach with a multidisciplinary team of coders. Twenty-two coders under-took a pilot coding of all indicators and Well-being Factors using custom-tailored excel spreadsheets during a workshop in 2017 (see below for coding team description). We then developed a custom, web-based coding interface and eight coders practiced with the interface to determine ease of use. Subsequently we proceeded in two major stages of coding. First, a group of 15 coders conducted gap analysis coding between the SDG indicators and the Factors. At this stage, every indicator was coded by four individuals. Coders were asked to independently assess whether each indicator in their assigned subset could measure any of the 89 Factors. Coders had the ability to choose multiple Factors for an indicator; similarly, a Factor could be linked with multiple indicators. Coders noted if there were no corresponding Factors for an indicator. Second, coders evaluated indicator applicability, trade-off, and measurement challenges using the Pacific Islands context to determine whether indicators were rel-evant and well-aligned with place-based decision-making needs in the region. Coders considered if indicators would be applicable to measure the Factors for different contexts, and if there are any potential trade-offs or measurement chal-lenges. If indicators were considered potentially problem-atic, coders identified the reason(s) using a basic typology of common indicator issues (Table 2); coders were able to select multiple issues or none at all. They provided detailed comments to clarify the ways in which indicators may not be aligned with Well-being Factors. This draft typology of trade-off and measurement challenges was developed, based on the initial coding trials, in working groups between 2015 and 2017; it aligns with the within-SDG interaction scores proposed by Nilsson et al. (2016) ranging from indivisible to consistent to cancelling. Lastly, a team of six coders further coded all 162 indicators to identify indicators with monetary economy-based components or measurement criteria.
Coders: A total of 22 individuals (all of whom are
co-authors on this paper) participated in coding. This coding team belongs to a variety of academic disciplines and pro-fessional backgrounds, including natural sciences (both
terrestrial and marine), social sciences, and community-based natural resource management. Over 20% of coding participants self-identify as Pacific Islander, Native Hawai-ian, or other native/Indigenous cultural background of the
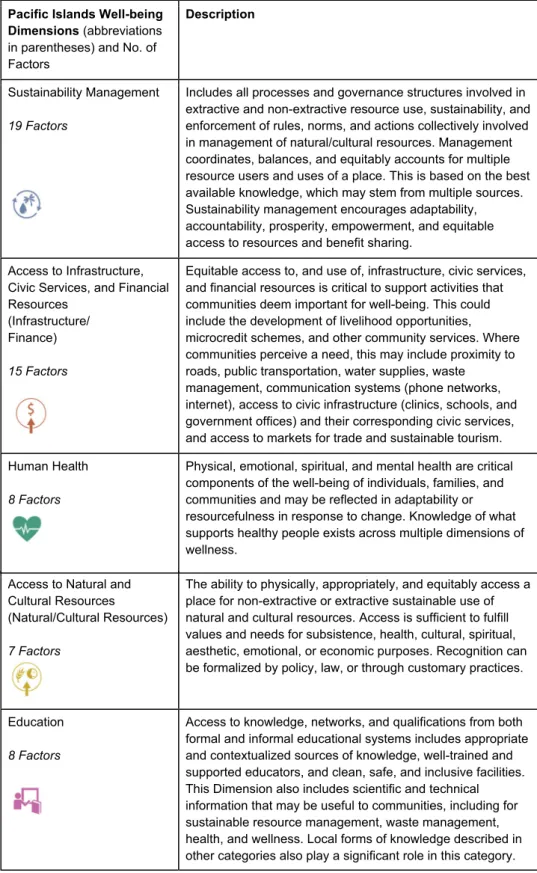
Table 1 The eight Pacific Islands Well-being Dimensions, including the number of underlying Factors in each Dimension, an associated icon, and a brief description of each
Pacific Islands Well-being Dimensions (abbreviations
in parentheses) and No. of Factors
Description
Sustainability Management
19 Factors
Includes all processes and governance structures involved in extractive and non-extractive resource use, sustainability, and enforcement of rules, norms, and actions collectively involved in management of natural/cultural resources. Management coordinates, balances, and equitably accounts for multiple resource users and uses of a place. This is based on the best available knowledge, which may stem from multiple sources. Sustainability management encourages adaptability, accountability, prosperity, empowerment, and equitable access to resources and benefit sharing.
Access to Infrastructure, Civic Services, and Financial Resources
(Infrastructure/ Finance)
15 Factors
Equitable access to, and use of, infrastructure, civic services, and financial resources is critical to support activities that communities deem important for well-being. This could include the development of livelihood opportunities, microcredit schemes, and other community services. Where communities perceive a need, this may include proximity to roads, public transportation, water supplies, waste management, communication systems (phone networks, internet), access to civic infrastructure (clinics, schools, and government offices) and their corresponding civic services, and access to markets for trade and sustainable tourism. Human Health
8 Factors
Physical, emotional, spiritual, and mental health are critical components of the well-being of individuals, families, and communities and may be reflected in adaptability or resourcefulness in response to change. Knowledge of what supports healthy people exists across multiple dimensions of wellness.
Access to Natural and Cultural Resources
(Natural/Cultural Resources)
7 Factors
The ability to physically, appropriately, and equitably access a place for non-extractive or extractive sustainable use of natural and cultural resources. Access is sufficient to fulfill values and needs for subsistence, health, cultural, spiritual, aesthetic, emotional, or economic purposes. Recognition can be formalized by policy, law, or through customary practices. Education
8 Factors
Access to knowledge, networks, and qualifications from both formal and informal educational systems includes appropriate and contextualized sources of knowledge, well-trained and supported educators, and clean, safe, and inclusive facilities. This Dimension also includes scientific and technical information that may be useful to communities, including for sustainable resource management, waste management, health, and wellness. Local forms of knowledge described in other categories also play a significant role in this category.
Pacific Islands region. Collectively the coding team pos-sesses considerable professional and lived experience span-ning diverse areas of the Pacific. Coders were assigned indi-cators that align to their expertise wherever possible and were encouraged to opt out of coding a particular indicator if they felt it to be outside their expertise, in which case the indicator was reassigned to another coder.
Analyses
To assess our question on what are the overlaps and gaps between the SDG indicators and the Pacific Islands Well-being Dimensions, we only included links that were noted
by two or more of a total of four coders. As previously men-tioned, a unique characteristic of the coding team was that all have key experience in one or more Pacific Islands and collectively they represent highly diverse academic disci-plines and professional backgrounds. These diverse perspec-tives were valuable in providing an interdisciplinary and holistic frame of reference for our analyses. It also means that it would be unrealistic to expect unanimous consensus across replicates. This agreement between a minimum of two allowed for inclusion of plausible connections without
being too restrictive. We extracted basic descriptive statis-tics from the resulting database. After determining that the indicator linkages were unevenly distributed across Dimen-sions, we took a more granular look to understand which specific Factors were and were not well-represented by the SDG indicators (Table S2; Fig. S3). Table S2 provides a full list of specific Factors with a high number of linkages to the SDG indicators, and those with no linkages.
To assess our questions, to what extent are the SDG indicators applicable for measuring well-being in the Pacific, and what are trade-offs or challenges in apply-ing SDG indicators within place-based contexts, we used
methods in qualitative data analysis including inductive as well as deductive content analysis (Elo et al. 2014). When coders disagreed on categorization, we met to dis-cuss the discrepancies and came to consensus decisions. We ensured that the coding results were discussed amongst at least four people and undertook member checks (where manuscript authors reviewed the results and analyses at multiple stages) to validate the qualitative data and analy-sis (Merriam 2009). We extracted all coder assessments and conducted a qualitative three-stage analysis. In the first stage, three coders used inductive logic (Charmaz and
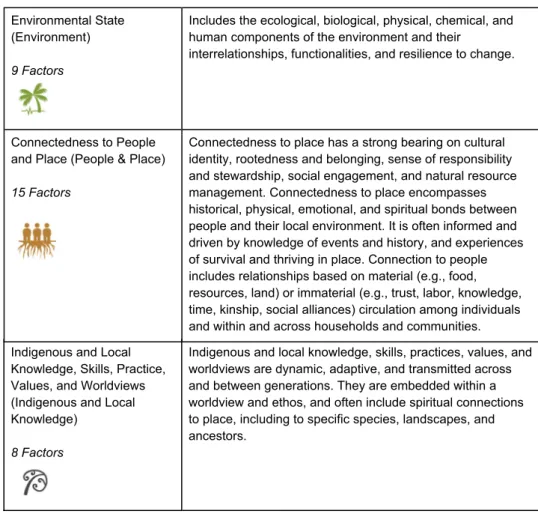
Table 1 (continued) Environmental State
(Environment)
9 Factors
Includes the ecological, biological, physical, chemical, and human components of the environment and their
interrelationships, functionalities, and resilience to change.
Connectedness to People and Place (People & Place)
15 Factors
Connectedness to place has a strong bearing on cultural identity, rootedness and belonging, sense of responsibility and stewardship, social engagement, and natural resource management. Connectedness to place encompasses historical, physical, emotional, and spiritual bonds between people and their local environment. It is often informed and driven by knowledge of events and history, and experiences of survival and thriving in place. Connection to people includes relationships based on material (e.g., food, resources, land) or immaterial (e.g., trust, labor, knowledge, time, kinship, social alliances) circulation among individuals and within and across households and communities. Indigenous and Local
Knowledge, Skills, Practice, Values, and Worldviews (Indigenous and Local Knowledge)
8 Factors
Indigenous and local knowledge, skills, practices, values, and worldviews are dynamic, adaptive, and transmitted across and between generations. They are embedded within a worldview and ethos, and often include spiritual connections to place, including to specific species, landscapes, and ancestors.
Belgrave 2007) to review the assessments, test against the draft typology, and identify patterns within categories. In the second stage a team of four coders reviewed every assessment against the categories, detailing assessment comments where category descriptions were not sufficient and recommending greater detail. This resulted in rich descriptions of the trade-offs and measurement challenges between the international metrics and the Well-being Factors. In the third stage, four individuals conducted a detailed scan and meta-synthesis (Finfgeld 2003) of the second-stage assessment comments to extract examples to illustrate the categories, including comments that noted the emphasis on monetary economy-based aspects (i.e., monetary transactions for goods and services). We also undertook an additional analysis to assess the extent to which indicators rely on “monetary economy-based” met-rics to denote success.
Results
Gap analysis
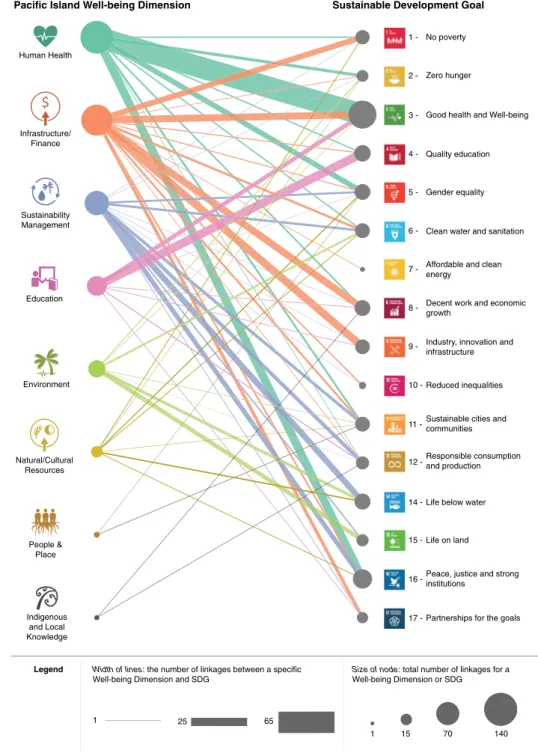
We coded linkages between SDG indicators and Well-being Factors (meaning the SDG indicator might be an effective and accurate measure for that Factor) and identified 447 linkages that were made by at least two individual coders. The greatest number of linkages to the SDGs were from Factors within two Dimensions: Human Health (n = 140) and Access to Infrastructure, Civic Services, and
Finan-cial Resources (Infrastructure/Finance) (n = 126) (Fig. 3, S1). Within Human Health, the Factors with the greatest number of linkages related to physical health (n = 47) and individual and/or collective security and safety (n = 26). For
Infrastructure/Finance, the Factors with the highest
num-ber of linkages were related to access to and use of health Synthesis Phase2Workshops s p o h s k r o W 1 e s a h P
Applicability, Trade-off, and
Measurement Challenges
Analyses
Lessons
learned for
national
reporting and
implementation
agencies
Distillation forcomprehensive list and descriptions of Dimensions and nested Factors
$
Dimensions Factors
Gap Analysis
Dacks et al. 2019
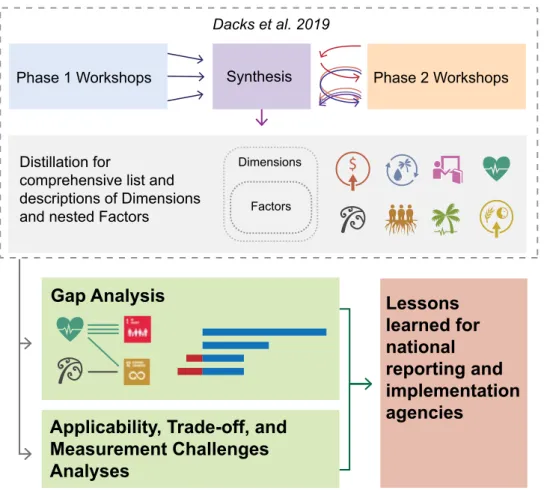
Fig. 2 Iterative process used to develop dimensions and nested fac-tors, and subsequent analyses. As noted in Dacks et al. (2019), dur-ing Phase 1 workshops across multiple locations, a team identified and conceptually grouped characteristics of well-being and resilience in Pacific Island communities, including people and biodiversity. Through an iterative process the team synthesized the results and brought versions of the synthesis to Phase 2 workshops to generate additional characteristics and to review organization of groupings. A subset of the team then distilled the results into a comprehensive
list with descriptions of the Dimensions and nested Factors. This was all published in Dacks et al. 2019 (box with dotted lines). The current paper compares the Dacks et al. list with 162 SDG indica-tors (Table S3) to undertake a suite of analyses: gaps between SDG indicators and Pacific Well-being factors; and applicability, trade-off, and measurement challenges analyses of linked indicators and fac-tors. These resulted in lessons learned for SDG national reporting and implementation agencies
infrastructure and services (n = 25) and equitable access to and use of financial resources and services in vulnerable populations (n = 18) (for further detail see Table S2). Only a handful of SDG indicators were associated with the Dimen-sions Connectedness to People and Place (People & Place) (n = 3) and Indigenous and Local Knowledge, Skills,
Prac-tice, Values, and Worldviews (Indigenous and Local Knowl-edge) (n = 2). The greatest number of linkages were found
with those SDG indicators within SDG 3—Good Health and Well-being (n = 101) (Fig. S2).
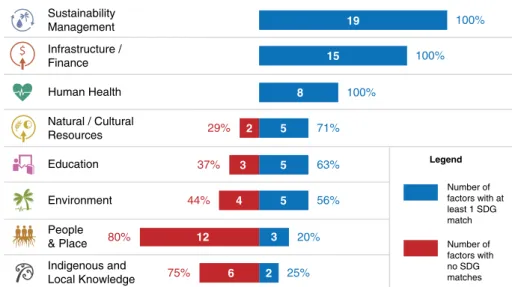
To understand how effectively each Dimension was repre-sented by the SDGs, we calculated the percentage of Factors in each Dimension that were linked to at least one indicator (Fig. 4). Of the 89 Factors scored (Table S1), 62 (70%) have linkages with at least one SDG indicator. All individual Fac-tors within three Dimensions, Sustainability Management,
Infrastructure/Finance, and Human Health were linked to
at least one SDG indicator, as shown in Fig. 4. Only 20% of the Well-being Factors in the Dimension People & Place and 25% of the Indigenous and Local Knowledge Factors were linked with an SDG indicator.
Through the coding activity and subsequent small work-ing group discussions, we identified concepts present in the SDG indicators that had strong bearing on well-being but were not clearly articulated in the regionally-derived Fac-tors. These topics were woven into an updated iteration of the Well-being Factors (Table S1, new additions in bold)
through the creation of four new Factors (e.g., Access to and use of education-related infrastructure and services), strengthening of existing Factors (e.g., expanding the Fac-tor on individual or collective security to focus on social and economic risks in addition to environmental risk), and in revisions to the framing and language used. An updated iteration of the Factors were presented, individually as well as during workshops, back to Pacific Islanders who previ-ously provided contributions to the list, particularly targeting regional-level decision-makers for feedback.
Applicability, trade‑off, and indicator measurement challenges analyses
We deemed 160 SDG indicators, or 99% of the 162 indica-tors analyzed (see Materials and Methods, Table S3), to have context-specific trade-off and applicability issues in some way, encapsulated in 913 coder assessment comments in total from across the coders. We summarized the comments into seven categories that describe the nature of trade-offs and measurement challenges (Table 2).
Perceived practical challenges to indicator measurement encompassed issues, such as ‘Disaggregation’, ‘Feasibil-ity’, ‘Links to Target’, and ‘Scale”. For instance, in terms of ‘Disaggregation’, SDG indicator 14.5.1: “protected area in relation to marine areas” could become more applica-ble with greater specificity in detail on governance type or
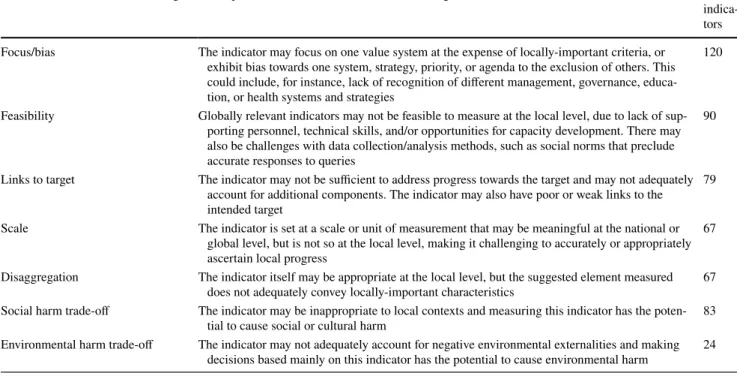
Table 2 Trade-off or measurement challenge categories and descriptions, including the number of indicators classified under each category; this reflects responses for the 160 indicators (out of 162 analyzed) considered to have trade-off or measurement challenges
Note: A single indicator can be listed under multiple categories
Trade-off or measurement challenge Description of trade-off or measurement challenge No. of indica-tors Focus/bias The indicator may focus on one value system at the expense of locally-important criteria, or
exhibit bias towards one system, strategy, priority, or agenda to the exclusion of others. This could include, for instance, lack of recognition of different management, governance, educa-tion, or health systems and strategies
120
Feasibility Globally relevant indicators may not be feasible to measure at the local level, due to lack of sup-porting personnel, technical skills, and/or opportunities for capacity development. There may also be challenges with data collection/analysis methods, such as social norms that preclude accurate responses to queries
90
Links to target The indicator may not be sufficient to address progress towards the target and may not adequately account for additional components. The indicator may also have poor or weak links to the intended target
79 Scale The indicator is set at a scale or unit of measurement that may be meaningful at the national or
global level, but is not so at the local level, making it challenging to accurately or appropriately ascertain local progress
67 Disaggregation The indicator itself may be appropriate at the local level, but the suggested element measured
does not adequately convey locally-important characteristics 67 Social harm trade-off The indicator may be inappropriate to local contexts and measuring this indicator has the
poten-tial to cause social or cultural harm 83
Environmental harm trade-off The indicator may not adequately account for negative environmental externalities and making decisions based mainly on this indicator has the potential to cause environmental harm 24
spatial measures. Details could include the proportion of protected area covered by customary marine tenure, which is not traditionally counted under “protected areas” but is increasingly being considered via categories such as Other Effective Area-Based Conservation Measures promulgated by the International Union for Conservation of Nature. Fur-ther, the spatial extent itself is arbitrary if it does not account for ecological characteristics, such as habitat type (e.g., sand flat, seagrass, mangrove, reef, etc.) and the life histories of species that may inhabit the protected area (Visconti et al. 2019). Several SDG indicators pose potential ‘Feasibility’
issues, which can arise from lack of technical capacity and/ or insufficient methodologies to meaningfully and accurately collect data. For example, different localities may have lim-ited technical ability and resources to comprehensively track financial flows, and flows of goods and services (e.g., indi-cators 16.4.1, 16.4.2), which can result in large data gaps.
In ‘Links to Target’ challenges, an existing indicator might measure one link to a target and overlook other impor-tant aspects of the target. For instance, SDG indicator 15.c.1 on the proportion of traded wildlife that was poached or illicitly trafficked is currently the only available indicator
Fig. 3 Gap analysis of the number of linkages (selected by two or more coders) between Well-being Dimensions and the SDGs, encompassing each link-age made between an underly-ing Well-beunderly-ing Factor and an SDG indicator. The correspond-ing circle size and line width are proportional to the number of linkages; larger circles and thicker lines represent Dimen-sions or SDGs with a greater number of linkages. Of note, due to the removal of redundant and national level indicators, we did not include any indicators under SDG 13: Climate Action
l a o G t n e m p o l e v e D e l b a n i a t s u S n o i s n e m i D g n i e b -ll e W d n a l s I c i f i c a P
Legend Size of node: total number of linkages for a Well-being Dimension or SDG Width of lines: the number of linkages between a specific
Well-being Dimension and SDG
1 15 1 25 65 $ Infrastructure/ Finance Human Health Sustainability Management Education Environment Natural/Cultural Resources People & Place Indigenous and Local Knowledge 1 - No poverty 2 - Zero hunger
3 - Good health and Well-being
4 - Quality education
5 - Gender equality
6 - Clean water and sanitation
7 - Affordable and clean energy
9 - Industry, innovation and infrastructure
10 - Reduced inequalities
12 - Responsible consumption and production
14 - Life below water
16 - Peace, justice and strong institutions
17 - Partnerships for the goals 15 - Life on land
11 - Sustainable cities and communities 8 - Decent work and economic
growth
for SDG target 15.c, which aims to enhance global support to combat poaching, including through increased capacity of local communities to pursue sustainable livelihood opportu-nities. Regarding ‘Scale’ challenges, as one example, SDG indicator 2.5.1 measures the number of genetic resources for food and agriculture saved in medium-term or long-term conservation facilities. These facilities tend to be ex situ and are often difficult for communities to access when needed. This could impede food security at the local level if local conservation facilities, such as community seed banks, do not receive attention.
In the ‘Focus/Bias’ category, coders characterized the greatest number of indicators as exhibiting cultural biases towards a particular knowledge system to the exclusion of other ways of knowing. In the ‘Social Harm Trade-off’ category, these biases translated into the potential for unfavorable and unintended consequences of, for instance, overlooking social–cultural values and norms surround-ing concepts such as poverty, food security, or livelihoods. The Focus/Bias and Social Harm Trade-off categories were often interrelated; for example, coders identified a Focus/ Bias towards formal employment, which could promote the uptake of low-wage employment at the expense of traditional subsistence livelihoods (Social Harm Trade-off). In addi-tion, SDG indicator 8.3.1 measures the proportion of infor-mal employment in non-agriculture sectors with the intent to identify informal labor markets that take advantage of marginalized individuals where legal and social protection is limited. However, intent does not always equal impact— the idea that work within the informal economy is inher-ently problematic could lead to degradation of subsistence labor (ILO 2018). In the ‘Environmental Harm Trade-off’ category, coder assessments identified indicators that could encourage environmental degradation. For instance, SDG indicator 9.2.1 (concerning manufacturing value as a propor-tion of GDP) could promote non-environmentally friendly
manufacturing practices and encourage unsustainable use of natural resources over their conservation or availability for IPLC livelihoods.
Across all categories of challenges, many coders identi-fied trade-offs and measurement challenges with indicators that emphasize monetary transactions for goods and ser-vices. Out of 162 indicators, 25 (15%) included components focusing on or directly relating to the monetary economy. Coder assessments encompassing monetary transactions fell into one or both of two groupings: failure to convey the full breadth of well-being and diversity of local perspectives, and failure to encompass the nature and quality of economic growth. In the first grouping, indicators related to mone-tary compensation (e.g., indicator 8.5.1 regarding hourly earnings of employees) may overlook other aspects of an individual’s livelihood that may be key in place-based and subsistence communities. In the second grouping, failure to encompass the nature and quality of economic growth, coders found that a focus on measuring changes in monetary economy-based indicators fails to consider other important factors, such as potential negative social or cultural impacts related to growth. For instance, coder assessments regard-ing indicator 8.4.2 (related to domestic material consump-tion) pointed out that this indicator encourages material consumption growth, which could lead to greater use of natural resources. It does not measure other factors, such as the sustainability of such growth, including its environmen-tal impact and potential for social harm, especially within place-based communities. Coders also raised the point that focusing on expenditures for activities intended to promote sustainable development overlooks the potential negative impacts of these activities—more funds being spent does not necessarily imply success or beneficial impacts. For exam-ple, coder assessments regarding indicator 17.17.1 (concern-ing the amount of dollars committed to public–private and civil society partnerships) does not lend any insight into
Fig. 4 Analysis of Well-being Dimensions and linkages between the underlying Factors and at least one SDG indicator. Bar length represents the total number of Pacific Island Well-being Factors in each Dimen-sion; percentages represent proportion of Factors within each Dimension that have at least one SDG linkage (blue) or no SDG linkages (red) $ 100% 19 15 8 5 5 5 2 2 6 3 3 4 12 100% 100% 71% 29% 37% 44% 80% 75% 63% 56% 20% 25% Infrastructure / Finance Sustainability Management Education Environment Human Health Natural / Cultural Resources Number of factors with at least 1 SDG match Legend Number of factors with no SDG matches People & Place Indigenous and Local Knowledge
the effectiveness or equity of these partnerships. Monetary indicators are relatively easily measured, but may not be meaningful on their own.
Overall, coder assessments underscored that very few indicators, or sets of indicators under a target, adequately addressed the potential for trade-offs or other feedbacks between goals. The assessments also noted that some indica-tors could better reflect trade-offs with minor modifications, such as greater disaggregation, whereas others might be best addressed through significantly revised or new indicators. Coders highlighted existing language that could be applied more often to address these problems, such as SDG indicator 1.2.2: Proportion of men, women and children of all ages living in poverty in all its dimensions according to national
definitions (emphasis added).
Discussion
Meeting the interconnected SDGs at a global level, while also supporting context-specific sustainable development across levels, entails a careful framing of what transforma-tive development and success look like (Díaz et al. 2019). Our research shows that, in the context of the Pacific, there are overlaps but also significant gaps between regional conceptions of well-being and the globally-derived SDGs. Furthermore, internationally generated indicators may result in trade-offs and measurement challenges at other levels. While the SDGs themselves result from extensive negotiations and represent fixed global commitments, the implementation of the global sustainability agenda hinges on regional, national, and local sustainable develop-ment policies, plans, and programs. Localizing the SDGs requires systems-oriented approaches encompassing both human and ecological dimensions—underscoring the need for measures of multidimensional well-being. Building on a multidimensional well-being focus, efforts to localize the SDGs should consider ways diverse values and perspectives on well-being ultimately drive action (cf. Gasper 2010) as well as the ways generation-oriented planning timelines, such as those of IPLCs, may ultimately impact goals and actions (cf. Yap and Watene 2019). National-level report-ing agencies (such as National Statistics Offices) and sub-national actors (e.g., local and provincial governments, municipalities, associations and networks: GTLRG 2016) are in a unique position to set national priorities, programs, targets, and associated indicators relevant to people of that nation’s varied viewpoints, aspirations, and environmental and cultural settings (Nilsson et al. 2016). Thus, in addition to aggregating existing information across scales, report-ing organizations can create a space for place by describreport-ing and monitoring progress toward goals and targets in ways attuned to place-based contexts. Ideally, as multiple nations
report on context-relevant factors and dimensions that are not currently present in global metrics systems, additional consideration could be given to common themes that arise across these factors and dimensions.
Assessing the overlaps and gaps
Cross-referencing the Pacific Island Well-being Factors with SDG indicators yielded important insights regard-ing overlaps and gaps between regional and global levels. Our analysis shows that some Well-being Dimensions are very well-represented in global metrics: all individual Fac-tors within three Dimensions, Sustainability Management,
Infrastructure/Finance, and Human Health, were linked to
at least one SDG indicator.
However, other Dimensions of well-being important in the Pacific, including People & Place and Indigenous
& Local Knowledge, are under-represented or are only
obliquely referenced in the SDG indicators. These find-ings resonate with gaps revealed in other social–ecological explorations (McKinnon et al. 2016; Dacks et al. 2019), and represent problematic omissions for the SDGs. These find-ings also coincide with calls for stronger representations of culture and community across the SDGs (Poole 2018). The
People & Place Dimension encompasses important
recipro-cal relationships humans maintain with one another and with the environment (McGregor 2007; Kimmerer 2011; Díaz et al. 2019). There is growing evidence that the connections between and across people and place are critical to support and sustain the well-being of both human and natural sys-tems (Chan et al. 2016; Masterson et al. 2017; Dacks et al. 2019). While these relationships exist all around the world (just to list a few examples, see Murray 2014 for Scottish Highlands and Wynne-Jones et al. 2018 for Welsh examples of experiential knowledge of and interconnections between people and place), they are especially well-documented among Indigenous Peoples and local communities (Whyte et al. 2016). The latter research spans disciplines and geogra-phies, including via ecology-centered explorations of human and non-human relationships among Heiltsuk and Herring in coastal British Columbia (Gauvreau et al. 2017) and among Dene, Metís, and Caribou in the Northwest Territories of Canada (Polfus et al. 2016). The research also encom-pases planning and policy-centered work on relationships in Aotearoa New Zealand among the Whanganui tribe and Whanganui river (Magallanes 2015), in Japan among rural communities and satoyama and satoumi social–ecological production land and seascapes (Takeuchi 2012; Duraiappah et al. 2012), and in Australia, Brazil, and Canada among Indigenous Peoples, their territories, and species listed as threatened under the IUCN Red List (Schuster et al. 2019).
Connections and networks within communities can facili-tate knowledge transfer and learning as well as exchange of
resources, particularly in times of need, and their composi-tion can have an outsized impact on support, self-organiza-tion, and resilience in the face of challenges (Ramalingam 2013; Dacks et al. 2018). For instance, varivagana is an important cultural concept in Simbo, Solomon Islands, cen-tered on generosity and reciprocal obligations across social networks (Lauer et al. 2013); in Hawai‘i laulima empha-sizes collective action supported by strong social networks (McGregor 2007). A growing number of international efforts aim to articulate and evaluate these types of connections, such as the Organization for Economic Co-operation and Development’s Better Life Initiative metrics on support networks (OECD 2017). These could serve as models for reporting on these critical connections in context-relevant ways.
In many places around the world, connections between people cannot be discussed in the absence of connections to place (Cuerrier et al. 2015). Moreover, in many IPLC groups across the Pacific and around the world there is no distinction between human and non-human elements of an ecosystem (Dacks et al. 2019)—reciprocal relationships across human and non-human elements of an ecosystem are reflected in cosmologies, place names, sayings, songs, and ceremonies (Liljeblad and Verschuuren 2018). In developing the Pacific Well-being Factors (Dacks et al. 2019), com-munity visioning workshop participants emphasized that relationships between people and their related connections to a place are fundamental to healthy communities. These relationships dictate behavior grounded in deep reverence and respect (Artelle et al. 2018; Yap and Watene 2019). For instance, the Fijian term vanua (lit. land) encompasses the interconnectedness of all living things (including people) and their surrounding environment as well as the associated knowledge, practices, and skills that maintain those interac-tions (Nainoca 2011), a concept mirrored throughout the Pacific (e.g., fanua in Samoan, whenua in Māori; Huffer and Rakuita 2008). For the Māori of Aotearoa New Zea-land, whenua is also the term for placenta, creating paral-lel relationships between mother and child and people and land (Timoti et al. 2017). The conceptualizations of these familial relationships, shared origins, and interdependent futures can provide important context for strong opposi-tion to environmental or development acopposi-tions, plans, or policies that are perceived to result in adverse impacts to non-human relatives or to lands viewed as maternal entities (Yap and Watene 2019). While there are noteworthy efforts to acknowledge connections between and across people and place in environmental policy and management (cf. Liljeblad and Verschuuren 2018), when reciprocal and familial rela-tionships are omitted from decision-making, tensions can flare. As an example, Mauna Kea (or Mauna a Wākea) is the highest summit of the Hawaiian Islands and is of high cultural significance—described in one Native Hawaiian
cosmology as a sacred mountain birthed from the union of Wākea (Sky Father) and Papaowalinuʻu (Earth Mother). Yet, the current governance structure for Mauna Kea is highly criticized for neglecting this cultural importance in land use and land planning decisions. For example, in 2019 heightened public discourse surrounding environmental and development actions on Mauna Kea stalled a billion dollar, international project amidst significant concerns surrounding scientific research ethics and the importance of free, prior, and informed consent from Indigenous Peoples and local communities (c.f. Alegado 2019, Huth 2019).
Reciprocal relationships between humans and the envi-ronment are often paired with corresponding social and cul-tural norms, codes of conduct, and responsibilities, which manifest in different ways based on the social–cultural set-ting. For example, some IPLCs view marine mammals as living relatives and foundational sources of cultural identity; therefore, human interactions with those species (includ-ing harvest when appropriate) are guided by strict cultural guidelines and protocols that limit not only ecological, but also spiritual impacts on the non-human kin (Borré 1991). Ecosystem health and community generosity are also linked through details such as the quality and quantity of specific resources being exchanged, and characteristics like where, when, and how resources are grown or harvested (Lindstrom 2004; Yap and Watene 2019). When considering long-term relationships across people and place, maintaining social exchange networks requires maintaining relationships with the resources themselves (Artelle et al. 2018).
The value systems associated with “alternative” econo-mies, such as those that draw heavily on subsistence and other place-based practices, often inform cultural norms oriented around long-term sustainable interactions between humans and their environment (Kimmerer 2011). There is also an emerging literature on the concept of “solastalgia”— the sense of loss when people’s connection to place is dis-rupted because of changes to that place that can lead to grief, anguish, and ill-health (Connor et al. 2004; Albrecht 2007). Synthesis of these important values into global goals and policies and the full and effective participation of IPLCs in environmental governance is crucial to sustaining well-being in place-based communities and broader society (Díaz et al. 2019), particularly those communities facing relocation in the face of climate change.
The Indigenous and Local Knowledge Dimension con-cerns the processes by which IPLCs develop, refine, and transmit knowledge. Traditional occupations based on Indigenous and local knowledge (ILK), such as subsist-ence fishing and farming, relate directly to food security and sovereignty and are also crucial for social cohesion, the perpetuation of place-based practices and the maintenance of knowledge, values, and cultural protocols associated with those practices (Pascua et al. 2017). ILK also provides the
situational context for IPLC perspectives on resource health, abundance, and relationships between living and non-living elements of an ecosystem (Dacks et al. 2019). However, the development, refinement, and subsequent transmission of ILK is impacted by a number of factors, including govern-ment policy. For example, some governgovern-ments have legis-lation prohibiting specific wildlife harvest practices (e.g., subsistence hunting and fishing), even when sustainably practiced by Indigenous Peoples on Indigenous territories (cf. Lyver et al. 2018). An absence of ILK consideration in resource management planning can result in cascading negative impacts on communities involved in environmental management (Berkes 2018; Lyver et al. 2018; Dacks et al. 2019), which underscores their significance in sustainability planning and interventions.
Our comparison between the SDGs and Pacific Well-being Factors also uncovered gaps in the latter, specifically related to labor rights, education-related infrastructure, cor-ruption, and harassment (Table S1, new additions in bold). While gender and other forms of social equity are consid-ered to be cross-cutting issues and feature in several Well-being Factors, gender equity does not have separate Dimen-sions or Factors because of its broadly applicable relevance (Gupta and Vegelin 2016). In practice this made it difficult to undertake the gap analysis with specific SDG gender–equity indicators, and underscores the challenges in grappling with cross-cutting concepts that can be unintentionally omitted. Gauging applicability, trade‑offs, and measurement challenges of localizing globally developed
indicators
Our analyses revealed not just gaps in connections between the regional Well-being Factors and SDG indicators; we also found that 99% of assessed indicators presented potential trade-offs or measurement challenges that could be problem-atic in some way for use in the Pacific Islands. The imple-mentation process established for the SDGs anticipates this outcome, which is why countries have the freedom to develop tailored reporting tools for their Voluntary National Reporting that are built on indicators that are most relevant to their situations (Nilsson et al. 2016; Global Task Force 2016; UN HLPF 2017). We identified measurement chal-lenges that range from relatively minor issues (e.g., concerns about interpretation) to more fundamental issues, including troubling trade-offs. With the former, small changes to some indicators (e.g., providing greater disaggregation informa-tion on governance type) might result in increased relevance at the regional to regional to local level. However, significant trade-offs arise when there are differing values across levels.
Many indicators are based on social norms that may not be applicable in all cultural contexts, and good intentions about navigating tensions between policy priorities, power
structures, and principles of equity can actually lead to trade-offs within a system that result in social harm (Fisher and Fukuda-Parr 2019; Kulonen et al. 2019). For example, existing SDG education indicators emphasize formal school-ing at the expense of informal learnschool-ing opportunities (Béné et al. 2016). The latter includes situations in which children learn from helping their parents with work, where they can gain local knowledge to enhance productivity, adaptation, and resilience over the long term (e.g., McCarter and Gavin 2014). Similarly, we note that prioritizing formal employ-ment in order to improve social and legal protections for workers creates a trade-off for subsistence-oriented tradi-tional occupations. This can perpetuate the systematic disen-franchisement and further marginalization of IPLCs and the ILK systems that underpin aspects of resilience, particularly in rural areas. As an alternative, the International Labour Organization recognizes traditional occupations, such as subsistence farming and fishing, within the scope of “pro-ductive employment” and “decent work” (ILO 2018).
Furthermore, we found that some indicators could drive activities that harm rights and access for IPLCs. For instance, several SDG indicators imply that central and national governments should safeguard natural or cultural heritage, when in many regions such maintenance is more likely to be supported at the community level (e.g., Melane-sia; McCarter and Gavin 2014). Instead, natural and cultural heritage sites should not only encompass areas of particular importance held by national governments, but also include those held by IPLCs (Liljeblad and Verschuuren 2018), which is consistent with UN development guidelines involv-ing sacred sites, lands, and waters (SCBD 2004).
Similarly, some indicators (e.g., ownership or secure rights of land as outlined in SDG 1.4.2, relying on legally recognized documentation to land) are based on privatiza-tion and individual land rights, ideas that may clash with culturally-mediated relationships to and interactions with place (Carothers 2015). Legally recognized documentation is not standard for land tenure systems in all communities and there may be other ways to articulate that communi-ties “perceive their rights to land as secure”. Resource pri-vatization (for example, with the introduction of individual fishing quotas in Kodiak Alaska as described in Carothers 2015), can have divisive, negative impacts on the cultural norms, values, and lifestyles that contribute to maintaining reciprocal relationships and well-being across people and place. Moreover, in many Indigenous communities around the world the term “rights” is often paired with the term “responsibilities” (Kimmerer 2011; Vaughan and Vitousek 2013; Artelle et al. 2018). Placing emphasis on property or access rights without reference to responsibility could break down existing stewardship structures, for example col-lective or communal resource management systems (Filer 2017; Berkes 2018). Adaptive understandings of access and
ownership will be increasingly important as communities around the world begin to experience the impacts of global climate change (e.g., those losing their ancestral lands to sea-level rise).
Our analysis also indicated that SDG indicators tend to center on the monetary economy, which may fail to align with local norms and values and reflects a lack of a systems approach and consideration for multidimensional well-being. Our observations regarding the monetary economy focus seem to coincide with biases observed by other researchers; for example in a review of well-being assessments, McKin-non et al. (2016) identified a bias toward using economic constructs as the primary assessment tool. An overemphasis on the monetary economy can cause social or cultural harm by devaluing other important forms of reciprocity-oriented social norms (Giannetti 2015; Artelle et al. 2018). One such imperiled value encompasses the knowledge and practice of growing and sharing food within and across communi-ties, which ultimately impacts food security and sovereignty (Nanau 2011; Vaughan et al. 2017).
Economic assumptions, such as individual maximization, are often at odds with Indigenous and local perspectives on collective well-being and with long-standing commu-nity practices in which the non-monetary benefits of recip-rocal human and environmental interactions may outweigh financial incentives or returns (Winthrop 2014). Economic models that commodify natural resources and prioritize opti-mization and utility can lead to unsustainable resource use, which, in turn, can result in both environmental and social harm (Costanza et al. 2014a, b; Gupta and Vegelin 2016). This may also lead to policies, regulations, and manage-ment actions that prioritize individualistic pursuits of ben-efits (i.e., individual wealth). Individual benben-efits that accrue at the expense of social norms, community cohesion, and community trust, can drive political and social instability (Vaughan et al. 2017). In addition, prioritizing ecosystem services that are the most easily assessed using monetary valuation techniques can diminish the importance of other values of nature, for example relational, intrinsic, cultural heritage, and subsistence values (Tanguay 2015; Pascua et al. 2017; Ban et al. 2019). Indicators that run counter to social norms potentially limit the ability to collect accurate data, and may also have long term impacts on communi-ties such as “deficit thinking” in response to vulnerability frameworks (Maru et al 2014; Sterling et al. 2017a; Yap and Watene 2019). Moreover, monetary prioritization can facilitate negative trade-offs with other aspects of well-being and it is important to focus on the nature and quality of growth, rather than volume of growth alone (Costanza et al. 2016). A disproportionate focus on economic growth also fails to take into account that above a certain income level more growth does not necessarily lead to greater well-being (Costanza et al. 2014b).
Key lessons learned
Our analyses highlight opportunities to enable and support reporting organizations to describe and achieve progress toward goals and targets in ways attuned to place-based con-texts. Building on the remarkable work already undertaken in the context of SDGs, we offer five lessons learned, of relevance to localizing the SDGs.
1. Enhance systems-based approaches to designing and
evaluating policy and management. A growing literature
is acknowledging and investigating the interrelationships among the SDGs, and within other policies that impact well-being sectors (Jenkins et al. 2018; Díaz et al. 2019). This systems approach allows for identifying, mapping, and leveraging synergies between and across multidi-mensional measures of sustainability and well-being. Seeking to understand the cross-sectoral synergies for policy and action can produce co-benefits across goals and targets, and improve indicators and datasets for localizing the SDGs. At the same time, intent does not equal impact. People developing or choosing to use an indicator should carefully consider context specificity and anticipate the dynamic interactions within complex adaptive systems that might lead to negative conse-quences for human well-being and environmental health. 2. Draw on context-relevant definitions of well-being to
develop monitoring and evaluation indicators. Given
the importance of multidimensional well-being and context specific factors that contribute to well-being, decision-makers should spend more effort and attention on understanding what well-being means to their con-stituents in order to collectively move towards sustain-ability. Similarly, reporting bodies should be attentive to context-specific priorities and values and recognize the importance of place-based approaches that lead to co-created knowledge and action. This may help deci-sion-makers avoid unintended harmful consequences in complex adaptive systems, especially when development interventions are based on globally defined standards or approaches. In locations with high cultural diversity and/ or low social cohesion, identifying commonalities, and focusing on indicators around those is a good starting point.
3. Foster identification and use of meaningful indicators
on the connections between both people and place, and on Indigenous and local knowledge. Creating a space
for place, which involves understanding the ways people connect with place and with one another, is essential for sustainable outcomes. Small changes to some indicators (e.g., providing greater disaggregation information on governance type such as recognizing community-con-served areas as well as government-led protected areas)