Université de Montréal
Corticospinal excitability not affected by negative motor imagery or intention
par Inge Broer
Département de psychologie Faculté des arts et des sciences
Mémoire présenté à la Faculté des arts et des sciences en vue de l’obtention du grade de M.Sc. en psychologie
Résumé Français
Bien que l’imagerie motrice positive ait été bien étudiée et est utilisée en réhabilitation, l’effet de l’imagerie motrice négative est beaucoup moins connu. Le but de cette recherche était de définir si l’intention et/ou l’imagerie motrice négative serait en mesure de réduire l’effet d’une stimulation magnétique transcrânienne (SMT) sur le cortex moteur. Vingt participants ont reçu trente stimulations de SMT dans trois situations différentes : En restant passif, en portant une attention particulière aux sensations dans leur main ou en tentant de réduire l’effet de la SMT. La moitié des participants ont utilisé une stratégie d’imagerie motrice, l’autre moitié leur intention. Dans les deux cas, l’amplitude dans la condition de modulation n’a pas été réduite de façon significative.
Mots Clés Français
TMS, modulation, cortex moteur, volonté, main, imagerie motrice, électromyographie, humains, activité/activation motrice, performance psychomotrice
Résumé Anglais
Although positive motor imagery has been widely studied and is used in rehabilitation, the effect of negative motor imagery on our motor system is less well understood. Our goal was to ascertain whether intention and/or negative visual imagery is effective in decreasing the twitch resulting from transcranial magnetic stimulation (TMS) over the primary motor cortex.
Twenty participants received 30 TMS stimulations in three different conditions: remaining passive, paying particular attention to the sensations in their hand, and attempting to modulate the amplitude of the resulting movement. To do this, half the participants used an imagery strategy, whereas the other half used an intention strategy. In both cases, amplitude in the modulation condition was not significantly reduced.
Mots Clés Anglais
TMS, modulation, motor cortex, volition, hand, motor imagery, electromyography, humans, motor activity/activation, psychomotor performance
Table des matières
RÉSUMÉ FRANÇAIS ... III MOTS CLÉS FRANÇAIS ... III
RÉSUMÉ ANGLAIS ... IV MOTS CLÉS ANGLAIS ... IV
LISTE DES TABLEAUX ... VII LISTE DES FIGURES ... VIII LISTE DES ABRÉVIATIONS ET SIGLES ... IX REMERCIEMENTS ... X
INTRODUCTION ... 1
Transcranial magnetic stimulation ... 1
Corticospinal Excitability (CSE) ... 4
Attention ... 12 Subjective Experience ... 12 OBJECTIVES ... 14 METHODS ... 15 Ethical Considerations... 15 Subjects ... 16 TMS stimulator ... 17 Data recording ... 17 Protocol ... 19 Subjective Questions ... 22 RESULTS ... 23 Missing data ... 23 Measure correlates ... 23 Batch effect ... 23
Effect of the order of conditions ... 24
Conditions ... 24 Strategy ... 29 Questionnaires ... 30 Correlations ... 31 Subjective Measures ... 32 Conditions ... 33 DISCUSSION ... 36 RÉFÉRENCES ... 43 DOCUMENTS SPÉCIAUX ... X APPENDIXE 1–QUESTIONS SUBJECTIVES APRÈS CHAQUE ESSAI ... X APPENDIXE 2–CERTIFICAT D’ÉTHIQUE ... XI
APPENDIXE 4–QUESTIONS SUBJECTIVES ENTRE LES CONDITIONS ... XVIII APPENDIXE 5–QUESTIONNAIRE POST-EXPÉRIMENTAL ... XIX APPENDIXE 6–QUESTIONNAIRES ... XX
Appendix 6a – Mindfulness Awareness Attention Scale (MAAS) ... xxi
Appendixe 6b - Self-Regulation Schedule (SRSc) ... xxii
Appendixe 6c - Body Awareness Questionnaire ... xxiv
Liste des tableaux
Table I – Correlations Between Movement Measures Table II – Batch Effects per Condition
Table III – Significant Differences in the Modulation Condition compared to Control Table IV – Differences Between Modulators and Non-modulators on Successful Trials Table V - Modulators compared to Non-modulators on Questionnaires
Table VI – Correlations between Questionnaires
Liste des figures
Figure 1 – Typical Distance Trial
Figure 2.1 - Distribution of Modulators per Measure
Figure 2.2 - Proportion of Trials in the Modulation Condition Below the Mean of the Control Condition
Figure 2.3 - Proportion of Trials One Standard Deviation Below the Mean in the Modulation Condition
Liste des abréviations et sigles
ADM : Abductor Digiti Minimi ANCOVA: Analysis of Covariance ANOVA: Analysis of Variance APB : Abductor Pollicis Brevis BA : Brodmann’s AreaBAQ: Body Awareness Questionnaire CÉGEP: Collège d’Enseignement Général Et Professionnel
CÉRFAS: Comité d’Éthique de la Recherche de la Faculté des Arts et des Sciences.
CNV: Contingent Negative Variation CSE: CorticoSpinal Excitability CSE: Corticospinal Excitability D-wave : Direct-wave
EEG : ElectroEncephaloGraph EID : Extensor Indicis Proprius FDI : First Dorseal Interosseus
fMRI : functional Magnetic Resonance Imaging
GABA-A: Gamma-Aminobutyric Acid type A
GABA-B: Gamma-Aminobutyric Acid type B
I-wave: Indirect-wave
ICF : Intracortical Facilitation IPL: Inferior Parietal Lobe
LICI : Long Interval Cortical Inhibition M1 : Primary Motor Cortex
MAAS : Mindful Attention Awareness Scale
MEP : Motor Evoked Potential
rTMS : repeated Transcranial Magnetic Stimulation
SICI: Short Interval Cortical Inhibition Sig.: Significant
SMA : Supplementary Motor Cortex SPL: Superior Parietal Lobe
Remerciements
À Hugo Théoret: Merci de m'avoir accueilli comme étudiante. J’aprécie énormément le fait d’avoir pu faire ce dernier bout de voyage sous ton aile. Merci de m'avoir aidé à structurer mon discours, et à trouver ma voix de scientifique.
À Mario Beauregard: Merci de m'avoir donné pas un, pas deux, mais trois projets à connaître intimement. Merci de m'inspirer à garder l'esprit ouvert et à toujours, toujours suivre les preuves, quelles qu’elles soient.
À Laurence Dumont: Merci infiniment d’avoir été ma compagne de voyage. Merci d’avoir travaillé côte à côte avec moi, merci d’avoir été si généreuse: d’avoir partagé joies, peines, savoir, sagessse et inspiration avec moi.
To Lydia Mychaltchouk: Thank you so much for having been there, for having helped me out of a long tunnel of shame with your listening ear and compassionate heart. Thank you for believing so ardently in me.
To Sean Cronin: Thank you, Sean, for loving me enough to give me serious kicks in the butt when I need them.
Aan Papa & Mama: Ik ben jullie héél dankbaar voor deze ervaring die jullie mogelijk hebben gemaakt door jullie steun maar ook voor de liefde voor leren dat jullie met mij hebben
Introduction
Transcranial magnetic stimulation
Transcranial magnetic stimulation (TMS) works through Faraday’s principles of
electromagnetic induction (Pascual-Leone, Walsh & Rothwell, 2000). An electric current creates a magnetic field, which induces current in the brain and stimulates neural tissue. The neural tissue then fires a rapid series of impulses, followed by a period of deactivation (Bolognini & Ro, 2010). For a single pulse, this whole process takes anywhere between 20 and 200ms depending on the strength of the initial pulse (Pascual-Leone et al., 2000). TMS has a range of spatial and temporal resolutions. It is possible to change the coil size, and thus the size of the area TMS stimulates, the intensity of the current as well as the repetition of the current (Bolognini & Ro, 2010). Its effect is most often of disrupting function, although with repetitive TMS, it is also possible to enhance functionality, although only temporarily (Huang, Edwards, Rounis, Bhatia, & Rothwell, 2005). TMS has mostly been used to define the
relationships between focal activity and behavior (Pascual-Leone et al., 2000). In contrast to imaging techniques, which permit the establishment of correlations between brain areas and function, TMS allows an attribution of causality. Because a TMS pulse can disrupt function at specific times during an action, the establishment of timelines for cortical regions implicated in certain actions is also possible (Pascual-Leone et al. 2000).
In contrast to actual lesions, the temporary functional lesions caused by TMS are not individually variable or compensated for by plasticity. It provides an interesting control for understanding compensatory and plasticity mechanisms in patients with lesions. In this way, TMS also helps map functional connectivity. Other new applications with patients are
emerging: TMS holds the possibility for functional enhancement as well. For instance, in stroke patients, it was found that stimulating the non-affected M1 with rTMS helped improve motor function in the affected hand (Takeuchi, Chuma, Matsuo, Watanabe, & Ikoma, 2005).
However, despite these applications for TMS, there are certain limitations. First of all, TMS can only be applied to surface areas underlying the scalp. Second, it is not possible to know, without in vivo recordings, exactly how much cortical area is affected. The spread and extent of the current can also be variable and is impossible to assess. Finally, because of the loud click and scalp sensations TMS can produce, it is important to include these in control
conditions, making it hard to design a sham condition that is credible to experimental subjects (Bolognini & Ro, 2010).
Because the primary motor cortex (BA 4) lies on gyri and sulci at the surface of the brain, it is easily accessible to TMS. In fact, using TMS on the motor cortex permits the study of
different motor processes. A single pulse activates direct and indirect corticospinal neurons, resulting in D-waves (direct) and I-waves (indirect; activated via interneurons) measured at the level of the cervical spinal cord (Houlden, Schwartz, Tator, Ashby, & Mackay, 1999). These different waves then activate motoneurons that innervate the muscle. I-waves are
preferentially evoked, reflect excitability, are of trans-synaptic origin (Nakamura, Kitagawa, Kawaguchi, & Tsuji, 1997), and are the primary source of input to hand muscles (Houlden et al., 1999).
When a single TMS pulse is strong enough (over the Motor Threshold), the muscle at the end of the pathway of neurons is triggered and creates an involuntary movement. The single pulse lasts 100 microseconds, includes both inhibitory and excitatory phenomena (Nakamura et al.
1997) and is proven to be completely safe when certain precautions are taken (Rossi, Hallett, Rossini, & Pascual-Leone, 2009). The muscle activity induced by a single TMS pulse (MEP, motor evoked potential, measured by electromyography (EMG)) is the result of motor cortex excitatory effects (Nakamura et al. 1997). By comparing MEP activity between different experimental conditions, conclusions can be drawn about what affects corticospinal excitability.
Paired pulse TMS demonstrates that both inhibitory and excitatory effects are active at the cortical level. Two pulses (one under the motor threshold and the other above) are fired at different intervals. When the first stimulus is under the motor threshold and is followed by a second, suprathreshold pulse 2-5ms later, inhibition occurs. This is thought to be mediated by GABA-A mechanisms and is called short interval cortical inhibition (SICI). When both pulses are suprathreshold and at an interval of 100-200ms a different type of inhibition occurs,
mediated by GABA-B mechanisms (Nakamura et al. 1997). Because of its longer interval, it is called long interval corticali (LICI). Finally, when the first stimulus is under the motor
threshold and is followed by a second, suprathreshold pulse 7-15ms later, intracortical facilitation (ICF) occurs.
TMS of the motor cortex thus activates a downward network of neurons: cortical,
interneurons, corticospinal neurons (Shibasaki, 2012), and finally the muscle whose activity is measurable by EMG. Action does not start in M1, however. Many cortical and subcortical structures have connections to M1. In this way, higher cognitive functions, but also environmental cues can modulate activity in M1. In fact, Haggard (2008) distinguishes between two different networks that end at M1: one for voluntary actions and one for
stimulus-based reactions. In essence, voluntary actions recruit the prefrontal cortex, pre-supplementary motor area (preSMA) and the pre-supplementary motor area (SMA), the basal ganglia and finally M1. In contrast, a secondary network that has sensory guidance as a role uses the premotor cortex, the primary sensory area and parietal cortex (Haggard, 2008). This aspect of volition influencing M1 offers an interesting question as to whether it is possible to intentionally increase or decrease the downward M1 network when a TMS pulse is applied.
Corticospinal Excitability (CSE)
Corticospinal excitability refers to a state of reactivity of the entire motor system, including motoneurons at the cortical and spinal levels. Klein-Flügge, Nobbs, Pitcher, and Bestmann (2013) contend that variability in corticospinal excitability tracks the state of action
preparation.
Variability in corticospinal excitability is most often measured over different trials at the muscular level. Usually, EMG is used to measure MEPs at the level of the muscle. This gives a measure of how excitable the cortico-spinal system is. It is possible to separate the unique contribution of spinal neurons by using catheter electrodes in cases of spinal surgery (Kaneko et al., 1998) or by eliciting the H-reflex, a more accessible technology. The H-reflex is evoked by electrically stimulating afferent nerves, which produces a reflex that activates the
motoneurons and results in efferent motor nerve activation. EMG responses result in an M-wave at 3-6ms, an H-M-wave at 28-35ms and an F-M-wave that taken together give an indication of the excitability of motoneurons at the spinal level (Fisher, 1992; Palmieri, Ingersoll, &
Hoffman, 2004). Many networks in the brain converge on M1 and have a role in determining motor output. These networks and their functions thus play a role in increasing or decreasing corticospinal excitability.
Factors that increase corticospinal excitability (CSE).
A number of different cognitive and emotional processes play a significant role in modulating corticospinal excitability. Observation of others performing actions, negative emotions, worry, as well as mental imagery are all known to increase corticospinal excitability.
Observation. Observing others moving acts as a preparation for the motor cortex, and increases corticospinal excitability (Williams, Pearce, Loporto, Morris, & Holmes, 2009). Corticospinal excitability increases preferentially with the observation of biological actions, especially when the actions are transitive (i.e. object-related, goal-directed movements; Enticott, Kennedy, Bradshaw, Rinehart, & Fitzgerald, 2010), providing support for the notion that intentionality may play a role in action observation and preparation. Along the same lines, when an action is first observed, then imitated, subsequent observed actions show even higher increases in corticospinal excitability (Sakamoto, Muraoka, Mizuguchi, & Kanusue, 2009). This effect does not exist when the executed action differs too much from the observed action.
Emotion. Emotional stimuli can also increase action preparation. Both unpleasant emotional visual stimuli (Coelho, Lipp, Marinovic, Wallis, & Riek, 2010; Coombes et al. 2009) and unpleasant emotional auditory stimuli (Komeilipoor, Pizzolato, Daffertshofer, & Cesari, 2013) have been shown to increase corticospinal excitability. For example, worrying has been shown to increase corticospinal excitability (Oathes, Bruce, & Nitschke, 2008).
Motor imagery. Motor Imagery refers to the simulation of a movement in one’s mind, without sending direct motor commands to the related muscles (Hétu et al., 2013). There are many types of motor imagery. The most common are visual imagery, kinesthetic imagery and laterality judgments. Visual imagery consists in imagining seeing oneself doing an action,
either from a first person or a third person perspective. Kinesthetic imagery refers to
imagining feeling oneself doing the movement. Munzert, Lorey, & Zentgraf (2009) point out that visual imagery is focused on external aspects, whereas kinesthetic imagery is more focused on internal states. Laterality judgment tasks, on the other hand, are a more implicit measure of motor imagery. Subjects are asked to report the laterality of a body part presented visually in different angular orientations. In order to answer the questions, individuals
mentally rotate their own body parts and match them to the presented image (Parsons, 1994; 2003).
There is a general consensus that motor imagery shares important neural circuitry with movement observation and movement execution (Lepage, Saint-Amour, & Théoret, 2008; Hétu et al. 2013; Grezes & Decety, 2001; Jeannerod, 1995; Munzert et al., 2009). Indeed, a meta-analysis conducted by Hétu et al. (2013) reveals that motor imagery recruits a network of fronto-parietal as well as subcortical regions. In the parietal cortex, the inferior parietal lobule (IPL), supramarginal gyrus and superior parietal lobule (SPL) are consistently activated (Hétu et al., 2013). These regions project to pre-motor and motor areas and are an important sensory integration hub. The parietal cortex contains internal models and representations (Buxbaum, Johnson-Frey, & Bartlett-Williams, 2005). The premotor areas they project to (such as the inferior frontal gyrus and the supplementary motor area (SMA)) are consistently reported to be activated during motor execution (Fogassi & Luppino, 2005; Wise, Boussaoud, Johnson, & Caminiti, 1997).
In addition, motor imagery recruits subcortical regions such as the basal ganglia, putamen and pallidum, which are linked to the selection of motor programs during motor execution. Motor
imagery also recruits cerebellar regions such as the vermis and lobules VI and VII, which are involved in several types of movement (Hétu et al., 2013; Mottolese et al., 2013).
Although motor imagery and movement execution share important neural circuitry, a meta-analysis by Hétu et al. (2013) revealed an important difference. They report that M1 was not consistently activated by motor imagery in neuroimaging studies. In fact, they found that only 18% of the surveyed studies reported M1 activation. Although this result is consistent with the definition of motor imagery: “simulation in one’s mind of a movement, but without the
explicit movement”, this finding is a matter of debate because it is inconsistent with TMS studies that clearly show that motor imagery affects corticospinal excitability (Fadiga et al., 1998; Stinear, Byblow, Steyvers, Leven, & Swinnen, 2006; Bufalari, Sforza, Cesari, Aglioti, & Fourkas, 2010; Bonnard, Spieser, Meziane, De Graaf, & Pailhous, 2009). It is possible that M1 activity is not observed in neuroimaging studies because of fMRI’s lack of sensitivity and temporal resolution. Because participants are completely still in an fMRI, M1 may generally be underactivated. Even if a small area of M1 is activated during a motor imagery task, the effect may be drowned by the general inactivation of surrounding areas. One way to get around this problem is to define M1 as a region of interest; one study did this and found activity in M1 (Sharma, Jones, Carpenter, & Baron, 2008), although participants were motor imagery experts. On the other hand, it is also possible that studies that report M1 involvement comprised participants that actually performed the movement while they were imagining it (Hétu et al. 2013).
Motor imagery appears to affect the corticospinal excitability of the muscles involved in the imagined movement, but not in every case. Most studies examining the motor imagery of
simple movements found that corticospinal excitability increased for those muscles targeted by the mental image (Stinear & Byblow, 2003; Stinear et al., 2006; Fadiga et al., 1998). Moreover, in a mental rotation study, a variation of a laterality judgment task, a TMS induced disruption of the M1 hand area delayed answers about hand rotations more than foot rotations, indicating that the primary motor cortex is causally involved in mental rotation tasks and that mental rotation tasks are specific to the rotated body part (Ganis, Keenan, Kosslyn, & Pascual-Leone, 2000). However, the effects of motor imagery on corticospinal excitability are not limited by the feasibility of the movement. For example, Bufalari et al. (2010) asked subjects to imagine impossible and possible movements. Although motor imagery was not limited by feasibility, it was specific to the muscles involved in the impossible movement. That being said, some results show that motor imagery for one body part can increase corticospinal excitability for another, attesting to the interconnectedness of M1 (Sehm, Kipping, Schäfer, Villringer, & Ragert, 2013). In sum, corticospinal excitability increases are not necessarily specific to the muscles implicated in the imagined movement. Rather, excitability effects seem to spread through M1.
Another important point to mention is that different strategies of motor imagery recruit different areas in the brain. Kinesthetic imagery seems to recruit the left premotor (IFG and precentral gyrus) and parietal cortex (IPL and pre cuneus) more than visual imagery (Hétu et al. 2013). Interestingly, Guillot et al. (2008) showed that good and bad motor imagers recruit different areas of the brain. People who are good at motor imagery recruit the parietal and ventromedial premotor cortices (the sensory guidance circuit), whereas people who are bad at it recruit the cerebellum as well as orbitofrontal and posterior cingulate cortex (the voluntary system). Considering that parietal regions are known to be sensorimotor integration hubs and
that kinesthetic strategies where one must focus on what it feels like to perform an action recruit these regions, it is not surprising that kinesthetic strategies are more efficient in increasing corticospinal excitability than others (Stinear et al. 2006; but see Fourkas, Avenanti, Urgesi & Aglioti, 2006).
Finally, it is also known that certain specific factors contribute to a better modulation of corticospinal excitability. The vividness of movement imagery questionnaire-2 measures the ability to make vivid images of movement. It was shown to be related to motor imagery ability and to TMS-induced MEP amplitudes during motor imagery (Williams, Pearce, Loporto, Morris, & Holmes, 2012). This demonstrates that some people are better than others at modulating their corticospinal excitability through motor imagery. Collet, Guillot, Lebon, MacIntyre, and Moran (2004) also developed a measure based on different skills
(psychophysiological, chronometric, psychometric and qualitative) to assess motor imagery capacity. Hétu et al. (2013) further reveal that there may be age, sex, motor expertise and practice effects modulating individual differences.
Factors that decrease cortico-spinal excitability
To our knowledge, five TMS studies have examined factors that decrease corticospinal excitability. Using different strategies and experimental designs, each shows that it is possible to down-regulate corticospinal excitability and the TMS-induced movement.
Relaxation seems to diminish excitability at both the cortical and spinal levels. Fujisawa et al. (2010) demonstrated that a 3-hour relaxation period diminished both MEPs and F-waves. After a 3-hour relaxation period, both measures were significantly below baseline levels. However, when incorporating motor imagery into the 3-hour relaxation period, F-wave
measures returned to 94% of the baseline level and MEP levels returned to 77% of baseline levels. This shows that both relaxation and motor imagery operate at the cortical level as well as spinal levels.
Sohn, Wiltz, and Hallett (2002) set out to examine the specific cortical processes involved in relaxation. To do so, they used a go/no-go paradigm. Upon a cue, participants reacted quickly either by staying relaxed (no-go) or producing a movement (go). TMS was triggered at the average response time of a practice condition. There was no reaction task in the control condition. They measured activity in two muscles: extensor indicis proprius (EIP) and abducutor digiti minimi (ADM) in 7 participants. They found that in the No-go task, SICI increased in both EIP and ADM, whereas in the go task SICI was reduced only in EIP. LICI was reduced in both conditions, but ICF was not altered in either condition. It thus seems that LICI and SICI are differentially involved in the execution and suppression of voluntary movements.
Sohn, Dang & Hallett (2003) then performed a slightly altered experiment. This time, they contrasted positive imagery with relaxation in a go/no-go task. Instead of triggering TMS at the average response time, TMS would occur 2 seconds after the cue. This eliminated the aspect of quick reaction in the previous paradigm. They also examined different muscles: first dorseal interosseus (FDI) and abductor pollicis brevis (APB) in addition to ADM. They examined these processes using both single and paired-pulse TMS. Relaxation reduced MEP size compared to the control condition. The reducing effect of relaxation was specific to FDI, as ADM and APB MEP size was not reduced significantly. Neither the inhibitory mechanisms of SICI or LICI, nor the excitatory effects of ICF explained this effect, as there was no change
between conditions. That being said, contrary to Fujisawa et al. (2010), they concluded that relaxation operates on a cortical level, for there were no differences in F-waves observed between conditions. Furthermore, they did not find significant increases in MEPs for positive imagery. This may be due to the fact that they only observed seven volunteers, for fewer trials than in the relaxation condition and that they used the left hand, since the right motor cortex is thought to be more involved in inhibitory processes than the left hemisphere (Fadiga et al., 1998).
In contrast, Bonnard, Camus, De Graaf and Pailhous (2003) examined the left hemisphere. This team examined the interaction between cognitive and motor processes by superimposing a TMS pulse on top of a voluntary movement. The participants flexed their wrist to the rhythm of a metronome. In order to examine the effect of intention, the participants were instructed, upon a cue, to either resist the movement about to occur through TMS by thinking, or to let it go. It was found to be possible to diminish both the movement and the MEPs in the intention condition. In this experiment, it is noted that although participants were able to resist the TMS, they did not believe they would be able to do so. Also, it was taxing cognitively and they had feedback and encouragement from the researchers who were monitoring the results on-line. Considering the contribution of emotional factors to corticospinal excitability, this could be an important contributing factor to the pattern of results.
In a follow up study, Bonnard et al. (2009) used electroencephalography (EEG) to understand the processes underlying this inhibitory mechanism. Although cortical activation (alpha-oscillation power) remained constant, cortical excitability (CNV) in central nodes (FC1, C1,
Cz) decreased when participants prepared to resist the effect of TMS. After TMS occurred, inhibitory processes (N100) increased in this condition.
In conclusion, relaxation and intention tasks seem to reduce corticospinal excitability. It is not clear which inhibitory mechanism mediates this response and whether these tasks affect corticospinal excitability specifically in the muscles involved in imagery. Finally, although these experiments examined whether corticospinal excitability could be intentionally
decreased, their experiments did not examine negative motor imagery, where participants are asked to simulate the absence of movement in their mind.
Attention
Another group of researchers led by Conte et al. (2008), examined the effects of attentional processes on MEPs resulting from paired pulse TMS and rTMS, but not from single pulse TMS. They found that ICF, SICI and LICI were not affected by attentional levels, but that MEP facilitation resulting from rTMS did occur. They suggest that attention has an effect when stimulation entrains neural circuits made of large numbers of cortical cells with plastic properties.
Subjective Experience
TMS has been used in many studies of motor imagery, but the subjective experience thereof has never been examined. More specifically, the sense of agency and control is interesting to examine in this context. Agency refers to the sense that one is the initiator of an action
(Synofzik, Vosgerau, & Newen, 2007). Control, on the other hand, refers to the sense that the movement was under one’s command. Because single pulse TMS of the motor cortex
produces involuntary twitches, it is fair to expect participants to have no sense of agency for the movement. However, if participants down-modulate their corticospinal excitability
effectively and thus stop the movement from occurring through their efforts, we may expect the sense of “I did that” to increase.
The classical comparator model of agency (Frith, Blakemore, & Wolpert, 2000; Blakemore, Wolpert, & Frith, 2002) predicts that an intended movement will be compared with the feedback of the actual movement. When the intended and actual movements match, agency is felt. When the movements don’t, there is no sense of agency. Synofzik et al. (2007) have suggested that agency is twofold: there is a judgment component and a feeling component of agency. The judgment component is of a higher order (Moore, Middleton, Haggard, & Fletcher, 2012) and is the judgment of “I did that”. In contrast, the feeling component is non-conceptual (Synofzik et al., 2007), and more of an implicit sense of control over an action. Moore et al. (2012) support this model. Using a paradigm from the field of learning, they created one measure for implicit agency (using intentional binding) and another for explicit agency (using the Gambler’s fallacy). The explicit measure consisted in predicting if the next action participants did would be followed by a tone or not. The implicit measure consisted in estimating how close in time the action and the tone were. Both implicit and explicit measures changed depending on the previous trials. However, they did not change in the same way, showing that they were not the same, and indeed measuring two different constructs.
Another improvement on the model came from Chambon & Haggard (2012). They were able to show that a sense of agency does not only occur in retrospect. In fact, when the selection of an action is smoother (primed compatibly rather than incompatibly), the sense of agency increases for the result of that action, independently of the outcome.
Objectives
Previous studies have shown that intention and relaxation can have the effect of diminishing corticospinal excitability. However, each of the experimental tasks was complex and included many factors that were unessential to the research question. Studies by Bonnard et al. (2003; 2009) observed the interaction between cognitive and motor functions by asking participants to superpose an intention about a TMS-pulse applied during a self-produced movement. They also encouraged their participants. In the Sohn et al. (2002; 2003) studies, relaxation was produced on cue. The alternative was to use positive imagery, and there may have been a different type of inhibition at play. Finally, Fujisawa et al. (2010) studied the effects of three-hour relaxation periods. In the present experiments, we aimed at stripping down the
experimental design to examine the effects of simple intention and negative imagery on corticospinal excitability. We were also interested in investigating the effects of attention on MEPs when elicited by single pulse TMS. Conte et al. (2008) observed the effects of paired and repeated TMS only, reporting that paired TMS had no effect on MEPs but that rTMS did.
To investigate these questions, participants were subjected to 30 TMS pulses in three different conditions: control, attention and modulation. Twenty participants were separated into two groups. Each group used a different strategy to modulate corticospinal excitability: 1) negative visual imagery; and 2) intention. Different strategies have been shown to be effective in positive imagery (Stinear et al., 2006), but not in negative imagery. Furthermore, although intention had been shown to have an effect on corticospinal excitability (Bonnard et al. 2003; 2009), whether this effect would also occur when the intention was not superposed on a self-produced movement was not known. Negative visual imagery in the way we define it (imagining the hand not reacting to the TMS pulse) on the other hand, has to our knowledge
never been studied. Studies claiming to observe negative motor imagery were in fact studying relaxation. As positive visual imagery is an effective strategy to increase corticospinal
excitability, we hypothesized that participants would be successful in modulating MEPs with the negative motor imagery strategy and that the MEPs would be smaller in the modulation condition than in the control condition. Furthermore, we expected to replicate the Bonnard et al. (2003; 2009) results that intention decreases corticospinal excitability. Finally, considering that motor imagery seems to be an individual ability (Collet et al., 2004), we hypothesized that there would be a correlation between the ability to modulate excitability and answers on questionnaires about body awareness, mindfulness, and self-regulation. Above and beyond the ability to visualize, our objective was to identify psychological factors that correlate with the ability to regulate corticospinal excitability.
To get a fuller grasp of the subjective experience of TMS induced involuntary movements, we also studied the judgment of amplitude and specificity of the motor twitch induced by TMS, in order to determine how the subjective experience of such a movement is constructed. At each pulse, we recorded data pertaining to the subjective experience of a TMS-induced movement. We examined agency, control, specificity and amplitude (Appendix 1). These results are mostly the subject of another report (Dumont, 2013).
Methods
Ethical Considerations
Participants gave their written informed consent to the experimental procedure that was approved by the Comité d’éthique de la recherche de la Faculté des Arts et des Sciences (CÉRFAS) of Université de Montréal. Ethical Certificate (Number CÉRFAS-2011-12-232-A)
the certificate can be found in Appendix 2 and a copy of the consent form in Appendix 3. The safety protocol defined by Rossi and colleagues (2009) was respected. All participants were compensated for their time ($20).
It is important to mention that 30 subjects were tested, but 10 were excluded from the study. An incident occurred with the 11th participant on May 8, 2012. Experimentation stopped at once when the participant signaled his discomfort. Quickly after, this subject had a vasovagal syncope. First aid emergency services were contacted. The participant was accompanied home when he felt better. This incident was not attributed to TMS, for the participant had not yet eaten and was lacking sleep. The participant was contacted the next day to make sure he was well. This incident was reported to the ethics committee, and the project was cleared to continue.
After this episode, for the next ten participants, instructions were changed and the possibility of an adverse reaction to TMS was stressed more directly. In fact, this appears to have had consequences for the experiment. Because worry significantly affects corticospinal excitability (Oathes et al. 2008), instability in experimental conditions may have occured. Indeed, results from the second group of ten participants differed significantly from the first group of ten. A decision was made to exclude these participants and include another ten participants, as well as to revert to the instructions used with the first ten subjects. This is the group presented in the subsequent analyses.
Subjects
The final sample comprised 20 participants. They were recruited at Université de Montréal. The mean age of participants was 22.9 (standard deviation: 2.51) and 10 were female. They
were mostly undergraduates with an annual income between $0 and $15 000. For 17/20 participants, the mother tongue was French. The other three participants (mother tongues German, Vietnamese and Dutch) all had a CÉGEP diploma in French. The participants had no psychiatric, neurological or brain trauma antecedents. They also had no history of loss of consciousness, epilepsy, substance abuse or addiction in the last 6 months. Furthermore, they did not have a cardiac stimulator, implant or tinnitus. Participants were informed of the 10% risk of discomfort associated with TMS, a risk of headaches or nausea.
TMS stimulator
The TMS system used to deliver stimulations was the Medtronic Magpro (Magstim Co., London, UK). It was is equipped with an 80mm coil and the current was biphasic. The coil was positioned flat on the head, oriented at 45⁰ from the midline, the handle pointing backward. It was placed directly on the scalp at M1 (C3 in the 10/20 system) and delivered single-pulse stimulations at a minimum interval of 10 seconds.
Stereotactic System
In order to maintain the stimulation site constant, a BrainSight frameless stereotactic system (Rogue Research, Montreal, Canada) was used. Stereotactic markers were located on special goggles worn by the participants and on the stimulating the coil. Stereotactic marker position was recorded by a hybrid Polaris position sensor (Northern Digital Inc., Ontario, Canada). The stereotactic system allows real time position tracking of the coil in relation to the optimal stimulation point.
Data recording
EMG. Activity in two intrinsic hand muscles was recorded: FDI and ADM. FDI was the target muscle of the imagery conditions whereas ADM served as a control. EMG activity was
recorded with all-purpose electrodes (Vermed Versa-trode, London, UK). The EMG signal was amplified with a bandwidth of 20-1000 Hz using a Powerlab 4/30 system
(ADInstruments, Colorado Springs, USA). MEPs were recorded using Scope v4.0 software (ADInstruments, Colorado Springs, USA) and stored offline for analysis.
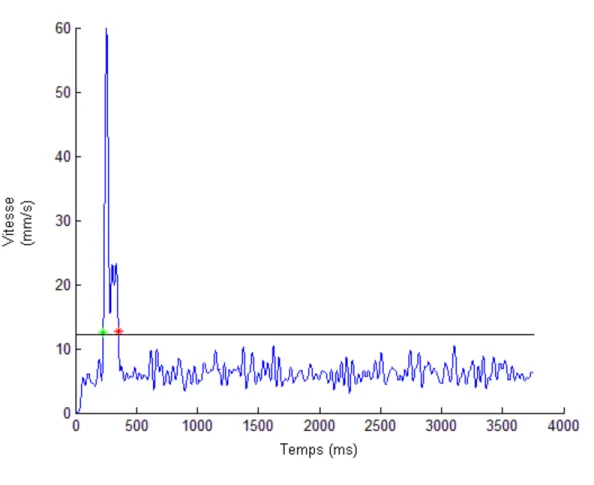
OptoTrak. In addition to muscle activity, actual movement of the index finger was measured. Two markers located at the wrist and end of the index finger were recorded with the Optotrak Certus apparatus. Data was collected at a frequency of 750Hz for 10-second periods by NDI First Principles 1.2 (Waterloo, Canada). Data was analyzed with custom software (created with Matlab (Version R2010a), MathWorks, Natick, U.S.A.). Speed of the index finger relative to the wrist was calculated as well as the trajectory length, maximal speed, duration and movement latency. Data were filtered at a 60Hz low pass filter. The movement
attributable to the index was found by subtracting the movement at the wrist from the
movement at the index. Markers of the start and the end of the movement were automatically positioned. The start of the movement was marked as soon as the speed of the movement was 10% higher than average. The end of the movement was marked by the last moment at which this speed occurred in a 750ms window after the start of the movement. A typical trial can be seen in Figure 1.
Figure 1: Typical Distance Trial.
Note: The black line shows the motion detection threshold.
Protocol
First, participants read and signed the consent form. They were given a copy for their own records. Then, an in-depth explanation of the different materials and of TMS functioning was given. As a demonstration, the experimenters gave themselves a TMS pulse on the arm and explained what was occurring. With the participants’ consent, they too received a TMS pulse in their hand so that they could get an idea of the sensations involved without it being applied to the head. This explanatory period aimed at giving the participant enough time to truly understand what was going to happen and to formulate any questions. Participants were also
reminded of the possibility of stopping the experimentation at any time, should they wish to do so.
Participants were seated comfortably with their hand on their lap, palm facing upwards. Some participants required a foam bolster on their lap for comfort. Participants were asked to keep their hand in sight at all times during the experiment. The equipment was installed and calibrated. Subjects were told that they would have four subjective questions to answer after each pulse. The nature and the differences between them were explained.
The optimal site of stimulation was then defined as the coil position from which TMS produced MEPs of maximum amplitude in the target muscle of the controlateral hand. Intensity was set as the percentage of stimulator output that consitently produced MEPs of 1mV amplitude. Twenty trial stimulations were then given at this intensity. This allows habituation of the response (Schmidt et al., 2009) and allows participants to get used to the subjective questions. Also, these twenty preparatory pulses served as a reference point for the judgments of amplitude of the movement produced by TMS.
At this point, the experiment began. There were 3 conditions of 30 pulses. The control
condition was always first to establish an uncontaminated baseline. The subjects were asked to simply respond to the questions without doing anything else. The two experimental conditions were attention and modulation, which were counterbalanced between subjects. During
attention, participants were instructed to pay particular attention to all the sensations occurring in their hand. During modulation, participants were instructed to try to stop the movement from occurring without using their muscles. Half the participants were given the extra
that no interaction between TMS pulses would occur (Rossi et al. 2009). Between each condition, participants were asked about their subjective experience (Appendix 4). At the end of the experiment, open-ended questions about the experiment were asked, including questions about the similarities between conditions and the strategies they used and felt were most effective (Appendix 5).
Four different questionnaires were administered to examine whether successful modulation is correlated with body awareness, mindfulness and self-regulation. The questionnaires took about 30 minutes to complete. All questionnaires were translated from their original English to French and validated in different samples (Appendix 6).
The Body Awareness Questionnaire (Shields, Mallory & Simon, 1989) is a self-report
questionnaire that assesses attentiveness to non-emotional body processes, specifically to body cycles and rhythms, to the ability to detect small changes in normal functioning and the ability to anticipate reactions. The translation was done by our team for another part of this project (Dumont, Chamberland, Martin, Broer, & Beauregard, 2012). This questionnaire was shown not to be correlated with the Mindful Attention Awareness Scale (Brown & Ryan, 2003) and has a good internal validity (Cronbach-α=0.82).
The Mindful Attention Awareness Scale (MAAS; Brown & Ryan, 2003) is a 15-item self-report questionnaire that measures participants’ day-to-day degree of mindful behavior. Mindfulness is operationally defined as a “kind of non-elaborative, nonjudgmental, present-centered awareness in which each thought, feeling, or sensation that arises in the attention field is acknowledged and accepted as it is” (Brown & Ryan, 2003). It was translated by
Jermann et al. (2009) and its psychometric properties were found to be similar to its English counterpart.
Self-regulation was measured by the Self-Regulation Questionnaire (SRQ; Brown, Miller & Lawendowski, 1999), and the Self-Regulation Scale (Schwarzer, Diehl, & Schmitz, 1999). The SRQ is a self-report questionnaire that examines the ability to develop, implement and
maintain planned behavior whereas the SRS is more focused on the attentional component of self-regulation. The SRQ was translated in a different part of this project (Dumont et al. 2012), and the SRS translation was done by Miquelon et al. (2012). The SRS internal validity is similar to its original english version and its unifactorial structure is preserved.
All questionnaires were administered online either before or after the experimental session, to the participant’s desire. At the end of the experimentation, participants filled out a monetary compensation form and received $20. If the subject wished, we provided an explanation of the goals of the experiment.
Subjective Questions
After each stimulation, participants were asked to rate the resulting movement of the TMS on four criteria on a scale of 1 to 100. The first pertained to agency: to what extent were you the originator of the movement? The second to specificity: to what extent was the movement specific to your index finger? The third to control: How much control do you feel you had? The last asked to rate the amplitude of the movement.
Results
Unless otherwise specified, Z-scores have been used. This allows the comparison between participants.
Missing data
64.4% of the data was missing for one of the participants’ distance measurements. These measurements are not included in the subsequent analyses.
Measure correlates
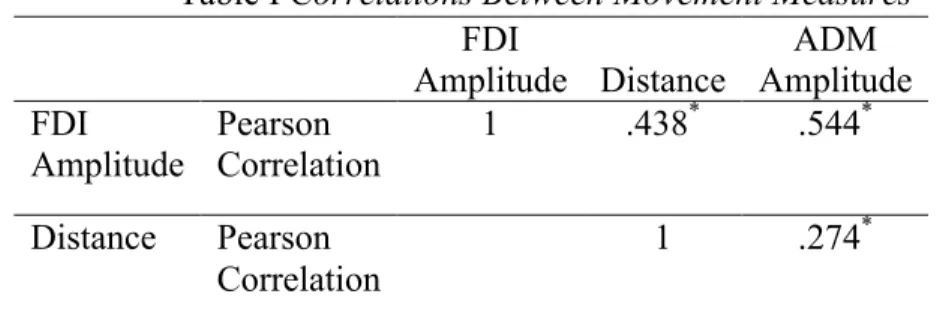
Group level. We calculated a Pearson correlation between each of the movement measures (FDI, ADM, and Distance). All the measures were significantly correlated with each other. See Table I.
Table I Correlations Between Movement Measures FDI Amplitude Distance ADM Amplitude FDI Amplitude Pearson Correlation 1 .438* .544* Distance Pearson Correlation 1 .274*
Note: *: Correlation is significant at the 0.001 level (2-tailed).
Batch effect
Because the experimental procedure was modified starting with the 11th participant, we verified that the first two groups of subjects (batches) were not different from one another. A mixed ANOVA was performed on the average FDI amplitude measures for each participant. The experimental condition was a three level within subject factor and batch participation was a two level between subject factor. There was no significant main effect of experimental
condition (F(2, 36) = .535, p = .590) and batch (F(1, 18) = .285, p = .285). There was, however, an interaction (F(2, 36) = 4.056,p= .026).
Post-hoc two-tailed t-tests revealed that attention effects were reversed between the first two batches although the control and modulation conditions remained the same, as can be observed in table II.
Table II Batch Effects per Condition
Batch 1 Batch 2 p
Control 0.017 0.0610 .969
Attention 0.2520 -0.193 .006
Modulation -0.2570 0.0610 .099
Effect of the order of conditions
To insure that the order of the conditions had no effect on the results, it was directly tested. The ANOVA on FDI where the experimental factor was the order of the condition revealed that there was no such effect (F = 0.53, p> 0.05, p= .920).
Conditions
Group level. A mixed ANOVA was conducted on the average amplitude of the MEP, where the experimental condition was a three level within subject factor and strategy group was a two level between subject factor. There was no significant main effect of experimental condition (F(2, 36) = 1.477, p=.242) or of strategy group (F(1, 18) = 0.945, p=.344). Finally, the interaction was also non-significant (F(2, 36)=1.176 , p>0.05, p=.320).
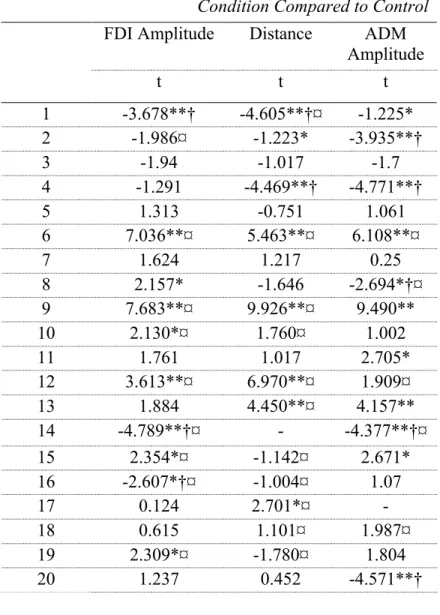
Individual level. Because individual differences in motor imagery ability exist, individual data were analyzed. T-tests comparing the modulation condition with the control condition for each participant were computed to determine if some participants were successful. When the t-test was significant (alpha < 0.05), and the average of the modulation amplitudes was lower than that of the control condition, we established that this individual modulated his/her response. This was done for the three measures estimating the movement elicited by the TMS pulse: amplitude of the MEP at the FDI muscle, at the ADM muscle and total distance as measured by motion capture. As can be seen in Table III, we found that 7 out of the 20 participants successfully modulated the amplitude of the MEP at FDI (the index finger) downwards in the modulation condition. Using distance measures of the same movement, 5/20 yielded
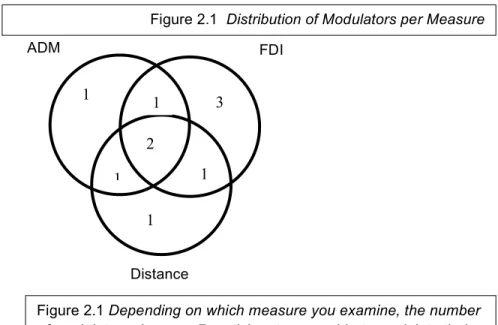
significant results for the modulation condition. Finally, the ADM muscle was also modulated downwards in 5/20 participants. Figure 2.1 shows the number of participants who were able to down-regulate one, two or three of their measures. There were also participants whose
movement measures in the control and modulation conditions were significantly different from each other, but in the opposite direction: the modulation condition was higher than their control condition.
Table III Significant Differences in the Modulation Condition Compared to Control FDI Amplitude Distance ADM
Amplitude t t t 1 -3.678**† -4.605**†¤ -1.225* 2 -1.986¤ -1.223* -3.935**† 3 -1.94 -1.017 -1.7 4 -1.291 -4.469**† -4.771**† 5 1.313 -0.751 1.061 6 7.036**¤ 5.463**¤ 6.108**¤ 7 1.624 1.217 0.25 8 2.157* -1.646 -2.694*†¤ 9 7.683**¤ 9.926**¤ 9.490** 10 2.130*¤ 1.760¤ 1.002 11 1.761 1.017 2.705* 12 3.613**¤ 6.970**¤ 1.909¤ 13 1.884 4.450**¤ 4.157** 14 -4.789**†¤ - -4.377**†¤ 15 2.354*¤ -1.142¤ 2.671* 16 -2.607*†¤ -1.004¤ 1.07 17 0.124 2.701*¤ - 18 0.615 1.101¤ 1.987¤ 19 2.309*¤ -1.780¤ 1.804 20 1.237 0.452 -4.571**† Notes: *: p<.05, **: p<0.001
†: Modulation condition was significantly bigger than the control condition. ¤ : Equal variances were not assumed (Levene’s test was significant) and
Figure 2.1 – Distribution of Modulators per Measure
Trial level. Bonnard et al. (2009) reported a variable “proportion of successful trials”. They defined a successful trial as one lying outside the range of the “normal” movement subjects were trained to do. We made a similar measure in two different ways. The first defined a successful trial as any trial in the modulation condition that was below the mean of their control condition. We found that, defined this way, 70% (standard deviation of 25%) of FDI trials were successful, 67% (standard deviation of 29%) of ADM trials were successful, and 66% (standard deviation 29%) of distance trials were successful. Figure 2.2 shows the proportion of successful trials per participant.
1 1 2 1 1 1 3 ADM FDI Distance
Figure 2.1 Depending on which measure you examine, the number
of modulators changes. 7 participants were able to modulate their FDI muscle, 7 were able to modulate their ADM muscle and 4 were able to modulate their OT activity.
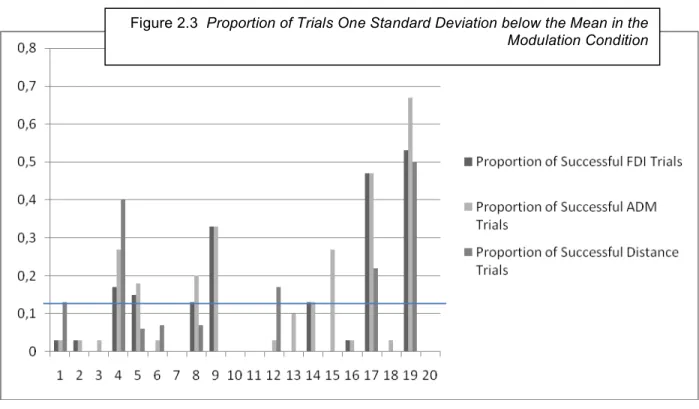
The second method defined a successful trial as any trial one standard deviation below the mean for all trials (FDI Z-score < -1). Analysis showed that 10% (SD 16%) of FDI trials, 14% (SD: 18%) of ADM trials and 8% (SD: 14%) of distance trials were successful. Although these numbers are very low, it is important to note that we expect that 15% of trials should be 1 standard deviation below the mean. Our results are all under 15% and thus corroborate the group results, showing that modulation had no effect on MEP and distances. That being said, these measures underscore the variability between participants. The results are shown in Figure 2.3.
Figure 2.2 Proportion of Trials in the Modulation Condition below the
Strategy
Individual level. A chi-square test was conducted comparing the number of FDI-modulators in the imagery group with the number of FDI-modulators in the non-imagery group. The Pearson χ2 = 5.495 was significant at p = .019. The visual imagery group was more effective than the non-imagery group. Indeed, 6 out of 7 FDI-modulators were in the imagery group.
Trial level. Independent t-tests were performed comparing the two strategies on the level of proportions of successful trials. As can be observed in Table IV, there was a significant difference between strategies for ADM and distance factors when a successful trial was defined as a trial that was below the mean of the control condition. In fact, the proportion of successful trials was higher in the imagery condition every time, but was only significant on two measures.
Figure 2.3 Proportion of Trials One Standard Deviation below the Mean in the
Table IV Differences Between Modulators and Non-modulators on Successful Trials
Method 1 Method 2
t
Sig.(2-tailed) t Sig. (2-tailed) Proportion of FDI Successful Trials -1.797 .089 -1.285 .215 Proportion of ADM Successful
Trials
-2.317 .037 -1.194 .248
Proportion of Distance Successful Trials
-2.271 .036 -1.203 .254
Questionnaires
Modulators vs non-modulators. In order to find differences between participants that were successful or not at the modulation task, a group comprising the 7 modulators who were able to modulate the target muscle (FDI) was created. The participants who presented significantly higher FDI MEPs in the modulation condition than in the control condition were included in the non-modulator group.
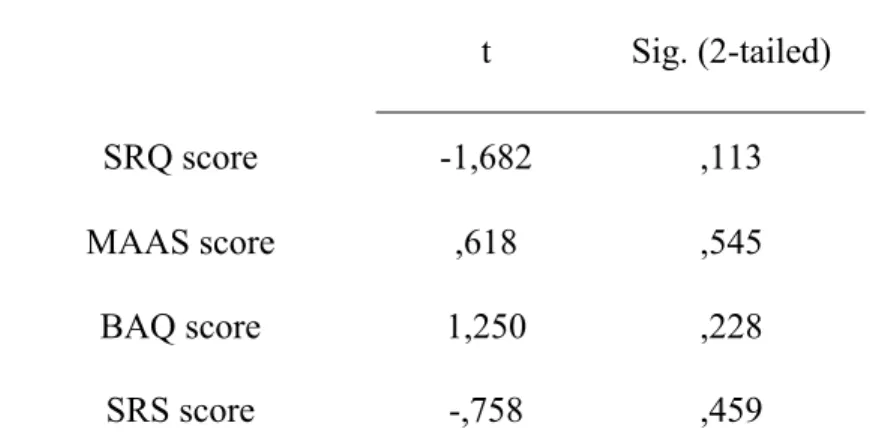
Independent samples t-tests were conducted comparing the non-modulator group to the modulator group. Table V reveals there were no significant differences between modulators and non-modulators at the level of self-regulation, body awareness or mindfulness.
Correlations
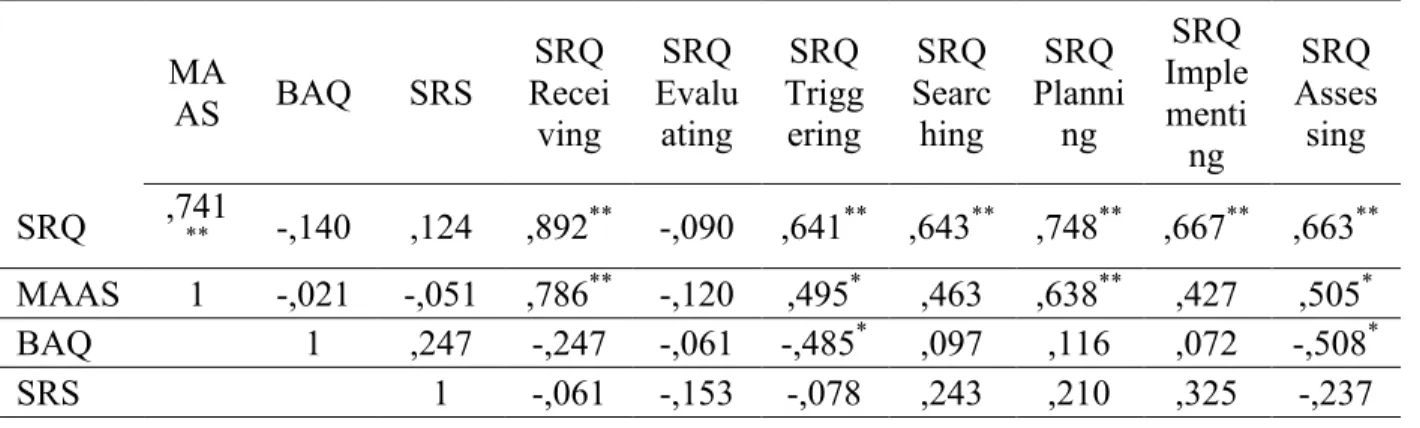
However, there were correlations between the questionnaires. All results are reported in table VI. The MAAS and SRQ were significantly correlated; the BAQ was negatively correlated with the triggering and with the assessing subscale of SRQ and the SRS was not significantly related to any of the other questionnaires.
Table V Modulators compared to Non-modulators on Questionnaires t Sig. (2-tailed) SRQ score -1,682 ,113 MAAS score ,618 ,545 BAQ score 1,250 ,228 SRS score -,758 ,459
Table VI Correlations between Questionnaires MA AS BAQ SRS SRQ Recei ving SRQ Evalu ating SRQ Trigg ering SRQ Searc hing SRQ Planni ng SRQ Imple menti ng SRQ Asses sing SRQ ,741** -,140 ,124 ,892** -,090 ,641** ,643** ,748** ,667** ,663** MAAS 1 -,021 -,051 ,786** -,120 ,495* ,463 ,638** ,427 ,505* BAQ 1 ,247 -,247 -,061 -,485* ,097 ,116 ,072 -,508* SRS 1 -,061 -,153 -,078 ,243 ,210 ,325 -,237
Notes: **. Correlation is significant at the 0.01 level (2-tailed). *. Correlation is significant at the 0.05 level (2-tailed).
Subjective Measures
Each participant gave four subjective judgments after each TMS pulse. Each judgment was transformed into a Z-score. Moreover, we also computed an accuracy score for the amplitude and specificity questions.
The amplitude accuracy score was the difference between the subjective amplitude’s Z-score and the objective measure’s Z-score (both for FDI and for distance), and this value was then transformed into an absolute value, indicating whether the participant had a tendency towards overestimating or underestimating the objective value related to their movement. Applying the absolute value transformation rendered a measure of the distance from a perfect judgment; the further the accuracy score is from 0, the worse the accuracy of that judgment was.
Objective specificity was estimated as the Z-score of the ratio of the index movement (FDI) on the total movement (FDI + ADM). Specificity accuracy was then calculated in the same way
as amplitude accuracy: by calculating the difference between the subjective Z-score of specificity and the objective Z-score of specificity.
Conditions
Analyses of covariance were conducted on the four different subjective measures (control, agency, specificity and amplitude) in order to examine the effect of experimental condition on subjective experience. The experimental condition was a three level between subject factor and FDI MEP as well as distance measures were covariates.
A first ANCOVA revealed that at equal movement, the feeling of control was different depending on the condition (F(2, 2657) = 13.125, p< .001, ηp2= .011). Pairwise comparisons with a Bonferroni correction revealed that the subjective level of control was not significantly different in the control and attention conditions (p= .822), but that it differed between the modulation and control conditions (p < .001) and between the modulation and attention conditions (p < .001).
Another ANCOVA controlling for objective movement revealed that agency, on the other hand, was not significantly different between conditions (F (2, 2658) = 2,265, p> .05). A third ANCOVA revealed that participants judged amplitude differently depending on the condition they were in (F(2, 2657) = 7.304, p=.001, ηp2 = .005). Pairwise comparisons with a Bonferroni correction showed that amplitude judgments differed in the control vs attention conditions (p= .002) and control vs. modulation conditions (p=.005), but that attention and modulation are were similar in terms of amplitude judgment (p = 1).
A final ANCOVA revealed that specificity judgments followed the same pattern as amplitude judgments. They were significantly different between conditions (F(2, 2657) = 11.614,
p<.001, ηp2 = .009). Pairwise comparisons with a Bonferroni correction reveal that control and attention differed, (p = .001), control and modulation differed, (p < .001), but attention and modulation did not differ (p = .810).
Strategy
Independent t-tests on accuracy and specificity measures comparing imagery with non-imagery groups revealed that in the modulation condition, FDI or distance scores between imagery conditions revealed that the participants using an imagery strategy had a tendency to overestimate the specificity of the movement whereas in the non-imagery group, they
underestimated it. Amplitude accuracy was not affected by strategy, no matter which objective measure (FDI or distance) was examined. These results can be seen in table VII.
Table VII Differences in Strategy on Subjective Measures of Specificity and Accuracy
Mean t p Imagery Non-imagery Specificity .438 -.214 -2.897 .01 Amplitude Accuracy (FDI) .203 -.047 -1.099 .286 Amplitude Accuracy (Distance) .220 .017 -.849 .408 Modulators vs. non-modulators
A mixed ANOVA revealed that there was no difference between those being able to modulate the FDI response and those that weren’t on subjective measures (F(3,16) = 1.723, p= .203). Conditions (without controlling for the objective movements) also had no effect on subjective response (F(6,13)=1.124, p= .401). There was also no interaction between modulators and conditions on the level of subjective experience (F(6,13) = 0.174 p= .979). Finally, there was no difference in specificity accuracy between modulators and non-modulators t(18) = -0.836, p> .05.
Discussion
The present results show that reducing TMS-induced movements through intention and negative motor imagery was not possible in the present sample. However, the data show that there is great variability between individuals in their ability to modulate corticospinal
excitability in M1 using these strategies (Figures 2.1 and 2.2). Seven out of 20 participants were able to reduce corticospinal excitability in the cortical representation of the FDI muscle. Six out of these seven were using a visual imagery strategy. Although an effort was made to elucidate what made modulators different from non-modulators, no conclusive results were found. Self-regulation, mindfulness or body awareness did not explain why some were more effective than others. Modulators were not more accurate in their judgments of the amplitudes or specificity of their movements, nor did they feel more in control or as an agent.
These results conflict with what has been reported previously. Bonnard et al. (2003; 2009) as well as Sohn et al. (2003) showed that there is a general capability to down-regulate cortico-spinal excitability in M1. However, contrasting with these studies, the current experiment attempted to examine the effect of pure negative motor imagery and intention and the
subjective experience thereof. Therefore, a review of the differences with the aforementioned experiments may be beneficial to better understand discrepancies in results.
First, a major difference lies in the fact that a previous study assessed corticospinal excitability during a voluntary movement. In their 2003 study, Bonnard et al. required participants to move their wrists to the beat of a metronome whereas in their 2009 study (Bonnard et al., 2009), target muscles were tonically contracted.
A second major difference lies in the strategies used to downregulate corticospinal
excitability. Instructions in the Bonnard et al. (2003; 2009) studies were similar to those used here for imagery: resist the TMS-induced movement using intention. Although intention was found to be effective in the Bonnard et al. (2003; 2009) studies, only 1 out of the 7 FDI modulators used the intention strategy effectively in the present study. On the other hand 6/7 FDI modulators in the present study used negative visual imagery strategy. This strategy had never been examined before in this context. In fact, although Sohn et al. (2003) referred to their strategy as “negative motor imagery”, their instruction was “to imagine only suppression of TMS-induced twitching of your left hand by trying to do more relaxation only after No-Go signals and to imagine your left hand squeezing after Go signals” (Sohn et al., 2003). This strategy is closer to relaxation, and not motor imagery, generally defined as ”the simulation of a movement in one’s mind, without sending direct motor commands to the muscles” (Hétu et al., 2013). Their results thus replicate and corroborate those of Fujisawa et al. (2011), who showed that relaxation had a depressing effect on corticospinal excitability. Moreover, although visual negative motor imagery was explicitly examined, kinesthetic motor imagery was not. Some authors have suggested that kinesthetic motor imagery is more effective in modulating corticospinal excitability (Stinear et al., 2006). It is therefore important to note that 5/10 participants in the motor imagery group reported using kinesthetic strategies as well. Indeed, they reported imagining that their hand was a statue or a block of ice as well as trying to imagine what it feels like to not move. This, however, had no effect on efficiency: 3/6 successful imagery participants used visual imagery, whereas the other 3/6 used a combination of both visual and kinesthetic imagery.
A third important difference lies in the predictability of the TMS pulse. Bonnard et al. (2003; 2009) used a paradigm where a cue would indicate the start of the trial, which was not the case in the present study. In fact, between trials, participants were asked to answer questions about their subjective experience and prepare for the next trial. The focused attention of participants and the relatively simple instructions in previous studies could have facilitated modulation effects. Indeed, because corticospinal excitability reflects a readiness to act, the object and level of one’s attention may impact corticospinal excitability. In the present paradigm, participants were asked to pay particular attention to the sensations in their hand in the attention condition. Results showed that the attention condition was not different from the control condition. Similarly to what was reported by Conte et al. (2008), attention did not modulate corticospinal excitability. However, in all conditions, participants were asked to pay attention so that they could answer 4 subjective questions after every TMS-induced
movement. This led to 9/16 participants reporting that they found the control and attention conditions to be very similar. Furthermore, in the modulation condition, this may have detracted from the attention available for intention modulation or visual imagery.
Although the specific contribution of attention to corticospinal excitability modulation could not be identified, further studies could elucidate the role of attention on corticospinal
excitability by using a paradigm whereby attention is split on different loci or focused on an area of interest. Another approach would be to study corticospinal excitability in meditators, who are attention experts, while they are either doing a focused attention task, open
monitoring (more focused on acceptance), and modulating their corticospinal excitability up or down. Comparing expert meditators to novice meditators group may help elucidate the
Finally, differences in the number of trials may also partly explain discrepancies between the present study and those of Bonnard et al. (2003; 2009). In the latter, 120 to 160 trials per condition were conducted whereas in the present study 30 trials per condition were assessed. Because the effect size is not mentioned in either article, a possible explanation of discrepant results is that there may exist an effect of intention on CSE, but its effect is very small. Factors such as relaxation or worry, on the other hand, may hold greater explanatory power. In fact, as all the studies report, participants did not think that it would be possible to reduce the effects of TMS. The idea of attempting a seemingly impossible task may in fact be somewhat
arousing or worrying, which we know increases corticospinal excitability (Oathes et al., 2008). The instruction to relax in the studies by Sohn et al. (2002; 2003) may have effectively
counteracted this effect. In addition, Bonnard et al. (2003; 2009) took specific action to reduce this effect by giving both feedback and encouragement to their participants. In fact, the
feedback would make this seemingly impossible task more controllable and the
encouragement would also generally keep participants in a positive state, reducing the effects of worry. Participants in the present study, on the other hand, were given no feedback or encouragement.
As was mentioned in the introduction, it is not clear whether positive motor imagery acts specifically on the muscle involved in the task. The present data suggest a similarly complex picture (Figure 1) for negative motor imagery. In total, 10 participants were able to modulate at least one of the measures (FDI, ADM or distance). Because subjective measures
concentrated mostly on the “finger”, not specifically referring to the index, some participants may have taken this as “in the index finger”, others may have not. However, when participants
clear what participants pictured in their head as they were performing motor imagery, which may explain some of the variability in the results. Moreover, it is possible that negative imagery is actively used in positive imagery. In fact, when one pictures his/her index moving, one also pictures the rest of the hand remaining still as a backdrop. Examining whether a control muscle diminishes in amplitude between a control condition and a modulation condition may reveal the prevalence of this mechanism. On the other hand, during negative motor imagery, the image most likely does not have a foreground and a background. The whole hand might be pictured as still. This may render the process less vivid and thus less powerful. In fact, the ability to visualize a movement has been shown to be correlated with the ability to modulate corticospinal excitability (Williams et al., 2012). To our knowledge, this relationship has not been tested in downward regulation of corticospinal excitability. Although an interesting research avenue, the visualization ability of participants was not measured.
Mental rotation abilities, motor experience, age, gender (Williams et al., 2012), practice effects and the recruitment of certain brain areas (Guillot al., 2008) have all been linked to superior motor imagery ability in paradigms studying positive motor imagery. These factors may explain some of the variance that was found between participants. On the other hand, the hypothesis that self-regulation, mindfulness and body awareness may be related to the ability to decrease the effect of a TMS-induced twitch was not confirmed. Indeed, no significant relationship between scores on the four questionnaires and a superior ability to modulate corticospinal excitability was found. This absence of significant effects may be explained by numerous factors. First, the SRQ measures the very general skill of conducting behavioral change in one’s life, which may be too general to have a significant impact on the very precise type of regulation observed therein. Second, the SRS measures the ability to regulate one’s