HAL Id: hal-01831214
https://hal.archives-ouvertes.fr/hal-01831214
Submitted on 6 Jul 2018HAL is a multi-disciplinary open access archive for the deposit and dissemination of sci-entific research documents, whether they are pub-lished or not. The documents may come from teaching and research institutions in France or abroad, or from public or private research centers.
L’archive ouverte pluridisciplinaire HAL, est destinée au dépôt et à la diffusion de documents scientifiques de niveau recherche, publiés ou non, émanant des établissements d’enseignement et de recherche français ou étrangers, des laboratoires publics ou privés.
Bacterial degradation of large particles in the southern
Indian Ocean using in vitro incubation experiments
Christos Panagiotopoulos, Richard Sempere, Ingrid Obernosterer, Laurent
Striby, Madeleine Goutx, France van Wambeke, Sophie Gautier, Raymond
Lafont
To cite this version:
Christos Panagiotopoulos, Richard Sempere, Ingrid Obernosterer, Laurent Striby, Madeleine Goutx, et al.. Bacterial degradation of large particles in the southern Indian Ocean using in vitro incu-bation experiments. Organic Geochemistry, Elsevier, 2002, 33 (8), pp.985-1000. �10.1016/S0146-6380(02)00057-8�. �hal-01831214�
Bacterial degradation of large particles in the southern Indian Ocean using
in vitro incubation experiments
Christos Panagiotopoulos 1, Richard Sempéré 1 *, Ingrid Obernosterer 2#, Laurent Striby
1
Madeleine Goutx 1, France Van Wambeke 1, Sophie Gautier 1 and Raymond Lafont 1
1
Laboratoire de Microbiologie Marine, CNRS/INSU, UMR 6117, Centre d’Océanologie de
Marseille, Université de la Méditerranée, Campus de Luminy, Case 907, F-13 288 Marseille
Cedex 9, France.
2
Dept of Biological Oceanography, Institute for Sea Research (NIOZ), P.O. BOX 59, 1790 AB
Den Burg, Texel, The Netherlands.
#
Present address. Department of Biological Sciences, University of South Carolina, Columbia,
SC 29 208, USA
*corresponding author: e-mail: sempere@com.univ-mrs.fr
2
Abstract
Large particles (> 60 µm) were collected at 30 and 200 m water depth by in situ pumps in
the southern Indian Ocean in January-February 1999. The samples were incubated under
laboratory conditions with their own bacterial assemblages for 7-17 days in batches under oxic
conditions in the dark. Particulate and dissolved fractions of organic carbon, amino acids,
sugars and lipids, as well as bacterial production were quantified over time. During the
experiments, 32-38 % and 43-50 % of total organic carbon (TOC) was mineralized and
considered as labile material in the Polar Front Zone (PFZ) and Sub-Antarctic area (SAr),
respectively. This material was utilized with a bacterial growth efficiency (BGE) of 10-21%
(PFZ) and 12-17% (SAr), with the lower values being observed for surface samples (30 m).
These results imply that most (79-90 %) of the incorporated carbon from large particles was
respired as CO2.
The study revealed that the initial relative abundance of the three main classes of organic
matter, including sugars, amino acids, and lipids, greatly varied between SAr and PFZ, with
sugars being more abundant in SAr (15-19 % of TOC) than in PFZ (8-9 % of TOC). In the
PFZ, mineralization rates of amino acids and lipids were two to ten fold higher than those of
sugars, whereas the opposite was shown in SAr biodegradation experiments. Moreover, our
results suggested that organic carbon is mineralized by bacteria more rapidly in the euphotic
zone of the SAr than the PFZ. The differences observed between the two sites may be related
to the more rapid dissolution of silica as well as the higher temperatures and bacterial
production encountered in SAr waters. The bacterial processes apparently affect the
composition of material sinking to the ocean interior.
Keywords: Marine particles; Organic carbon; Carbohydrates; Amino-acids; Lipids; Bacterial
3
1. Introduction
Large (> 60 µm) non-living sinking particles are mainly produced in the upper layers of the ocean (euphotic zone) and consist of biogenic material such as faecal pellets, marine snow,
algal and bacterial exudates or exopolymer particles that sink to the sea floor with different
rates (Fowler and Knauer, 1986; Alldredge and Silver, 1988; Turley and Lochte 1990; Asper et
al., 1992; Alldredge et al., 1993). Such material is an active component of the exchange of
particulate (Martin et al., 1987) and dissolved (Alldredge, 2000) organic material between
surface and deep waters of the ocean. During transit in the water column, hydrolytic activity on
aggregates by attached bacteria give rise to dissolved organic carbon (DOC) release, which is
mainly taken up by free-living bacteria that in turn produce CO2 through respiration (Cho and
Azam, 1988; Herndl, 1988; Karner and Herndl, 1992, Smith et al., 1992; Hoppe et al., 1993;
Sempéré et al., 2000). These processes are relevant to the global carbon cycle since they
determine how much of organic and inorganic carbon is sequestered in the ocean interior
(Siegenthaler and Sarmiento, 1993).
The organic composition of sinking particles has been described mainly for sediment trap
material, focusing on carbohydrates (Ittekkot et al., 1984; Tanoue and Handa 1987; Hernes et
al., 1996), amino acids (Lee and Cronin 1982; Wakeham et al., 1984; Lee et al., 2000) and
lipids (Wakeham et al., 1984; Wakeham et al., 1997a; Cailliau et al., 1999; Goutx et al., 2000;
Kiriakoulakis et al., 2001), or by using solid state 13C-NMR spectroscopy (Hedges et al.,
2000). Recent studies indicated that bacterial degradation of large marine particles in the water
column can be described by a multi-G model (Sempéré et al., 2000), which was initially
proposed for sedimentary organic matter (Berner, 1980; Westrich and Berner, 1984, Rabouille
et al., 1998). Related studies also demonstrated that particulate organic matter from
phytoplankton debris, zooplankton, and axenic cultures of phytoplankton (Henrich and Doyle,
4
degrade as a single pool. However, very few data are available on the turnover rates of large
particles (> 60 µm) as well as the amount of organic material released through these processes
in the form of dissolved organic matter.
Therefore, particulate organic material (POM) was collected by using in situ pumps from
two localities (Polar front zone: PFZ and Subantarctic region: SAr) in the southern Indian
Ocean. The southern Indian Ocean in particular may play a major role in global environmental
changes, since it is considered an important sink for atmospheric CO2, (Metzl et al., 1999),
however very few data are available on the degradation of large organic particles that often
dominate the recycling of organic matter. Moreover, this region is characterized as the largest
“high nutrient low chlorophyll” region, which exhibits elevated productivity only in the Polar
Front due to the entrainment of trace elements (de Baar et al., 1995). In this study the
objectives were:
(1) to measure the amount and composition of POM, namely organic carbon, sugars, amino
acids and lipids, during bacterial degradation of large (> 60 µm) sinking particles,
(2) to better understand particulate-dissolved organic matter transfer during degradation
(3) to determine bacterial growth efficiency (BGE) during organic matter degradation,
(4) to provide turnover rates for sugars, amino acids and lipids found in the particulate
organic material, and
(5) to compare data sets between PFZ and SAr for which large differences in particulate
material reaching the seafloor have already been reported (Rabouille et al., 1998).
2. Materials and methods
2.1 Study area. Seawater and particle collection was carried out from January to February
1999 in the southern Indian Ocean in the framework of the Antares-4 (ANTarctic RESearch)
5
these latitudes were sampled, the first one is located in the Polar Front Zone (PFZ: 46°01.22′S; 62°56.70′E) and the other is located in the Sub-Antarctic region (SAr : 44°10.92′S;
63°23.37′E) (Fig.1; Table 1). The PFZ is located between the Sub-Antarctic Front (SAF) in the north and the Polar Front (PF) in the south. In the upper 200 m, temperature and salinity at
PFZ varied from 5 to 10 °C and from 33.69 to 33.94, respectively (Table 1). Water masses in
SAr, which is located between the Sub-Tropical Front (STF) in the south and the Agulhas
return Front (AF) in the north (Park and Gamberoni, 1997), were much warmer with
temperature ranging from 11 to 14 °C and the corresponding salinity range was 34.35-34.82
(Table 1). Depth integrated values (0-150 m) of biogenic silica in PFZ averaged 38 mmol m-2
in the PFZ and 25 mmol m-2 in the SAr, whereas integrated primary production (PP) over
0-150 m averaged 28 mmol C m-2 d-1 in the PFZ and 47 mmol C m-2 d-1 in the SAr (Leblanc et
al., in press). Integrated total organic carbon (TOC) values (0-150 m) averaged 7474 mmol C
m-2 in PFZ and 9642 mmol C m-2 in the SAr, whereas bacterial production averaged 8 mmol C
m-2 d-1 in the PFZ and 13 mmol C m-2 d-1 in the SAr (R. Sempéré, unpublished observations).
2.2 Sampling. Large particles (> 60 µm) were collected at 30 and 200 m depth using in situ
pumps (Challenger Oceanics) equipped with 60 µm pore-size filters (Nitex, Ø: 142 mm).
Seawater (10 l) was also sampled at the same depths with Niskin bottles and filtered through
0.2 µm pore-size filters (Millipore, Ø: 143 mm; P < 50 mm Hg) in order to remove bacteria
and grazers. Prior to filtration, the 0.2 µm pore-size filters were flushed with Milli-Q water (2
l) and 0.5-1 l of seawater in order to minimize contamination (Yoro et al., 1999). This water
was used for particle extraction from filters and for batch preparation.
2.3 Incubation experiments. Within 2 hours of particle collection, swimmers were discarded
6
the filters by washing several times with filtered (0.2 µm) seawater (total volume ~ 200 ml)
with a syringe. The mixture was transferred into a 2 l polycarbonate bottle filled (previously
washed with 2 % HCl and Milli-Q water) with additional 0.2 µm-filtered seawater and
immediately transferred to incubation bottles (500 ml glass bottles; combusted 450 °C); using
a peristaltic pump (Perfifill IQ 2000, Jencons Ltd). The particulate material was incubated on
board for 7-17 days (longer incubation times would probably induce anoxic conditions) at in
situ seawater temperature (5-14 °C) in the dark and swirled following the protocol of Sempéré
et al. (2000) and Arraes-Mescoff et al. (2001). The headspace-to-sample ratio inside the
incubation bottles was about 240 : 500 ml, which ensured oxic conditions throughout the
incubation period.
Sub-sampling of incubations was performed by collecting aliquots for particulate organic
carbon (POC), dissolved organic carbon (DOC), particulate and dissolved sugars, amino acids,
and lipid analyses as well as for the determination of bacterial production. The peristaltic pump was used to transfer the aliquots (∼ 50 ml) into four glass bottles (100 ml), corresponding to POC, DOC, sugar, amino acid and lipid measurements. The particulate material was collected
on GF/F filters (nominal retention: 0.7 µm) for further determination of POC, amino acids,
sugars and lipids and these were stored in the dark (–17°C) prior to analysis on shore. The
filtrates passing through the GF/F filters were transferred into duplicate glass vials, closed with
Teflon-lined screw caps and stored in the dark (–17°C) for sugar and amino acid analyses.
Samples for DOC were preserved with HgCl2 (final concentration: 10 mg l-1) and stored in the
dark at 4 °C (Ogawa and Ogura, 1992). Dissolved lipids were immediately extracted with
chloroform from the filtrates (see below) and stored in the dark under N2 (–17°C). The
standard deviation for the particle distribution, which was determined by measuring POC in
five replicates, was 5 % at the start of the incubation. Experimental errors based on duplicate
7
and BP during incubation the experiment. Controls (1 sub-sample for each sampling depth at
30 and 200 m) were prepared by adding HgCl2 (10 mg l-1 final concentration) to batches
containing particles at the start of the experiment and were processed in the same way as
above.
2.4 POC and DOC. Filters were processed according to Tan and Strain, (1979), and assayed
on a CS analyzer (CS 125-Leco). In preparation for POC analysis, the GF/F filters were
covered with a few ml of 2 N H3PO4 and evaporated to dryness at 50 °C for 12 hours to
remove inorganic carbon. The filters were then combusted and the CO2 generated was
measured by a non-dispersive infra-red detector, with a standard deviation of 2 %. POC values
reported in this study were not corrected for bacterial biomass-C (determined from bacterial
abundance) since this represented < 5 % of POC.
DOC was measured by high temperature combustion on a Shimadzu TOC 5000 analyzer,
as described in Dafner et al. (2001) and Sempéré et al. (in press). A four point-calibration
curve was performed daily with standards prepared by diluting a stock solution of potassium
hydrogen phthalate in Milli-Q water. The procedural blank ranged from 4 to 8 µM C and was
subtracted from the values presented here. TOC concentrations were estimated by summing
POC and DOC.
2.5 Particulate sugars (PCHO) and dissolved sugars (DCHO). Filters were hydrolyzed
with 0.1 M HCl at 100 °C for 20 h (Burney and Sieburth, 1977). On cooling, the aqueous acid
was evaporated to dryness in a rotary evaporator and the residue was washed with a small
volume of water (200 µl) which was removed by evaporation. The residue was taken up in 2
ml of Milli-Q water and analyzed for PCHO in order to determine the concentrations and
8
samples were measured by high performance anion exchange chromatography with pulsed
amperometric detection (HPAEC-PAD) according to Mopper et al. (1992) and modified by
Panagiotopoulos et al. (2001). Briefly, monosaccharides were separated on an anion exchange
column (Carbopac PA-1, Dionex) by isocratic elution with 19 mM NaOH at 17 °C (column
temperature) and detected by an electrochemical detector (Decade, Antec). The detection limit
of the method was found to be 25 nM (S/N=3, loop 20 µl). Final PCHO concentrations were
expressed as C-equivalents.
Since HPAEC-PAD technique provides variable recovery of individual dissolved
monosaccharides in seawater because of the desalting steps (Mopper et al., 1992), dissolved
monosaccharides were measured by a colorimetric technique with a detection limit of ~500
nM glucose equivalents (Myklestad et al., 1997). Thus, filtrates were hydrolyzed to give an
estimate of DCHO similarly as described above (Burney and Sieburth, 1977) for PCHO and
measured on a spectrophometer (Perkin Elmer E201 Lambda). Thus, the concentration of
DCHO is equivalent to the sum of free and combined dissolved sugars. Total monosaccharide
concentrations (TCHO) were estimated by summing PCHO and DCHO. DCHO concentrations
were converted to C-equivalents by using a molar conversion factor of six. Final TCHO and
PCHO concentrations were expressed as C-equivalents.
2.6 Particulate amino acids (PAA) and dissolved amino acids (DAA). Filters were
hydrolyzed using 6 N HCl at 110 °C for 20h (Parsons et al., 1984), then the hydrolyzate was
neutralized with 6.1 N NaOH and the amino acids were measured according to Delmas et al.,
(1990) using a peristaltic pump (Gilson) and fluorescence labeling with o-phtaldialdehyde
(OPA). The filtrate was used for the analyses of DAA. The concentration of DAA was
determined after hydrolysis (6 N HCl, 110 °C, 22 h) and it corresponds to both free and
9
adding up PAA and DAA (TAA = PAA + DAA). The blanks for the PAA were 0.4-0.5 µM
(cv = 13%; n = 3 for the 0.1-1 µM level). The measured concentrations were not corrected for
blank values. The detection limit was found at 0.1 µM (0.1-1 µM level) which is consistent
with Delmas et al. (1990). Final TAA, PAA and DAA concentrations were expressed as
C-equivalents by using a molar conversion factor of four, since this value represents an average
calculated for the eight most abundant (78%) amino acids in marine particles (Lee et al., 2000).
2.7 Particulate lipids (PL) and dissolved lipids (DL). PL were extracted from filters
according to Bligh and Dyer (1959). Lipid classes, including glyceride lipids (wax esters,
triglycerids, glycolipids and phospholipids) and free lipids (fatty acids, alcohols and sterols)
were separated and quantified using a thin layer chromatography-flame ionization detection
(TLC-FID) Iatroscan apparatus following the protocol of Striby et al. (1999). Dissolved lipids
(DL) were liquid-liquid extracted from the filtrate (4 times with 10 ml of chloroform, last
extraction at pH < 2) in separatory funnels on board and analyzed on land following the same
procedure for PL. Total lipids (TL) consisted of the sum of PL and DL (TL = PL + DL) and
were estimated by adding up the individual classes. The detection limit of the method was
found to be 4-5 nmol (S/N = 3). Final TL, PL and DL concentrations were expressed as
C-equivalents by using an average lipid to carbon mass ratio of 0.7.
2.8 Bacterial production (BP). BP, the rate of increase of heterotrophic bacterial biomass per
unit time (ng C l-1 h-1) was estimated from rates of protein synthesis as measured with leucine
technique (Kirchman, 1993; Van Wambeke et al., 2001). This technique, widely used in
microbial ecology in aquatic waters, is based on the assumption that the rate of protein
synthesis is proportional to BP (Kirchman, 1993). At each time point of biodegradation
10
-[4, 5 3H]- leucine (specific activity 136 Ci mmol-1) and 200 nM of non-radioactive leucine.
Samples were incubated at in situ temperature and in the dark for 3 hours, which was in the
linear phase of leucine incorporation. Incubations were stopped with formalin (2 % final
concentration), samples were filtered through 0.2 µm cellulose ester filters (GSWP, Millipore)
and then extracted with ice-cold 5 % trichloroacetic acid. Samples were counted in a liquid
scintillation counter (Packard 1600 TR). Leucine uptake was thus converted to BP based on a
conversion factor of 1.5 kg C per mole incorporated leucine (Kirchman, 1993).
2.9 Bacterial growth efficiency (BGE). We determined BGE from TOC decrease and BP
increase as follows:
BGE = (IBP/∆TOC) x 100 % (1)
where IBP is the integrated BP over successive time intervals and determined from rates of 3 H-leucine incorporation, and ∆TOC is the amount of TOC utilized during the same time interval. The time interval corresponded to the initial phase of bacterial increase (log phase).
3. Results
Water column concentrations of POC of large particles (< 60 µm) ranged in both stations
from 4.33 to 17.6 nM (Table 1) and are roughly 3 orders of magnitude lower than that reported for suspended POC (> 0.7 µm GF/F filters) at the same stations (1.5-17.8 µM; Leblanc et al., in press). Assuming a sinking velocity of 100 m d-1 (Wakeham et al., 1984;
Alldredge and Silver, 1988), these concentrations roughly correspond to a theoretical organic
carbon sinking flux at 200 m of 0.43 (SAr) and 0.57 (PFZ) mmol C m-2 d-1 (Table 1). These
values are about two orders of magnitude lower than the POC produced from integrated (0-150
m) primary production (28 - 47 mmol C m-2 d-1, Leblanc et al., in press). These flux estimates
11
from the in situ pump filters (removal efficiency was estimated to be about 80 %). Poor
estimation of the sinking velocity is also very likely. However, they indicate rapid degradation
of organic matter in surface waters, and particularly in SAr judging from the relative ratio
POC-flux against PP (POC-flux SAr x PP-1 = 0.009; POC-flux PFZ x PP-1 = 0.02).
3.1 Organic carbon concentrations during the experiment
For all series, initial concentrations of dissolved constituents (DOC and others) in the
incubation bottles were systematically higher (228-488 µMC) than in the water column (45-75
µMC; Table 1) indicating that dissolution and/or bacterial decomposition of POC, started as
soon as the particles were washed from the filters and diluted in filtered seawater. This transfer
from the particulate to the dissolved phase occurred prior to the commencement of the
incubation experiments (t=0) and is consistent with previous studies (Sempéré et al., 2000;
Arraes-Mescoff et al., 2001). Hence, TOC concentrations in batches are likely to better
represent the decay of POM. During experiment preparation, DOC concentrations in the 0.2
µm-filtered seawater (see Materials and Methods) were initially slightly higher (+5 µM C)
than those determined in discrete samples collected by Niskin bottles (Table 1) at the same
station probably because of slight contamination during filtration. This value compared to
those released from particulate material (228-488 µM C) at t = 0 or before the beginning of the
experiments may, therefore, be considered to be negligible. This source of contamination
probably comes from the organic material that constitutes the filter and it is very difficult to
eliminate it completely (Yoro et al., 1999). This trend was not observed for amino acids,
sugars and lipids, for which we found similar concentrations as in the water column.
In the PFZ 30 m and 200 m biodegradation experiments, TOC concentrations decreased by
32 % and 38 % of their initial concentrations, respectively, whereas the corresponding
12
lability of > 60 µm particles in the SAr (Table 2; Figs. 2 and 3). In controls experiments
(HgCl2-poisoned samples), BP was not detectable; we observed slight variation of TOC (≤ 10
%) indicating that adsorption of POC and/or DOC on the bottle walls played a minor role in
the TOC variations. POC concentrations in PFZ, for both 30 and 200 m samples decreased by
45 % and 21 % of their initial concentrations, respectively. At both depths for SAr- particles,
POC concentrations decreased by only ~23 % of the initial concentration (Table 2; Figs. 2 and
3). The greatest decrease in TOC and POC concentrations were observed during the first two
days (Figs. 2 and 3). Hence there was a sharp decrease of POC concentrations, by 323 µM C
(36 % of initial POC) after 1 day at PFZ-30 m, 69 µM C (19%) after 1 day at PFZ-200 m, 46
µM C (10%) after 2 day at SAr-30 m and 54 µM C (32 %) after 1 day at SAr-200 m, thereafter
concentrations decreased more slowly until the end of the incubation.
3.2 Amino acids, sugars and lipids concentrations during the experiment
At the beginning of the incubation TAA comprised 29-40 % of TOC (200-30 m) for
PFZ-particles and ~10 % of TOC for SAr- PFZ-particles indicating significant differences in the particle
chemical composition between the two sites (Fig. 4). By the end of the time course experiment,
TAA represented 23 % and 12-14 % of TOC for the PFZ- and SAr- particles, respectively
(Fig.4). At the PFZ, TAA concentrations decreased by 61 % of their initial concentration at 30
m and by 54 % at 200 m (Table 2). At SAr- particles, TAA concentrations decreased by only
~30 % of the initial concentration at both depths. Therefore, total amino acids compounds
appeared to be largely degraded during the time course experiment.
At the beginning of the biodegradation experiments, TCHO comprised 8-9 % and 15-19%
of TOC of the particles (200-30 m) at PFZ and SAr , respectively (Fig.4). By the end of the
time course experiment, TCHO represented 9-13 % and 17-19 % of TOC of the PFZ and
13
concentrations decreased by 18 % of their initial concentration at 30 m and 15 % at 200 m. In
the SAr experiment, TCHO concentrations decreased by 37-50 % of the initial concentrations
(Table 2).
At t=0, TL comprised 7-17 % and 2-3 % of TOC of PFZ and SAr- particles, respectively
(Fig. 4) indicating that the contribution of TL to TOC also varied between the two areas
studied as did amino-acids and sugars. By the end of the experiment, TL represented 4-10 % of
TOC for PFZ and accounted 3-5 % of TOC for SAr- particles for both depths (Fig. 4), whilst
TL concentrations decreased by ~ 64 % and by 14-30 % of their initial concentrations for PFZ
and SAr, respectively (Table 2).
3.3 BP and BGE
In all samples, we observed an increase in BP during the first 2-7 days and a decrease
thereafter until the end of the experiment (Figs. 2 and 3). The increase in BP was closely
coupled with the decrease in TOC concentration. Our results showed that BP peaks observed at
PFZ for both depths were rapidly reached within the first two days, whereas at Sar, maximum
BP was reached after 4 days for both depths. BGE values were calculated for all samples at the
end of the exponential growth of BP and ranged from 10 to 21 %, with slightly lower values
for 30 m samples than 200 m samples for both stations (Table 2). The decline in BP after a few
days at both sites and depths suggests that most of labile carbon was rapidly exhausted.
Alternatively, the effect of nutrient exhaustion in the bottles or flagellate grazing on bacteria
cannot be excluded (Newell et al., 1981; Harvey et al., 1995). Unfortunately, during incubation
experiments we did not collect sample aliquots for further nutrient measurements. However,
we believe that our incubation system was not nutrient limited because ambient nutrient
concentrations area high (Leblanc et al., in press). On the other hand, as explained in materials
14
epifluorescence microscopy did not show a significant number of heterotrophic flagellates at
the beginning of the experiment, whereas only few of them were observed at the end the
experiment and were responsible for the bacterial biomass decrease (Figs. 2, 3).
3.4 Degradation and mineralization rates of organic matter
Organic matter degradation and mineralization rates (k) were calculated for both fractions
(particulate and total) for amino acids, sugars and lipids as well as for organic carbon
according to the formula (Amon and Benner, 1996):
k = (Cinit-Cfin) x (t)-1 x (Cinit)-1 (2)
where:
- Cini is the initial concentration of any constituent
- Cfin is the final concentration of any constituent
- t is the incubation time
All rates were normalized to the initial concentration at the incubation in order to provide
a better measurement of the proportion of total or particulate fraction of each biochemical class
that is readily available for bacterial consumption. Calculated values of k for both stations and
depths were: 0.022-0.072 d-1 for TOC, 0.021-0.047 d-1 for TAA, 0.003-0.053 d-1 for TCHO,
0.010-0.048 d-1 for TL (Table 3). A comparison between the different particulate pools
revealed that PAA (0.038-0.14 d-1) were the most rapidly degraded by bacteria followed by PL
(0.030-0.10 d-1) and PCHO (0.016-0.049 d-1).
It should be noted that the degradation rates of particulate material do not correlate with
those of the total fractions because decomposition of particulate material produces dissolved compounds or submicronic particles (< 0.7 µm) which are not completely consumed by bacteria during the incubation time (Sempéré et al., 2000). Thus, mineralization rates of total
15
while degradation rates of POM (such as kPOC) are rather related to bacterial degradation as
well as a transfer from particulate to dissolved state.
4. Discussion
4.1 Mechanisms of particle decomposition
Incubation of large particles showed a rapid response of bacteria to the input of labile
organic material. Rapid breakdown of organic matter occurred during the first two days, after
which rates slowed, presumably reflecting the degradation and mineralization of less labile
compounds. Throughout the experimental period the labile fraction of consumed POC (ΔPOC; Table 2) was higher at 30 m (24-45 %) than at 200 m (21-22 %) at both sites, indicating that
the organic matter of large particles at 200 m was more degraded than at 30 m at the time of
sampling. Our results showed that DOC concentrations in the biodegradation experiments were
much higher (228-488 µMC) than those found in the water column (45-75 µMC) indicating
that sinking marine aggregates are potentially a source of DOC to the water column
(Alldredge, 2000). These results are consistent with the paradigm that POC degradation is the
result of ectoenzymatic activity of attached bacteria (Karner and Herndl, 1992; Smith et al.,
1992) producing high (>1 kDa) molecular weight dissolved organic compounds (Amon and
Benner, 1996; Skoog and Benner, 1997). The latter are further enzymatically degraded to
smaller molecules (500-1000 Da) that are partly transported across the bacterial membrane
(Saier and Stiles, 1975; Hedges et al., 2000 and references therein).
A mean of 96 % (range 78-109 %; Table 4) of the degraded POC fraction, was attributed
to the degradation of characterizable compounds that constitute POC (sum of PAA, PCHO,
PL). This percentage is much higher than their initial contribution in POC (22-68 %; Fig. 5),
indicating that attached bacteria preferentially degraded particulate characterizable compounds
16
amino acids and lipids at both sites (Table 3) and the significant decreases of the % weight
contributions of these pools to POC by the end of the experiment (Fig. 5). On the other hand, a
preference for the PCC in the degraded POC fraction is not very evident when examining TOC
mineralization. Indeed, only in PFZ 30 m experiment, did bacteria preferentially mineralize the total characterizable compounds (ΔTCC/ ΔTOC = 105 %; Table 4), which is confirmed by the significant decrease of this characterized fraction (i.e. TAA + TCHO + TL) by the end of the
experiment (from 65 to 42 %; Fig. 4). In the other experiments, bacteria mineralized the TCC in more or less the same proportion as in the initial composition (SAr 30 m : ΔTCC/ ΔTOC = 30 % for a initial composition of 31 %; PFZ 200 m : ΔTCC/ ΔTOC = 50 % for a initial composition of 45 %; SAr 200 m : ΔTCC/ ΔTOC = 19 % for a initial composition of 28 % ; Table 4, Fig. 4). Our results also showed that TCC contributed ~ 38 % (mean of the four
experiments) of the TOC pool by the end of the experiments indicating that the composition of
TOC becomes more uniform (Fig. 4). This is consistent with the findings of Wakeham et al.
(1997b), who found that TCC contributed 24 % and 20 % to the organic carbon in deep-water
particles and surface sediments, respectively.
4.2 Efficiency of organic carbon utilization
In the present study bacteria apparently turned over 32-38 % and 43-50 % of TOC in the
PFZ and SAr biodegradation experiments within ca 14 days, mainly during exponential
growth, indicating that mineralization of particles is more effective in SAr than in PFZ. The
BGE values, calculated for the log growth phase, ranged from 10 to 21 %, resulting in high
CO2 production, i.e. 79-90 % of the assimilated carbon was respired by heterotrophic bacteria
(Table 2). These BGE values are consistent with those reported for sinking particles in the
17
detrital aggregates incubated with deep-sea bacterial communities (Turley and Lochte, 1990: 5
to 80 %). A comparison of the two stations revealed similar BGE values, indicating that
bacterial energy requirements may be similar despite different physical, biological and
chemical processes at both sites (See study area; Rabouille et al., 1998; Leblanc et al., in
press).
4.3 Degradation and mineralization rates of organic matter
Numerous studies of organic carbon decomposition have been undertaken for different
matrices of organic matter, yielding rates ranging from less than a day to years. The wide
range of values reported for POC degradation or TOC mineralization (Westrich and Berner,
1984; Turley and Lochte, 1990; Sun et al., 1993; Harvey et al., 1995; Harvey and Macko,
1997; Rabouille et al., 1998; Sempéré et al., 2000) might be due to the origin of particles or to
different incubation times (i.e longer incubation times yield slower rates), incubation
temperatures, oxic or anoxic conditions, static or continual flow systems, as well as different
applied models (first-order vs multi-G models or linear vs exponential models). For instance,
Sempéré et al. (2000) found that mineralization rates of > 10 µm Mediterranean particles
were well fitted by a 2G-model. By applying equation 2 (Section 3.4) to the results of
Sempéré et al., (2000) rates for the degradation of Mediterranean particles ranging from 0.021
to 0.041 d-1 are determined, which are of the same order as those in the present study (Table
3). On the other hand, Harvey et al. (1995) and Harvey and Macko (1997), using a 1G-model,
estimated degradation rates for individual chemical fractions (i.e sugars, amino acids and
lipids) during a phytoplankton decay. Their values ranged from 8.2 y-1 (klipids) to 34.2 y-1
(ksugars) and were obtained for an incubation period of 45-77 days. However, if their results
were calculated according to equation 2 (Section 3.4), they would range from 2.92 to 8.03 y-1,
18
explained by the mathematical approach used for the calculations (i.e linear - TOC decrease
this study vs exponential -TOC decrease based on the model used by Harvey et al., 1995 and
Harvey and Macko, 1997)). Differences in the incubation times (7-17 vs 45-77 days) and in
the nature of material may also explain the differences as well.
Mineralization rates of TOC in 200 m samples were higher in SAr than in PFZ waters,
although the theoretical sinking fluxes at this depth were 0.43 and 0.57 mmol C m-2 d-1,
respectively (Tables 1 and 3). We are aware a single result taken from experimental work
where they may be significant errors, both experimental and analytical cannot be used to
explain variations in the annual particle fluxes at these stations. However, these results
indicate that organic carbon of sinking particles could be more rapidly remineralized in the
SAr (depth ~ 5000 m) water column than in PFZ (depth ~ 4000 m), being consistent with the
work of Rabouille et al. (1998) who showed higher POC flux deposited at the sediment–water
interface in PFZ than in SAr.
The most striking feature of this kinetic study is that in PFZ, mineralization rates of
amino acids and lipids associated with > 60 µm particles were two to ten fold higher than
sugars (k TAA = 0.032-0.047 d-1; k TL = 0.037-0.048 d-1 versus k TCHO = 0.003-0.014 d-1
respectively ; Table 3), whereas mineralization rates of sugars were higher than those of
amino acids and lipids in > 60 µm particles in SAr (Table 3). Moreover sugars were more
efficiently consumed in SAr than in PFZ experiments (37 and 50 % of their initial amount
versus 15 and 18 %, respectively; Table 2). Figure 6 shows significant positive relationships
between TL and TCHO in PFZ as well as TAA and TCHO in the time series samples from
PFZ and SAr biodegradation experiments. Absence of correlation between TCHO and TL in
SAr could not be explained in this study. Such relationship implies that bacteria utilized
lipids, sugars and amino acids in the same proportion during the time course of the
19
confirms that in PFZ bacteria associated to > 60 µm particles preferentially consumed lipids
and amino acid rather than sugars. It is important to note that the initial composition of > 60
µm particles in SAr was particularly carbohydrate rich and lean in other components such as
lipids and amino acids (Fig. 4). Clearly these results indicate that the way that bacteria used
the different fractions of particles was influenced by their initial chemical composition. On
the other hand, our results showed that the PAA pool was more rapidly degraded (0.038-0.14
d-1) than the PL (0.030-0.10 d-1) and PCHO (0.016-0.049 d-1) pools for all biodegradation
experiments (Table 3). These results are consistent with the initial and final distribution of
PAA in POC (Fig. 5) and indicate that dissolution processes from particulate to dissolved
phase occurred more intensively with respect to amino acids rather than sugars and lipids,
suggesting higher ectoenzymatic activities of proteins compared to those of sugars and lipids
(Smith et al., 1992).
4.4 Chemical composition of > 60 µm particles
Recent studies indicated that sugars, amino acids and lipids accounted for 80 % of the
organic carbon in particles exported from the euphotic zone (Wakeham et al., 1997b), with the
highest contribution by amino acids (Lee et al., 2000, 60 %) followed by lipids (Wakeham et
al., 1997a, 15 %) and carbohydrates (Hernes et al., 1996, 5 %). In the present study, these
components accounted only 28-65 % of organic carbon (see initial composition of TOC, Fig.
4). One possible explanation is that in situ pumps collect a wide spectrum of particle sizes
including large and small (and already degraded) particles, whereas sediment traps, which
were used in previous studies collect only fast large sinking particles (that are probably less
degraded). Alternatively, these results may be due to natural variability or to the assumptions
made for the carbon conversion factors. Our results also showed that the total uncharacterized
20
69 % SAr), which is in agreement with previous investigations (Wakeham et al., 1997b;
Hedges et al., 2000).
The initial chemical composition of > 60 µm particles varied markedly between the two
sites. Our results indicated that the fraction of TOC that could be attributed to the main
characterized biochemical classes (amino acids, lipids and sugars) was higher in the
PFZ-particles (65 % at 30 m and 45 % at 200 m) than in the SAr-PFZ-particles (31 % at 30 m and 28 %
at 200 m) (Fig. 4). Amino acids were predominant (200 m) or relatively abundant (30 m) in
PFZ-particles (29-40 % of TOC), whereas carbohydrates were relatively more abundant in SAr
surface waters (15-19 % of TOC). Since amino acids are typical of fresh algal detritus and are
more rapidly degraded than other biochemical classes (Harvey et al., 1995; Harvey and
Mannino, 2001) their high relative abundance in PFZ suggests that particles were initially less
degraded in PFZ waters than in the SAr waters.
Alternatively, different planktonic populations might explain variations in the chemical
composition as indicated above. Biological observations indicated that diatoms (partly
dissolved) as well as dinoflagellates were relatively more abundant (particularly
PseudoNitszschia sp.) in SAr, which is confirmed by particulate lipid analyses (data not
shown) whereas PFZ was characterized by an important accumulation of coccoliths of
Michaelsaisia sp. (Leblanc et al., in press).
Other investigations reported higher potential dissolution rates of biogenic silica (Leblanc
et al., in press) and higher BP in surface waters (0-150 m) of the SAr compared to the cold
waters of the PFZ (unpublished observations). It is well known that organic matter
decomposition is related to silica dissolution (Lewin, 1961; Bidle and Azam, 1999), which is
controlled by temperature (Nelson et al., 1995) as well as by bacterial activity (Bidle and
Azam, 1999). Therefore, we suggest that > 60 µm particles in SAr are depleted in amino acids
21
dissolution rate of the silica frustules as well as the higher BP and temperature, encountered in
these waters (Table 1). Conversely, colder temperatures and lower bacterial activity in the PFZ
probably prevent extensive dissolution of dead diatoms and subsequent amino-acid and lipid
consumption by bacteria. This is in consistent with other investigations indicating that PFZ
waters are particularly enriched in biogenic silica compared to POC (Leblanc et al., in press).
The higher abundance of carbohydrates in > 60 µm particles in SAr waters could derive from
different macromolecular material that is resistant to bacterial degradation, but is measurable
by conventional analysis (Hedges et al., 2001). Refractory organic or inorganic matrices may
shield intrinsically labile organic substances (Knicker et al., 1996) which may then persist
much longer than other organic compounds, such as proteins and lipids.
Conclusions
The main results concerning > 60 µm particles degradation in the two sites examined
(PFZ, SAr) in the southern Indian Ocean obtained by bulk analysis of POC, DOC, amino
acids, sugars and lipids as well as bacterial production measurements are summarized below : • Bacteria preferentially degraded PCC (PCC = PAA + PCHO + PL) in a high
percentage (96 %).
• By the end of the experiment, the composition of particles became uniform and the sum of biochemicals analyzed (sugars, amino acids and lipids) contributed ~ 36 %
of the TOC pool.
• During the experiments, 32-38 % and 43-50 % of TOC were mineralized and considered as labile material in the PFZ and SAr, respectively. This material was
utilized with a bacterial growth efficiency (BGE) of 10-21 % (PFZ) and 12-17 %
(SAr), indicating that 79-90% of the incorporated carbon from large particles was
22
• This study revealed that the initial relative abundance of the three main classes of organic matter, including amino acids, lipids and sugars, greatly varied between
SAr and PFZ, with sugars being more abundant in SAr-particles (15-19 % of TOC)
than in PFZ-particles (8-9 % of TOC). Additionally, a kinetic model indicated that
in PFZ mineralization rates of amino acids and lipids were two to ten fold higher
than those of sugars, whereas the opposite was the case in the SAr biodegradation
experiments. These results strongly suggest that bacterial decomposition of organic
matter is influenced by its initial chemical composition.
• The differences observed in initial particle composition and mineralization rates between the two sites (PFZ and SAr) may be best explained by the higher
dissolution processes of silica as well as by higher temperatures and BP in SAr
waters.
These observations suggest that both processes (different origin of particles and selective
biodegradation) may act together and affect the composition of sinking material to the ocean
interior. Our study suggests that bacteria rapidly mineralized a higher proportion of sinking
particles leaving the euphotic layer in SAr rather than in PFZ waters. Therefore it is not
surprising that there is little material reaching the sea-floor in SAr compared to PFZ (Rabouille
et al., 1998). The coupling of colder temperatures, high biogenic silica and lower
mineralization rates at PFZ, probably can facilitate the > 60 µm particles to reach the sea-floor
in this region.
Acknowledgements
We are grateful to A. Bianchi, R. Fukuda, K. Leblanc, K. Mopper and D. Delmas and two
23
the captain and crew of Marion Dufresne for excellent service at sea as well as to Jacques Le
Fèvre (leader of the Antares project) and M. Denis (chief scientist of Antares-4 oceanographic
cruise). We also thank Catherine Jeandel, Claudie Bournot-Marec, and Laurent Coppola for
help with particle collection and batch preparations during the cruise. This research was
supported by France-PROOF Antares-4 project. Financial support for C.P. came from the
24
LITERATURE CITED
Arraes-Mescoff, R., Roy-Barman, M., Coppola, L., Souhaut, M., Tachikawa, K., Jeandel, C., Sempéré, R., Yoro, C., 2001. The behavior of Al, Mn, Ba, Sr, REE and Th isotopes during in vitro degradation of large marine particles. Marine Chemistry 73, 1-19.
Alldredge, A.L., Silver, M.W., 1988. Characteristics, dynamics and significance of marine snow. Progress in Oceanography 20, 41-82.
Alldredge, A.L., Passow, U., Logan, B.E., 1993. The abundance and significance of a class of large, transparent organic particles in the ocean. Deep-Sea Research I 40, 1131-1140.
Alldredge, A.L., 2000. Interstitial dissolved organic carbon (DOC) concentrations within sinking marine aggregates and their potential contribution to carbon flux. Limnology and Oceanography 45, 1245-1253.
Asper, V.L., Deuser, W.G., Knauer, G.A., Lohrenz, S.E., 1992. Rapid coupling of sinking particle fluxes between surface and deep ocean waters. Nature 357, 670-672.
Amon, R.M.W., Benner, R., 1996. Bacterial utilization of different classes of dissolved organic matter. Limnology and Oceanography 41, 41-51.
Berner, R., 1980. Early diagenesis: a Theoretical Approach. Princeton University press.
Bidle, K.D., Azam, F., 1999. Accelerated dissolution of diatom silica by marine bacterial assemblages. Nature 397, 508-512.
Bligh, E.G., Dyer, W.J., 1959. A rapid method of total lipid extraction and purification. Canadian Journal of Biochemical Physiology 37, 911-917.
Burney, C.M., Sieburth, J. McN., 1977. Dissolved carbohydrates in seawater. II, A spectrophotometric procedure for total carbohydrate analysis and polysaccharide estimation. Marine Chemistry 5, 15-28.
Cailliau, C., Belviso, S., Goutx, M., Bedo, A., Park, Y., Charriaud, E., 1999. Sedimentation pathways in the indian sector of the Southern Ocean during a
25
production regime dominated by regeneration. Marine Ecology Progress Series 190, 53-67.
Cho, B.C., Azam, F., 1988. Major role of bacteria in biogeochemical fluxes in the ocean's interior. Nature 332, 441-443.
Dafner, E.V., Sempéré, R., Bryden, H.L., 2001. Total organic carbon distribution and budget through the Strait of Gibraltar in April 1998. Marine Chemistry 73, 233-252.
de Baar, H.J.W., de Jong, J.T.M., Bakker, D.C.E., Löscher, B.M., Veth, C., Bathman, U., Smetacek, V., 1995. Importance of iron for plankton blooms and carbon dioxide drawdown in the Southern Ocean. Nature 373, 412-415.
Delmas, D., Frikha, M.G., Linley, E.A.S., 1990. Dissolved primary amine measurement by flow injection Analysis with o-pthaldialdeyde: Comparison with High-Performance Liquid Chromatography. Marine Chemistry 29, 145-154.
Fowler, S., Knauer, G., 1986. Role of large particles in the transport of elements and organic compounds through the oceanic water column. Progress in Oceanography 16, 47-194.
Goutx, M., Momzikoff, A., Striby, L., Andersen, V., Marty, J.C., Vescovali, I., 2000. High-frequency of labile compounds in the central Ligurian Sea, northwestern Mediterranean. Deep-Sea Research I 47, 533-556.
Harvey, H.R., Tuttle, J., Bell, J., 1995. Kinetics of phytoplankton decay during simulated sedimentation: changes in biochemical composition and microbial activity under oxic and anoxic conditions. Geochimica et Cosmochimica Acta 59, 3367-3377.
Harvey, H.R., Macko, S.A., 1997. Kinetics of phytoplankton decay during simulated sedimentation: changes in lipids under oxic and anoxic conditions. Organic Geochemistry 27, 129-140.
Harvey, H.R., Mannino, A., 2001. The chemical composition and cycling of particulate and macromolecular dissolved organic matter in temperate estuaries as revealed by molecular organic tracers. Organic Geochemistry 32, 527-542.
Hedges, J.I., Eglinton, G., Hatcher, P.G., Kirchman, D.L., Arnosti, C., Derenne, S., Evershed, R.P., Kögel-Knabner, I., de Leeuw, J.W., Littke, R., Michaelis, W., Rullköter, J.,
26
2000. The molecularly-uncharacterized component of nonliving organic matter in natural environments. Organic Geochemistry 31, 945-958.
Hedges, J.I., Baldock, J.A., Gélinas, Y., Lee, C., Peterson, M., Wakeham, S.G., 2001. Evidence for non-selective preservation of organic matter in sinking marine particles. Nature 409, 801-804.
Herndl, G.J., 1988. Ecology of amorphous aggregations (marine snow) in the northern Adriatic Sea: II. Microbial density and activity in marine snow and its implication to overall pelagic processes. Marine Ecology Progress Series 48, 265-275.
Hernes, P.J., Hedges, J.I., Peterson, M.L., Wakeham, S.G., Lee, C., 1996. Neutral carbohydrate geochemistry of particulate material in the central equatorial Pacific. Deep-Sea Research II 43, 1181-1204.
Henrichs, S., Doyle, A., 1986. Decomposition of 14C labeled organic substances in marine sediments. Limnology and Oceanography 31, 765-778.
Hoppe, H.G., Ducklow, H., Karrash, B., 1993. Evidence for dependency of bacterial growth on enzymatic hydrolysis of particulate organic matter in the mesopelagic ocean. Marine Ecology Progress Series 93, 277-283.
Ittekkot, V., Deuser, W.G., Degens, E.T., 1984. Seasonality in the fluxes of sugars, amino acids, and amino sugars to the deep ocean: Sargasso Sea. Deep-Sea Research 31, 1057-1069.
Karner, M., Herndl, G.J., 1992. Extracellular enzymatic activity and secondary production in free-living and marine-snow-associated bacteria. Marine Biology 113, 341-347.
Kirchman, D.L., 1993. Leucine incoporation as a measure of biomass production by heterotrophic bacteria. In: Kemp PF, Sherr BF, Sherr EB, Cole JJ (eds) Handbook of methods in aquatic microbial ecology. Lewis publishers, Ann Arbor, p 509-512.
Kiriakoulakis, K., Stutt, E., Rowland, S.J., Vangriesheim, A., Lampitt, R.S., Wolff, G.A., 2001. Controls on the organic chemical composition of settling particles in the Northeast Atlantic ocean. Progress in Oceanography 50, 65-87.
27
Knicker, H., Scaroni, A.W., Hatcher, P.G., 1996. 13C and 15N NMR spectroscopy investigation on the formation of fossil algal residues. Organic Geochemistry 24, 661-669.
Leblanc, K., Queguiner, B., Fiala, M., Blain, S., Morvan, J., Corvaisier, R.Particulate
biogenic silica and carbon production rates and particulate matter distribution in the Indian sector of the Subantarctic Ocean. Special Issue SO-JGOFS, Vol 2, Deep Sea Research II, in
press
.
Lee, C., Cronin, C., 1982. The vertical flux of particulate organic nitrogen in the sea: decomposition of amino acids in the Peru upwelling area and the equatorial Atlantic. Journal of Marine Research 40, 227-251.
Lee, C., Wakeham, S.G., Hedges, J.I., 2000. Composition and flux of particulate amino acids and chloropigments in equatorial Pacific seawater and sediments. Deep-Sea Research I 47, 1535-1568.
Lewin, J.C., 1961. The dissolution of silica from diatoms walls. Geochimica and Geophysical Acta 21, 182-198.
Martin, J.H., Knauer, D.M., Karl, D.M., Broenkow, W.W., 1987. VERTEX: Carbon cycling in the northeast Pacific. Deep-Sea Research 34, 267-285.
Metzl, N., Tilbrook, B., Poisson, A., 1999. The annual fCO2 cycle and the air-sea CO2
flux in the sub-Antarctic Ocean. Tellus 4, 177-196.
Mopper, K., Schultz, C., Chevolot, L., Germain, C., Revuelta, R., Dawson, R., 1992. Determination of sugars in unconcentrated seawater and other natural waters by liquid chromatography. Environmental Science and Technology 26, 133-137.
Myklestad, S.V., Skånøy, E., Hestmann, S., 1997. A sensitive method for analysis of dissolved mono- and polysaccharides in seawater. Marine Chemistry 56, 279-286.
Nelson, D.M., Tréguer, P., Brzezinski, M.A., Leynaert, A., Queguiner, B., 1995. Production and dissolution of biogenic silica in the ocean : revised global estimates, comparison with regional data and relationship to biogenic sedimentation. Global Biochemical Cycles 9, 359-372.
28
Newell, R., Lucas, M.I., Linley, E.A.S., 1981. Rate of degradation and efficiency of conversion of phytoplankton debris by marine micro-organisms. Marine Ecology Progress Series 6, 123-136.
Nguyen, R., Harvey, H., 1997. Protein and amino acid cycling during phytoplankton decomposition in oxic and anoxic waters. Organic Geochemistry 27, 115-128.
Ogawa, H., Ogura, N., 1992. Comparison of two methods for measuring dissolved organic carbon in seawater. Nature, 356, 696-698.
Panagiotopoulos, C., Sempéré, R., Lafont, R., Kerhervé, P., 2001. Sub-ambient
temperature effects on separation of monosaccharides by HPAEC-PAD. Application to marine chemistry. Journal of chromatography A, 920, 13-22.
Park, Y.H., Gamberoni, L., 1997. Cross-frontal exchange of Antarctic Intermediate water and antarctic bottom water in the Crozet Basin. Deep-Sea Research, 44, 963-986.
Parsons, T.R., Maita, Y., Lalli, C.M., 1984. A manual of chemical and biological methods for seawater analysis. Pergamon, Oxford, pp.44-55.
Rabouille, C., Gaillard, J.F., Relexans, J.C., Treguer, P., Vincendeau, M.A., 1998. Recycling of organic matter in Antarctic sediments: a transect through the polar front in the southern Ocean (Indian Sector). Limnology Oceanography 43, 420-432.
Saier, M., Stiles, C.D., 1975. Molecular dynamics in biological membranes. Heidelberg Science Library 22. Springer.
Sempéré, R., Yoro, S.C., Van Wambeke, F., Charrière, B., 2000. Microbial decomposition of large organic particles in the Northwestern Mediterranean Sea: an experimental approach. Marine Ecology Progress Series 198, 61-72.
Sempéré, R., Panagiotopoulos, C., Lafont, R., Marroni, B., Van Wambeke, F. Total organic carbon dynamics in the Aegean Sea. Journal of Marine Systems. In press.
Siegenthaler, U., Sarmiento, J.L., 1993. Atmospheric carbon dioxide and the ocean. Nature 365, 119-125.
29
Skoog, A., Benner, R., 1997. Aldoses in various size fractions of marine organic matter: Implications for carbon cycling. Limnology and Oceanography 42, 1803-1813.
Smith, D.C., Simon, M., Alldredge, A., Azam, F., 1992. Intense hydrolytic enzyme activity on marine aggregates and implications for rapid particles dissolution. Nature 359, 139-142.
Smith, D.C., Steward, G.F., Long, R.A., Azam, F., 1995. Bacterial mediation of carbon fluxes during a diatom bloom in a mesocosm. Deep-Sea Research II 42, 75-97.
Striby, L., Lafont, R., Goutx, M., 1999. Improvement in the Iatroscan thin-layer chromatographic-flame ionization detection analysis of marine lipids. Separation and quantitation of monoacylglycerols and diacylglycerols in standards and natural samples. Journal of Chromatography A 849, 371-380.
Sun, M.Y., Lee, C., Aller, R.C., 1993. Laboratory studies of oxic and anoxic degradation of chlorophyll-α in Long Island Sound sediments. Geochimica et Cosmochimica Acta 57, 147-157.
Tan, F.C., Strain, P.M., 1979. Carbon isotope ratios of particulate organic matter in the Gulf of St. Lawrence. Journal Fish Reseasrch Board Can 36, 678-682.
Tanoue, E., Handa, N., 1987. Monosaccharide composition of marine particles and sediments from the Bering Sea and nothern North Pacific. Oceanologica Acta 10, 91-99.
Turley, C., Lochte, K., 1990. Microbial response to the input of fresh detritus to the deep-sea bed. Palaeogeography, Palaeoclimatology, Palaeoecology (Global and Planetary Change Section) 89, 3-23.
Van Wambeke, F., Goutx, M., Striby, L., Sempéré, R., Vidussi, F., 2001. Bacterial dynamics during the transition from spring bloom to oligotrophy in the northwestern
Mediterranean Sea: relationships with particulate detritus and dissolved organic matter. Marine Ecology Progress Series 212, 89-105.
Wakeham, S.G., Lee, C., Farrington, J.W., Gagosian, R., 1984. Biogeochemistry of particulate organic matter in the ocean: results from sediment trap experiments. Deep Sea Research 31, 509-528.
30
Wakeham, S.G., Hedges, J.I., Lee, C., Peterson, M.L., Hernes, P.J., 1997a. Compositions and transport of lipid biomarkers through the water column and surficial sediments of the equatorial Pacific Ocean. Deep-Sea Research II 44, 2131-2162.
Wakeham, S.G., Lee, C., Hedges, J.I., Hernes, P.J., Peterson, M.L., 1997b. Molecular indicators of diagenetic status in marine organic matter. Geochimica et Cosmochimica Acta 61, 5363-5369.
Westrich, J., Berner, R., 1984. The role of sedimentary organic matter in bacterial sulphate reduction: the G model tested. Limnology and Oceanography 29, 236-249.
Yoro, S.C., Panagiotopoulos, C., Sempéré, R., 1999. Dissolved organic carbon contamination induced by filters and storage bottles. Water Research 33, 1956-1959.
31
Figure captions
Figure 1. Locations of stations during the cruise Antares 4 in the Southern Ocean (Jan.-Feb.
1999). Notations: Agulhas return Front (AF), Subtropical front (STF), Subantarctic Front (SAF).
Figure 2. Time course responses of particulate and total fractions of organic carbon, amino acids,
sugars and lipids in relation to bacterial production during biodegradation experiments at PFZ 30
m and 200 m depth. Dots with slash represent control experiments for POC and TOC.
Figure 3. Time course responses of particulate and total fractions of organic carbon, amino acids,
sugars and lipids in relation to bacterial production during biodegradation experiments at SAr 30
m and 200 m depth. Same abbreviations as in Figure 2.
Figure 4. Carbon contributions of characterized biochemicals to TOC at the beginning and end of
the four biodegradation experiments. The fraction that could not be attributed to the amino acids,
sugars and lipids is indicated as uncharacterized carbon (TUC). TUC was calculated as the
difference between TOC and the sum in TAA-C + TCHO-C + TL-C.
Figure 5. Carbon contributions of characterized biochemicals to POC at the beginning and end of
the four biodegradation experiments. The fraction that could not attributed to the amino acids,
sugars and lipids is indicated as uncharacterized carbon (PUC). PUC was calculated as the
difference between POC and the sum in PAA-C + PCHO-C + PL-C.
Figure 6. Concentrations (µM C) of total lipids (a) and amino acids (b) versus total sugars in the
time series samples during biodegradation experiments performed in PFZ and SAr. For each
32 Each regression line is described as follows:
PFZ : TL = 3 x TCHO – 136 ; r = 0.91; p < 0.001; n = 10
SAr : TL = 0.02 x TCHO +11 ; r = 0.43; p > 0.05; n = 11
PFZ : TAA = 5.97 x TCHO – 216 ; r = 0.89; p < 0.001; n = 10
33
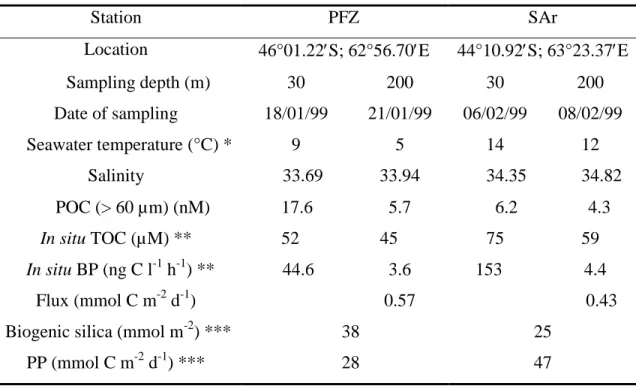
Table 1: Summary of particle sampling conditions and in situ seawater characteristics. PFZ: Polar Front Zone ; SAr : Sub-Antarctic region.
Station PFZ SAr
Location 46°01.22′S; 62°56.70′E 44°10.92′S; 63°23.37′E Sampling depth (m) 30 200 30 200 Date of sampling 18/01/99 21/01/99 06/02/99 08/02/99 Seawater temperature (°C) * 9 5 14 12 Salinity 33.69 33.94 34.35 34.82 POC (> 60 µm) (nM) 17.6 5.7 6.2 4.3 In situ TOC (µM) ** 52 45 75 59 In situ BP (ng C l-1 h-1) ** 44.6 3.6 153 4.4 Flux (mmol C m-2 d-1) 0.57 0.43 Biogenic silica (mmol m-2) *** 38 25
PP (mmol C m-2 d-1) *** 28 47 * Seawater temperature at the sampling depth.
** R. Sempéré, unpublished observations.
*** Integrated values (0-150 m) according to Leblanc et al. (in press).
Theoretical sinking fluxes at 200 m depth for > 60 µm particles were calculated according to the formula: F = v x C
where:
F: is the calculated flux
v: is the sinking velocity (m s-1) C: is the concentration (nM)
34
Table 2: Bacterial growth efficiencies (BGE%) calculated from TOC utilization and integrated
bacterial production (IBP) calculated for the log phase of the exponential growth and net variations of different pools of organic carbon (∆TOC, ∆POC, ∆TAA, ∆PAA, ∆TCHO, ∆PCHO, ∆TL, ∆PL) expressed as percentages of initial amount of organic carbon. ∆% was calculated according the formula: ∆% = (final concentration - initial concentration)/ initial concentration.
Sample Incubation period (d) BGE % Biochemical fractions
OC AA CHO
TOC POC TAA PAA TCHO PCHO
PFZ 30 m 200 m 13 17 10 21 -32 -38 -45 -21 -61 -54 -95 -65 -18 -15 -21 -30 SAR 30 m 200 m 14 7 12 17 -43 -50 -24 -22 -30 -29 -88 -95 -50 -37 -54 -34
35
Table 3: Degradation (POC, PAA, PCHO, PL) and mineralization (TOC, TAA, TCHO, TL) rates
determined in biodegradation experiments according to the equation (2). Units in µmol C l-1 d
-1 /µmol Cinit l-1 PFZ SAr Biochemical fraction 30 m 200 m 30 m 200 m k TOC k POC k TAA k PAA k TCHO k PCHO k TL k PL 0.024 0.022 0.030 0.072 0.034 0.012 0.017 0.031 0.047 0.032 0.021 0.041 0.073 0.038 0.062 0.14 0.014 0.003 0.035 0.053 0.016 0.018 0.038 0.049 0.048 0.037 0.010 0.021 0.050 0.034 0.030 0.10
36
Table 4: Net variations (in µM C) of the different pools of organic carbon (∆TOC, ∆POC, ∆TAA, ∆PAA, ∆TCHO, ∆PCHO, ∆TL, ∆PL) calculated according to the formula: ∆ = (final concentration –initial concentration). ∆POC (µM C) ∆PAA (µM C) ∆PCHO (µM C) ∆PL (µM C) ∆PCC/∆POC PFZ 30 m 437 324 9 143 109 %
PFZ 200 m 114 87 8 16 98 %
SAr 30 m 111 55 50 6 100 %
SAr 200 m 37 24 3 2 78 %
∆TOC (µM C) ∆TAA (µM C) ∆TCHO (µM C) ∆TL (µM C) ∆TCC/∆TOC PFZ 30 m 474 332 19 146 105 %
PFZ 200 m 263 97 9 25 50 %
SAr 30 m 346 24 77 2 30 %
SAr 200 m 235 13 26 5 19 %
∆PCC : is the sum of ∆PAA + ∆PCHO + ∆PL ∆TCC : is the sum of ∆TAA + ∆TCHO + ∆TL
La ti tude ( °S) 40 60 80 100 120 60 40 20 0 Indian Ocean Kerguelen Island 43 46 44 45 Longitude (°E)
STF
60 62 64 66AF
SAF
Polar Frontal Zone
Subtropical Zone
PFZ SAr
PFZ
0 400 800 1200 1600 0 5 10 15 20 0.0 0.5 1.0 1.5 2.0 2.5 30 m O rg a n ic ca rb o n ( µ M) POC TOC BP 200 m 0 400 800 1200 1600 0 5 10 15 20 B P (µ M C h -1 ) 0.0 0.5 1.0 1.5 2.0 2.5 0 100 200 300 400 500 600 0 5 10 15 20 AA ( µ M C) 0 100 200 300 400 500 600 0 5 10 15 20 PAA TAA 0 50 100 150 0 5 10 15 20 CH O ( µ M C) 0 50 100 150 0 5 10 15 20 PCHO TCHO 0 50 100 150 200 250 300 0 5 10 15 20 L ipi ds ( µM C ) 0 10 20 30 40 50 0 5 10 15 20 PL TL Time (days)Figure 2
SAr
30 m O rg a n ic ca rb o n ( µ M) 200 m B P (µ M C h -1 ) AA ( µ M C) CH O ( µ M C) L ipi ds ( µM C ) Time (days) 0 200 400 600 800 1000 1200 0 5 10 15 0.0 0.4 0.8 1.2 1.6 POC TOC BP 0 200 400 600 800 1000 1200 0 5 10 15 0.0 0.4 0.8 1.2 1.6 0 20 40 60 80 100 0 5 10 15 0 20 40 60 80 100 0 5 10 15 PAA TAA 0 50 100 150 200 0 5 10 15 0 50 100 150 200 0 5 10 15 PCHO TCHO 0 5 10 15 20 25 0 5 10 15 0 5 10 15 20 25 0 5 10 15 PL TLFigure 3
PFZ (30 m) PFZ (200 m) SAr (30 m) SAr (200 m)
START
T0 TAA 40% TCHO 8% TL 17% TUC 35% TAA 10% TCHO 19% TL 2% TUC 69% TAA 29% TCHO 9% TL 7% TUC 55% TAA 10% TCHO 15% TL 3% TUC 72%END
T 9, 13, 14, 17 TAA 23% TCHO 9% TL 10% TUC 58% TAA 12% TCHO 17% TL 3% TUC 68% TAA 23% TCHO 13% TL 4% TUC 60% TAA 14% TCHO 19% TL 5% TUC 62%Figure 4
START
END
T 9, 13, 14, 17 PAA 4% PCHO 7% PL 18% PUC 71% PAA 19% PCHO 7% PL 4% PUC 70% PAA 2% PCHO 12% PUC 84% PL 2% T0 PFZ (30 m) PAA 38% PCHO 5% PL 25% PUC 32% PFZ (200 m) PUC 48% PAA 37% PCHO 8% PL 7% SAr (30 m) PAA 14% PCHO 20% PL 3% PUC 63% SAr (200 m) PAA 15% PCHO 5% PUC 78% PL 2% PCHO 4% PUC 94% PAA 1% PL 1%Figure 5
0 50 100 150 200 250 300 0 50 100 150 200 TCHO (µM C) TL (µ M C )