HAL Id: hal-01059610
https://hal.archives-ouvertes.fr/hal-01059610
Submitted on 30 Oct 2020
HAL is a multi-disciplinary open access
archive for the deposit and dissemination of
sci-entific research documents, whether they are
pub-lished or not. The documents may come from
teaching and research institutions in France or
abroad, or from public or private research centers.
L’archive ouverte pluridisciplinaire HAL, est
destinée au dépôt et à la diffusion de documents
scientifiques de niveau recherche, publiés ou non,
émanant des établissements d’enseignement et de
recherche français ou étrangers, des laboratoires
publics ou privés.
across the Arabian Sea oxygen minimum zone
François Roullier, L. Berline, Lionel Guidi, Xavier Durrieu de Madron, M.
Picheral, Antoine Sciandra, Stephane Pesant, Lars Stemman
To cite this version:
François Roullier, L. Berline, Lionel Guidi, Xavier Durrieu de Madron, M. Picheral, et al.. Particle size
distribution and estimated carbon flux across the Arabian Sea oxygen minimum zone. Biogeosciences,
European Geosciences Union, 2014, 11, pp.4541-4557. �10.5194/bg-11-4541-2014�. �hal-01059610�
www.biogeosciences.net/11/4541/2014/ doi:10.5194/bg-11-4541-2014
© Author(s) 2014. CC Attribution 3.0 License.
Particle size distribution and estimated carbon flux across the
Arabian Sea oxygen minimum zone
F. Roullier1,2, L. Berline1,2, L. Guidi1,2, X. Durrieu De Madron3, M. Picheral1,2, A. Sciandra1,2, S. Pesant4, and L. Stemmann1,2
1CNRS-INSU, Laboratoire d’Océanographie de Villefranche-sur-Mer, BP 28, 06234 Villefranche-sur-Mer CEDEX, France 2Université Pierre et Marie Curie-Paris 6, Observatoire Océanologique de Villefranche-sur-Mer, 06230 Villefranche-sur-Mer, France
3CEFREM, CNRS-Université de Perpignan, Via Domitia, 52 avenue Paul Alduy, 66860 Perpignan, France
4PANGAEA, Data Publisher for Earth and Environmental Science, University of Bremen, 28359 Bremen, Germany Correspondence to: F. Roullier (roullier@obs-vlfr.fr)
Received: 7 November 2013 – Published in Biogeosciences Discuss.: 9 December 2013 Revised: 16 June 2014 – Accepted: 26 June 2014 – Published: 28 August 2014
Abstract. The goal of the Arabian Sea section of the TARA oceans expedition was to study large particulate matter (LPM > 100 µm) distributions and possible impact of associ-ated midwater biological processes on vertical carbon export through the oxygen minimum zone (OMZ) of this region. We propose that observed spatial patterns in LPM distribution resulted from the timing and location of surface phytoplank-ton bloom, lateral transport, microbial processes in the core of the OMZ, and enhanced biological processes mediated by bacteria and zooplankton at the lower oxycline. Indeed, satellite-derived net primary production maps showed that the northern stations of the transect were under the influence of a previous major bloom event while the most southern sta-tions were in a more oligotrophic situation. Lagrangian sim-ulations of particle transport showed that deep particles of the northern stations could originate from the surface bloom while the southern stations could be considered as driven by 1-D vertical processes. In the first 200 m of the OMZ core, minima in nitrate concentrations and the intermediate nepheloid layer (INL) coincided with high concentrations of 100 µm < LPM < 200 µm. These particles could correspond to colonies of bacteria or detritus produced by anaerobic mi-crobial activity. However, the calculated carbon flux through this layer was not affected. Vertical profiles of carbon flux in-dicate low flux attenuation in the OMZ, with a Martin model b exponent value of 0.22. At three stations, the lower oxy-cline was associated to a deep nepheloid layer, an increase of calculated carbon flux and an increase in
mesozooplank-ton abundance. Enhanced bacterial activity and zooplankmesozooplank-ton feeding in the deep OMZ is proposed as a mechanism for the observed deep particle aggregation. Estimated lower flux at-tenuation in the upper OMZ and re-aggregation at the lower oxycline suggest that OMZ may be regions of enhanced car-bon flux to the deep sea relative to non OMZ regions.
1 Introduction
In the coming decades, the ocean’s biogeochemical cycles and ecosystems will become increasingly stressed by the extending spatial distribution of oxygen minimum zones (OMZ; Stramma et al., 2010). One particular concern is the impact of low oxygen on the biological pump by affecting plankton communities and their ability to produce and trans-form the vertical flux of organic matter to the ocean’s interior. OMZs are mainly localized in the eastern boundary up-welling systems. The most intense and the largest are in sub-surface of the upwelling regions in the eastern Pacific and the Arabian Sea of the northern Indian oceans (Paulmier and Ruiz-Pino, 2008). In particular, in the semi-enclosed Ara-bian Sea, the development of oxygen-deficient conditions is attributed to excessive oxygen consumption triggered by the supply of organic matter from high surface productivity, combined with weak renewal of mesopelagic waters (Naqvi, 1987; Jayakumar et al., 2004; Anderson et al., 2007). In that ecosystem, surface produced particles are crossing different
layers of bacteria and zooplankton (Wishner et al., 2008) on their way to the bottom, possibly altering their physical prop-erties (geometry, size, composition) and therefore impact-ing the efficiency of the biological pump. However, vertical changes in particle size distribution (PSD) and carbon flux across hypoxic and anoxic layers are poorly known.
The few sediment trap studies focusing on vertical flux dis-tribution through OMZs revealed a much lower attenuation coefficient (Haake et al., 1992; Van Mooy et al., 2002) and even in some cases a significant midwater source of carbon production with depth (Lee et al., 1998; Taylor et al., 2001), compared to well oxygenated waters. Recently it has been suggested that organic matter sinking through an oxygen-deficient zone is metabolized differently than similar mate-rial sedimenting through oxygenated water columns (Kris-tensen et al., 1999; Devol and Hartnett, 2001; Van Mooy et al., 2002). However, other studies in the Arabian Sea revealed no clear patterns in the flux attenuation with the OMZ (Lee et al., 1998). Therefore, the impact of low oxygen layers on particle stocks and vertical flux must still be understood be-fore being integrated in global biogeochemical models.
In order to understand the fate of particles through the OMZ, backscattering sensors have been extensively used to study microscopic particle spatial patterns, revealing large and permanent intermediate nepheloid layers (INL; Whit-mire et al., 2009). However, to our knowledge, no informa-tion exists on the vertical distribuinforma-tion of large (> 100 µm to a few mm) particles that are the main vector of carbon flux to depth (Alldredge and Silver, 1988; Stemmann et al., 2002; Guidi et al., 2008). The goal of this study is to refine our knowledge on particle origin and fate in low oxygen zones using a comprehensive set of PSD measurements and bio-geochemical characterization of the environment across the OMZ of the Arabian Sea. We propose new hypotheses on the impact of bacterial and zooplankton activities on the produc-tion and transformaproduc-tion of PSD and subsequent carbon flux through the OMZ of the Arabian Sea.
2 Material and methods 2.1 Studied area
The first stations of the transect were done in the north of the basin, south of the Persian Gulf, a shallow semi-enclosed basin connected to the Arabian Sea through the Strait of Hormuz. The circulation in the Arabian Sea and in the Per-sian Gulf is primarily driven by the Indian monsoon regime, which is characterized by a complete reversal of the sub-surface coastal circulation along the year. The transect took place from 12 March to 4 April (Table 1), at the end of the northeast monsoon when cool and dry northeast winds blow across the Arabian Sea (Schott and McCreary, 2001) result-ing in an anticlockwise surface circulation in the basin. The transect included seven stations of which six were directly
in-side the strong oxygen depletion zone (between 200–800 m) and the last one (station 42) was located at the eastern bound-ary near the Maldives (Fig. 1 and Table 1). A total of 45 conductivity temperature depth (CTD) rosette casts were per-formed (from 3 to 12 profiles at each station) and approxi-mately 20 % of the casts were done at night.
2.2 Primary production estimates from satellite Estimations of primary production were extracted from the 8-day averages of surface net primary production downloaded from the Ocean Productivity website (http://www.science. oregonstate.edu/ocean.productivity/index.php). These prod-ucts are based on MODIS chlorophyll and temperature data, SeaWiFS PAR, and estimates of the depth of the euphotic zone from a model developed by Morel and Berthon (1989) and Behrenfeld and Falkowski (1997). Mean net primary production values were calculated by defining a squared area of 1◦centered on each station.
2.3 Hydrological, biogeochemical and particle data Temperature and conductivity were measured from surface to a maximum of 1500 m depth using a Seabird 911 CTD mounted on a Sea-Bird Carousel sampler with 10 Niskin bottles. The following additional sensors were mounted for the measure of water optical properties used as biogeochem-ical proxies: fluorometer (Wetlab ECO-AFL/FL model), dis-solved oxygen sensor (model SBE 43), nitrate sensor (ISUS with a maximum rating depth of 1000 m Satlantic SA) and a Wetlabs C-star transmissometer (660 nm with a 25 cm path-length). The beam attenuation signal was converted to par-ticulate attenuation coefficient cpby removing influence of deep (< 700 m) signal considered as the instrumental offset.
The ISUS sensor was calibrated using nitrate measuments at 10 depths at each station by computing linear re-gressions between sensor and water measurements. Because no water samples were available for station 37 and 40 at the same depth as the ISUS sensor, median of slopes and inter-cept coefficients of the other stations were used to adjust ni-trate values at these two stations.
Oxygen sensor calibration was done prior departure in Nice, France in July 2009 and in Cape Town, South Africa in July 2010 (5 months after the Arabian Sea transect). Unfortunately, water could not be sampled and stored on the ship to correct dissolved oxygen concentration estima-tions. Post-cruise calibrations performed by SEABIRD in July 2010 indicate that the oxygen sensor did not drift sig-nificantly over the whole period. After checking for and re-moving outliers in the oxygen profiles, we compared raw oxygen measurements with WOA09 climatology (Garcia et al., 2010) and, for the Arabian Sea transect, the mean differ-ence measured was about 6 µmol kg−1and 90 % of all values showed a maximum difference of 33 µmol kg−1. Moreover, we also analysed oxygen values at 500 m depth i.e. inside
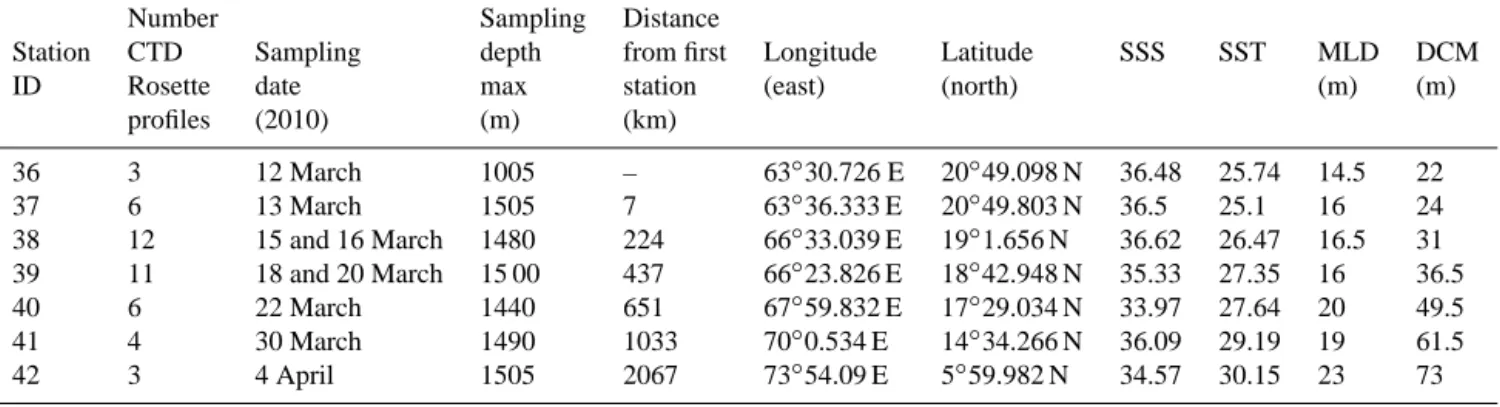
Table 1. Summary of the main information about the sampling in the Arabian Sea during the TARA oceans expedition in March 2010
(SSS = sea surface salinity, SST = sea surface temperature, MLD = mixed layer depth, DCM = depth of the deep chlorophyll maximum). Number Sampling Distance
Station CTD Sampling depth from first Longitude Latitude SSS SST MLD DCM ID Rosette date max station (east) (north) (m) (m)
profiles (2010) (m) (km) 36 3 12 March 1005 – 63◦30.726 E 20◦49.098 N 36.48 25.74 14.5 22 37 6 13 March 1505 7 63◦36.333 E 20◦49.803 N 36.5 25.1 16 24 38 12 15 and 16 March 1480 224 66◦33.039 E 19◦1.656 N 36.62 26.47 16.5 31 39 11 18 and 20 March 15 00 437 66◦23.826 E 18◦42.948 N 35.33 27.35 16 36.5 40 6 22 March 1440 651 67◦59.832 E 17◦29.034 N 33.97 27.64 20 49.5 41 4 30 March 1490 1033 70◦0.534 E 14◦34.266 N 36.09 29.19 19 61.5 42 3 4 April 1505 2067 73◦54.09 E 5◦59.982 N 34.57 30.15 23 73 0 −1000 −1000 −1000 −1000 −2000 −2000 −2000 −2000 −2000 −3000 −3000 −4000 −4000 −4000 −4000 −5000 −5000
50°E 55°E 60°E 65°E 70°E 75°E
5°N
10°N
15°N
20°N
25°N
50°E 55°E 60°E 65°E 70°E 75°E
5°N 10°N 15°N 20°N 25°N longitude latitude 36 37 38 39 40 41 42 ●● ● ● ● ● ● ● ●●●● ● ●
Figure 1. Map of the Arabian Sea (northwestern Indian Ocean)
showing the TARA transect and the seven sampled stations (sta-tions 36 to 42). Station 42 is out of the Arabian basin, located near Maldives Island, and is used as a reference point without OMZ.
the OMZ core, where oxygen concentration remained stable. Drift evidence along the transect was not observed (mean value of 2.88 µmol kg−1±0.15). Even if our oxygen mea-surements remain raw estimates, we decided to use a thresh-old of 5 µ mol kg−1in order to determine the vertical extent of the suboxic core (the upper/lower oxycline depths and the thickness of the OMZ layer). This value was chosen accord-ing to previous studies of Codispoti et al. (1991, 2005) and corresponds to a working definition of suboxic conditions.
The vertical distribution of large marine particles was investigated with the Underwater Vision Profiler (UVP, Picheral et al., 2010) mounted on the CTD-Rosette. The UVP
acquires images in a coherent volume of water (1 L) delim-ited by a light sheet issued from red light-emitting diodes. The analysis of images provides quantitative information on the sizes and shapes of particles (> 100 µm) and zooplank-ton organisms (> 500 µm). Only images from recognizable objects larger than 500 µm were sorted using an automatic classification followed by manual validation (Picheral et al., 2010).
Hereafter, particles detected by the transmissometer will be referred as suspended particulate matter (SPM) while those detected by the UVP will be referred as large partic-ulate matter (LPM).
2.4 Phytoplankton size fractions
Based on High Pressure Liquid Chromatography (HPLC) analysis, we used the method proposed by Claustre (1994) and further improved by Uitz et al. (2006) to esti-mate the contribution of three pigment size classes (mi-croplankton, nanoplankton, and picophytoplankton; fmicro,
fnano, and fpico, respectively) to the total phytoplankton
biomass. Briefly, this method (detailed in Uitz et al., 2006) takes into consideration seven diagnostic pigments repre-sentative of the major phytoplankton taxa (i.e., fucoxan-thin (Fuco), peridinin (Peri), 19’hexanoyloxyfucoxanfucoxan-thin (190HF), 190butanoyloxyfucoxanthin (190BF), alloxanthin (Allo), zeaxanthin (Zea), and total chlorophyll b (TChl b), here defined as the sum of chlorophyll b and divinyl-chlorophyll b) to compute the fractions of three pigment-based size classes with the following empirical equations:
fmicro=(1.41Fuco + 1.41Peri)/wDP (1)
fnano=(0.60Allo + 0.35190BF + 1.27190HF)/wDP (2) fpico=(0.86Zea + 1.01TChl b)/wDP, (3) where wDP is the weighted sum of these concentrations: wDP = 1.41Fuco + 1.41Peri + 0.60Allo + 0.35190BF (4)
2.5 Zooplankton vertical distribution
Zooplankton counts from the UVP were not used because of their low abundance (< 0.005 ind. m−3, Fig. 10) in the observed volume. Instead, net collection obtained with a Hydrobios multinet (5 nets, mesh size 330 µm; aperture 0.25 m2)were used to estimate vertical distribution of zoo-plankton. Samples were preserved in buffered formalde-hyde (4 %) and further analysed in the laboratory using the ZOOSCAN imaging system (Gorsky et al., 2010). Zooplank-ton sorting was performed using an automatic recognition algorithm and validated by a specialist into 20 taxonomic groups.
2.6 Data analysis
All CTD data were smoothed and interpolated to the near-est 5 m intervals to be used for statistical data processing. After ensuring the homogeneity between profiles inside a station, they were pooled together by calculating the mean profiles for each parameter. The mixed layer depth was es-timated as the depth at which there was a density difference of 0.03 kg m−3relative to near-surface value at 10 m depth (de Boyer Montegut et al., 2004). Particle size distribution (PSD) computation is based on 27 size classes of equivalent spherical diameter sorted in a logarithmic scale from 60 µm to 26.79 mm (Guidi et al., 2009). Particle concentrations are converted to biovolume assuming spherical particles. Each 5 m binned particle concentrations were assessed in a volume of water of 50 L. Pooling particles profiles per stations yield an observed volume ranging from 150 to 600 L per depth bin (n = 3 to 12, 6 on average, Table 1). Vertical profiles of parti-cles abundance were smoothed using a 45 m window moving average filtering.
To calculate particle size distribution (PSD), abundances per size class and per volume are normalized by dividing them by the range of their size-class to obtain the number spectra (# L−1mm−1) (Stemmann et al., 2004). The slopes of the size spectra on a log-log scale were calculated with values at either end of their size ranges excluded to avoid bias due to low efficiency of particle detection at each end of the size spectrum. The slope of the PSD has been calculated over the size range 100 µm to 2 mm.
Empiric relationships between particle size and flux were used in order to calculate vertical profiles of flux through the water column (Guidi et al., 2008). The vertical profiles of flux were adjusted by the Martin Model (Martin et al., 1987): Fz=Fzref(z/zref)−b, (5) where z is the depth and b is the proxy for the flux attenua-tion. In our case Fzrefwas the flux at zref = 50 m. The choice of the reference depth zref is not critical here as the fit of the Martin Model is done on high vertical resolution parti-cle data. Thus 50 m was selected as the depth representing an intermediate between the depth of the subsurface flux
maxi-mum (close to the deep chlorophyll maximaxi-mum) and the depth of the top of the OMZ (between 100 and 150 m). Because of flux increase with depth at the lower oxycline, the Martin Model was only fitted using the portion of the water col-umn with a decreasing or constant flux (not shallower than 1000 m). Even if the Martin Model remains debated, the b coefficient still represents a standard value that allows com-parison with other oceanic regions.
2.7 Circulation model and lagrangian experiments set up
We assessed the statistical funnel of possible particle source (Siegel et al., 2008) in order to evaluate the role of particle lateral transport by water masses in the studied area. Veloc-ity, temperature and salinity fields were given by the MER-CATOR Oceans forecast system. Outputs are extracted from the PSY3V3R1 version, a global high-resolution circulation model configuration forced by realistic daily surface inputs (Bahurel, 2006). The domain covers the northwestern Indian Ocean (north of 5◦N) with a horizontal resolution of 1/4◦ (∼ 30 km) and 40 vertical levels with higher resolution in the first 100 m to better represent the upper boundary layer. On the longitudinal axis, the domain extends from 49.75 to 75.25◦E. We checked for the validity of these model outputs by comparing salinity and temperature with climatology and our observations to ensure that water masses (such as the Per-sian Gulf Water, hereafter PGW) were correctly represented. Velocity outputs of PSY3V3R1 were quality-controlled by MERCATOR Oceans by comparison with surface drifters (Lellouche et al., 2013) and revealed a tendency to under-estimate the magnitude of currents (∼ 20 %) while reproduc-ing directions accurately. We thus quantified the sensitivity of results to the velocity underestimation by running additional simulation with velocity increased by 20 %. Daily averages of the velocity fields were linearly interpolated in time and space during particle tracking.
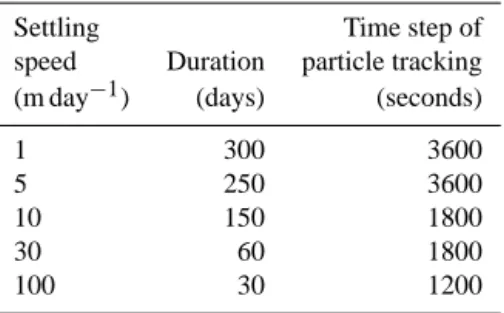
The advection of particles was computed using a 4th or-der Runge–Kutta numerical scheme as implemented in the ICHTHYOP software (Lett et al., 2008). ICHTHYOP is a free java lagrangian tool designed at first to study the ef-fects of physical and biological factors on ichthyoplankton dynamics. In addition to the multidimensional model veloc-ity, particles are assumed to have a vertical settling velocity. We explored a range of settling velocities from 1 m d−1to 100 m d−1(see Table 2) to represent settling velocity for par-ticle size from 0.1 mm to 2.5 mm (using size–velocity rela-tionship from Guidi et al., 2008). These estimates are in the range of reported settling rates (Syvitski et al., 1995; Stem-mann et al., 2004; Peterson et al., 2005). At the lateral bound-aries (coasts and domain boundary) particles were stopped. The position of each particle along the trajectory is saved on file every hour. We did not account for subgrid scale disper-sion.
Table 2. Inputs of the ICHTHYOP model parameters used to
pro-cess the Lagrangian simulation of particles advection. Settling Time step of speed Duration particle tracking (m day−1) (days) (seconds)
1 300 3600
5 250 3600
10 150 1800
30 60 1800
100 30 1200
At the beginning of the simulation process, for each sta-tion, particles are randomly positioned in a 50 km radius cir-cle centered on the mean longitude/latitude of all CTD casts of the corresponding station. The horizontal dispersion of these initial positions was chosen to encompass all mesoscale structures < 100 km. A total of 500 particles were used for each simulation process, considered as enough to compute statistics.
Initial vertical positions for the backward calculation were chosen as a 10 m layer centered at the depth of the deep max-imum particles abundance given by the UVP. The depth of the maximum was shallower at the beginning of the tran-sect, thus the initial position ranged from 200 m to 1000 m between first and last stations. The time step (Table 2) of par-ticle tracking was chosen to satisfy the Courant–Friedrichs– Levy criteria (Courant et al., 1967).
From the trajectories we quantified the statistical funnel, i.e. the backward in time trajectories from their initial depth to the surface. The statistical funnels were computed with the trajectories seeded at the time of the cruise in the Ara-bian Sea, i.e. between March and April 2010. In order to quantify the possible source of particles at the surface, we computed the envelope containing 75 % of the particles, and only if more than 100 particles have reached the surface.
3 Results 3.1 Hydrology
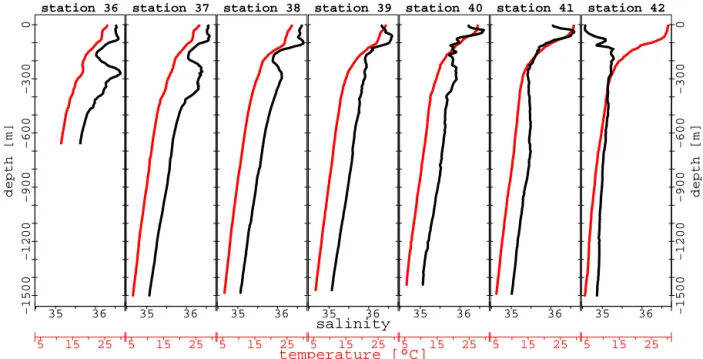
Temperature and salinity transects (Table 1 and Fig. 2) re-veal a strong zonation from north to south. Sea surface salin-ity (SSS) decreases between the first and the last station from 36.5 to 34.6 (Table 1), whereas sea surface tempera-ture (SST) increases from 25.7 to 30◦C (Table 1). The mixed
layer depth deepens slightly from coastal area towards the open ocean (Table 1) and reaches 20 m at station 42. In the water column, outflow of the Persian Gulf Water (PGW) is visible along the first three stations (stations 36, 37 and 38) between 200 and 400 m and is associated with salinity greater than 36 and temperature between 16 and 17◦C. Signature of the PGW is more evident near the coastal area (station 36
and 37) and is also characterized by an increase of oxygen concentration at same depth (200–400 m).
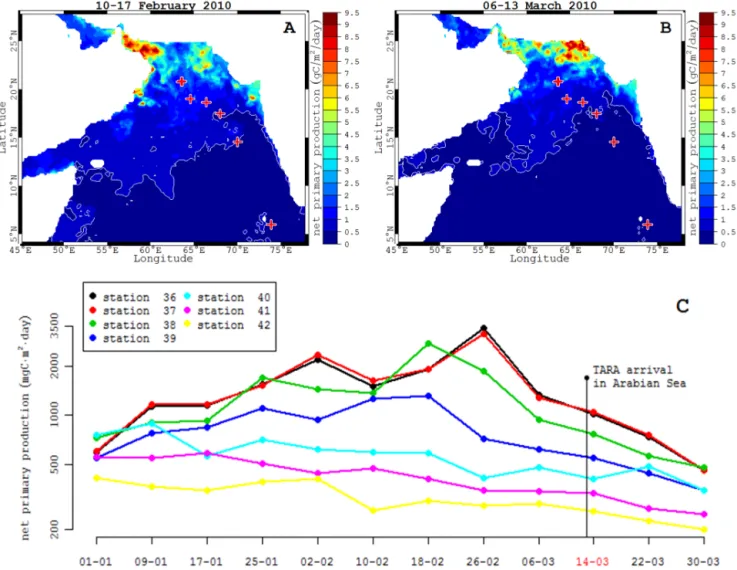
3.2 Time course of average net primary production The analysis of net primary production time-series of the re-gion reveals that a bloom started in the Persian Gulf around the beginning of February (Fig. 3a), and persisted 6 weeks. At the time of sampling, the bloom was declining (Fig. 3b) and at the end of the cruise, surface production was low (Fig. 3c). A southward decline of surface production was visible from coastal areas (Oman Strait and Persian Gulf) toward the open ocean (Fig. 3a and b). The depth of deep chlorophyll maximum also decreased with time and distance from the depth of 20 m to 70 m (Table 1).
3.3 Vertical distribution of oxygen and nitrate
The OMZ was detected at all stations but vertical distribution of oxygen changed among stations (Fig. 4). Stations 36 and 37 revealed the presence of two sub-layers between 200 and 400 m and 600 and 850 m associated with a slight increase of oxygen concentration with respect to the OMZ core. The signature of the deeper oxygenated sub-layer is also weakly detected at stations 38 and 39 and could be attributed to the Red Sea Water (Schott and McCreary, 2001). Using the 5 µmol kg−1criterion, the OMZ layer extents from approxi-mately 110–160 m to more than 1000 m depth for the central stations (stations 38, 39 & 40). At stations 36 and 37, the upper oxycline was detected between 400 and 600 m, and at the southern station 42, OMZ layer is about 140 m thick with oxygen concentration slightly higher than other stations of the transect.
Vertical profiles of nitrate concentrations showed maxi-mum values close to the upper oxycline (150–200 m depth, Fig. 4). Inside the OMZ layer, all profiles showed a system-atic minimum of nitrate concentration just below the oxy-cline, except station 42. Nitrate concentrations were consis-tent with reported values (Anderson et al., 2007; Ward et al., 2009). At the upper oxycline, nitrate concentration was about 30 µmol kg−1and less than 20 µmol kg−1in the core of the OMZ (station 38–39–40). The nitrate minimum was less pro-nounced and deeper at the beginning of the transect (around 300 m depth) but towards the central Arabian Sea, the mini-mum was closer to the surface (200 m depth) and more pro-nounced. Following this minimum, nitrate concentrations in-crease again towards greater depth.
3.4 Vertical distribution of phytoplankton
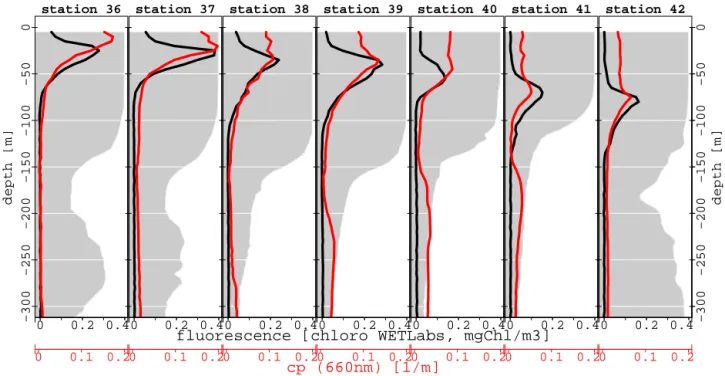
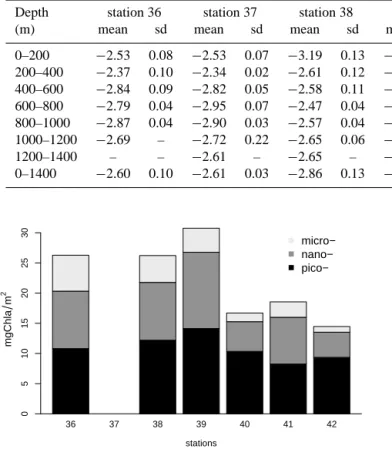
Fluorescence peaks deepen and integrated chlorophyll a de-creased towards the open Arabian Sea (Figs. 5 and 6). These observations were completed by HPLC analysis, which showed a change of the size class composition between the first and last station (Fig. 6). Proportion of microphytoplank-ton decreased twofold from 22.7 % (station 36) to less than
station 36 5 15 25 −1500 −1200 −900 −600 −300 0 depth [m] 35 36 station 37 5 15 25 35 36 station 38 5 15 25 35 36 station 39 5 15 25 temperature [°C] 35 36 salinity station 40 5 15 25 35 36 station 41 5 15 25 35 36 −1500 −1200 −900 −600 −300 0 depth [m] station 42 5 15 25 35 36
Figure 2. Vertical profiles of salinity (black curves) and temperature (red curves).
10 % (station 40 and 42). Nanophytoplankton proportion ex-hibited a similar trend although the three last stations were more contrasted (range between 29 and 42 %). The smallest size class, i.e. picophytoplankton, increased southward from 41 to 64 %.
3.5 Vertical distribution of zooplankton
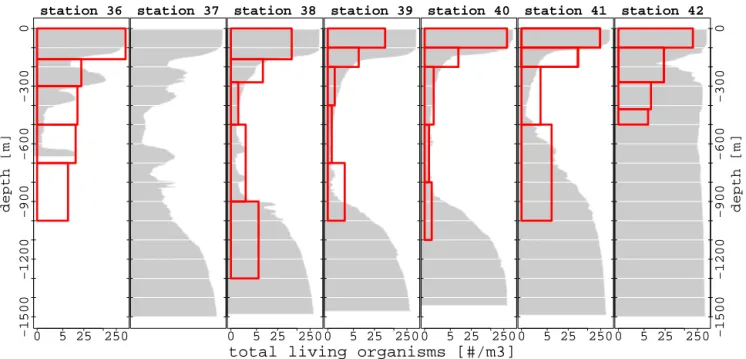
Overall, zooplanktons were slightly more abundant in the 0– 200 m depth interval of the northern stations than at the cen-tral stations (Fig. 7). For example, abundance decreased from 250 to 150 ind. m3at station 36 and station 41, respectively (Fig. 7). The upper oxycline (below 150 m depth) showed a sharp decrease in mesozooplankton abundances (Fig. 7). The lower oxycline (below 700 m depth), where oxygen increases with increasing depth, is marked by an increase in total meso-zooplankton abundance (Fig. 7), especially in copepod abun-dances.
3.6 Vertical distribution of SPM and LPM
All SPM and LPM profiles showed maxima between 0 and 100 m (Fig. 8). LPM integrated concentrations in that layer decrease by 2 from the north to the south (from 25 particles m−2at stations 36 and 37 to 15 particles m−2at stations 39 to 41, respectively). Deeper particle concentra-tions decreased and reached their first minimum in the up-per oxycline between 100 and 200 m depth (Fig. 8). From that layer, SPM and LPM abundance increased at all stations forming a distinct intermediate nepheloid layer (INL) at sta-tion 39, 40 and 41 and at stasta-tion 38 to a lesser extent. This INL was not evident at stations 36, 37 and 42. The INL peaks
ranged from 250 to 300 m being shallower at the most cen-tral stations. Detailed analysis of LPM vertical profiles for increasing size classes revealed that only LPM < 200 µm par-ticipated to the INL. Below the peaks, particle concentrations decreased down to the depth of the lower oxycline (700– 800 m depth). From this depth, LPM and particularly SPM concentrations increased again forming a less pronounced deep nepheloid layer (DNL). It is noticeable that the south-ward shoaling of INL and reduction of the depth range match the vertical patterns of the upper oxycline.
3.7 Vertical distribution of LPM > 530 µm
Concentrations of LPM > 530 µm decreased south-ward. However, the two size classes of LPM, 530 µm < LPM < 1.06 mm and LPM > 1.06 mm show different patterns. Maxima of 530 µm < LPM < 1.06 mm are observed in the upper 100 m depth at all stations except at stations 38 and 42. The INL observed for particles < 200 µm was not observed for LPM > 530 µm. At stations 36 and 37, vertical distribution of LPM > 1.06 mm to 2.66 mm shows a subsurface maximum centred at 250 m while this maxi-mum was observed at 500 m at station 38 and completely disappeared southward of station 38. LPM > 1.06 mm to 2.66 mm concentrations increased slightly at the lower OMZ boundary at stations 39 and 40.
3.8 Vertical distribution of carbon fluxes at two selected stations
The vertical carbon flux profiles calculated at station 37 and 40 decreased strongly in the upper 150 m layer, above the
Figure 3. Maps of net primary production before (10–17 February 2010, A) and during (6–13 March 2010, B) the arrival of the TARA vessel
in the Arabian Sea. Colours represent location of the stations. (C) weekly average net primary production before the cruise and the week during the cruise (year 2010).
upper oxycline (Fig. 11). At the deeper oxycline, a slight increase of flux was observed as the result of an increase in LPM > 530 µm concentrations. In addition, station 37 showed an intermediate zone where the flux increased in the core of the PGW (Fig. 11a).
4 Discussion
4.1 Impact of the ocean surface primary production on particles formation and export
The sampling took place at the end of the spring bloom, which started in late January and lasted until the end of February. By the 17–24 January 2010, a large phytoplank-ton bloom developed near the Somalia coasts and inside the Oman Gulf (Fig. 3a). Stations 36, 37 and 38 were lo-cated in the bloom area (net primary production close to
3 g C m−2d−1, Fig. 3c) while the southward stations were located outside this bloom. Stations 41 and 42 were located in the most oligotrophic waters (net primary production less than 0.5 g C m−2d−1).
The chronology of the observed bloom development is in agreement with previous studies showing large phyto-plankton bloom during winter in the coastal upwelling re-gions (Schott and McCreary, 2001; Gomes et al., 2008). This bloom can be followed by an enhanced export in the bloom area potentially explaining the observation of LPM > 530 µm in the deep layers (as deep as 400 m) of the northern sta-tions (station 36, 37 and 38) and their absence in the south-ern stations far from the source region. As a consequence, PSD slopes were steeper in the whole water column at sta-tions 41 and 42 compared to stasta-tions 37 and 38 (Table 3). The similar patterns between surface and deep PSD observed between these two groups of stations reinforce the concept of strong vertical coupling in particle production and carbon
station 36 3 4 5 10200 −1500 −1200 −900 −600 −300 0 depth [m] 0 20 40 station 37 3 4 5 10200 0 20 40 station 38 3 4 5 10200 0 20 40 station 39 3 4 5 10200 nitrate [µMol/l] oxygen [µMol/kg] 0 20 40 station 40 3 4 5 10200 0 20 40 station 41 3 4 5 10200 0 20 40 −1500 −1200 −900 −600 −300 0 depth [m] station 42 3 4 5 10200 0 20 40
Figure 4. Vertical profiles of nitrate (red) with oxygen concentration background (grey colour).
station 36 0 0.2 0.4 0 0.1 0.2 −300 −250 −200 −150 −100 −50 0 depth [m] station 37 0 0.2 0.4 0 0.1 0.2 station 38 0 0.2 0.4 0 0.1 0.2 station 39 0 0.2 0.4 0 0.1 0.2 cp (660nm) [1/m]
fluorescence [chloro WETLabs, mgChl/m3]
station 40 0 0.2 0.4 0 0.1 0.2 station 41 0 0.2 0.4 0 0.1 0.2 −300 −250 −200 −150 −100 −50 0 depth [m] station 42 0 0.2 0.4 0 0.1 0.2
Figure 5. Vertical profiles of fluorescence and cpwith oxygen concentration background (grey colour, for units see Fig. 4).
flux reported elsewhere (Boyd et al., 1997; Guidi et al., 2009). However, LPM vertical profiles also reveal an unex-pected variability within the northern stations (see the peak in LPM > 530 µm at 350 m at station 38 in association with the PGW) that may not only be related to specific OMZ or local processes. The impact of lateral transport by surface or
subsurface (PGW) current may impact particle spatial distri-bution.
4.2 Impact of horizontal advection on observed PSD The PGW spread out between 200 and 400 m (Morrison et al., 1999; Levin, 2002; Swift and Bower, 2003) and its signa-ture was observed as south as station 38 (Fig. 2). In addition,
Table 3. Mean and standard deviation of size-spectra (100 µm–2 mm) slope for all stations, computed for each layer 200m thick and on the
whole water column (last row of the table). No standard deviation is reported when only one profile was available.
Depth station 36 station 37 station 38 station 39 station 40 station 41 station 42 (m) mean sd mean sd mean sd mean sd mean sd mean sd mean sd 0–200 −2.53 0.08 −2.53 0.07 −3.19 0.13 −3.12 0.16 −3.04 0.09 −3.20 0.07 −3.42 0.20 200–400 −2.37 0.10 −2.34 0.02 −2.61 0.12 −3.59 0.13 −3.88 0.07 −4.05 0.12 −3.40 0.17 400–600 −2.84 0.09 −2.82 0.05 −2.58 0.11 −3.84 0.26 −3.69 0.13 −4.00 0.09 −3.37 0.14 600–800 −2.79 0.04 −2.95 0.07 −2.47 0.04 −3.19 0.30 −3.07 – −3.84 0.06 −3.36 0.10 800–1000 −2.87 0.04 −2.90 0.03 −2.57 0.04 −3.00 0.15 −3.03 – −3.76 0.05 −3.60 0.05 1000–1200 −2.69 – −2.72 0.22 −2.65 0.06 −3.00 0.04 −2.98 – −3.81 – −3.44 – 1200–1400 – – −2.61 – −2.65 – −3.13 0.09 −2.73 – −3.92 – −3.49 – 0–1400 −2.60 0.10 −2.61 0.03 −2.86 0.13 −3.36 0.15 −3.37 0.07 −3.65 0.09 −3.49 0.04 m g C h la m 2 36 37 38 39 40 41 42 micro− nano− pico− 0 5 10 15 20 25 30 stations
Figure 6. Total biomass of phytoplankton (in Chl a mg m−2)with proportion of phytoplankton size class (note that no sampling was performed at station 37). Average of 6 to 10 samples per station.
we observed high concentrations of particles > 1 mm at sta-tion 36 and 37 between 200 and 250 m (Fig. 9) suggesting a potential lateral transport by the PGW. In order to test this hypothesis, we used a 3-D backward lagrangian transport simulation. The catching areas of the statistical funnels are presented on Figure 12. The results suggest that for stations 36, 37 at 200 and 250 m the possibility that the source of particles could be the surface bloom that took place 15 days before the cruise in the northern area cannot be ruled out. In contrast, the results suggest that transport of surface particles from the northern bloom area to the southern stations (39 and mostly 40 and 41) is low. For example, the lagrangian modelling indicates that slowly settling particles (5 m d−1) found at 1000 m at station 40 could originate near station 38 but only if we admit a transport time of more than 250 days. This seems unlikely when taking into account the short life of aggregates before being consumed or transformed (few weeks, Ploug, 2001; Iversen and Ploug, 2010). In addition, none of the simulation indicates a successful transport of par-ticles from the coastal zones north or east of the stations. The sensitivity of our results to the possible underestimation of the velocity magnitude by the model is low (not shown).
En-velope areas never extend significantly towards the coasts, north or east of the stations. Therefore, stations 37 and 40 have been chosen for a detailed analysis of PSD as repre-sentative of the northern post bloom (possibly under the in-fluence of particle transport by advection), and oligotrophic open ocean conditions, respectively.
4.3 Biological processes in intermediate and deep nepheloid layers
The vertical distribution of cp and small LPM showed two distinct layers, an intermediate nepheloid layer (INL) and a deep nepheloid layer (DNL) (Fig. 8).
The INL developed between 150 and 300 m, at stations 39, 40 and 41 and with less extent at station 38. Intermediate depth particles maxima (revealed by light transmission) have been observed earlier in OMZ off the Peruvian coast (Pak et al., 1980; Whitmire et al., 2009), off Mexico (Garfield et al., 1983), in the Cariaco basin of the Gulf of Mexico (Tay-lor et al., 2001), and in the Indian Ocean (Naqvi et al., 1993; Shailaja, 2001). However, these studies could not unambigu-ously identify the nature and sources of these INL (local pro-duction vs. advective transport). Here, Lagrangian transport simulations ruled out lateral transport of continental neph-eloid layer from the Indian or the Oman coast as one of the important process at the origin of the INL. Transport of non-sinking small particles along isopycnals from continen-tal shelves in intermediate and nepheloid layers to open sea has been observed previously in many oceans (McCave et al., 2001). However, in this study, INL and DNL do not ap-pear to be confined to a specific water mass as it occurs over a wide density range (respectively σ –θ 26–27 kg m−3 and 27.4–27.6 kg m−3). Garfield et al. (1983) proposed that the presence of denitrifying and ammonium oxidizing bacteria could partly explain the persistence of a subsurface particle maximum in the Pacific OMZ. In the Arabian OMZ, Naqvi et al. (1993) and Naqvi (1994) indicated, from optical measure-ments, that the particle maxima does not exhibit a system-atic onshore–offshore gradient expected from an off-shore transport of the bottom nepheloid layer detaching from the
−1500 −1200 −900 −600 −300 0 depth [m] station 36 250 0 5 25 station 37 station 38 250 0 5 25 station 39 250 0 5 25
total living organisms [#/m3]
station 40 250 0 5 25 station 41 250 0 5 25 −1500 −1200 −900 −600 −300 0 depth [m] station 42 250 0 5 25
Figure 7. Vertical profiles of zooplankton abundance sampled with the multinet net (station 37 had no data), with oxygen concentration
background (grey colour, for units see Fig. 4).
station 36 2 10 20 −1500 −1200 −900 −600 −300 0 depth [m] 0 0.02 0.04 station 37 2 10 20 0 0.02 0.04 station 38 2 10 20 0 0.02 0.04 station 39
UVP total particles abundance [#/L]
2 10 20cp (660nm) [1/m]
0 0.02 0.04 station 40 2 10 20 0 0.02 0.04 station 41 2 10 20 0 0.02 0.04 −1500 −1200 −900 −600 −300 0 depth [m] station 42 2 10 20 0 0.02 0.04Figure 8. Vertical profiles of SPM (cp, black curves) and total LPM (UVP total particles abundance, red curves) with oxygen concentration
background (grey colour, for units see Fig. 4). The INL and DNL can be observed with peaks at 300 and 900 m depth respectively. Total LPM mainly represents the smallest particle size classes given their dominance.
continental margin. Instead the intermediate nepheloid layer tends to intensify offshore and show a remarkable associa-tion with the maximum of nitrites (corresponding to the sec-ondary minimum of nitrates). The authors suggested that this link could occur globally. Since then, this characteristic has
been observed in all OMZ where high bacterial abundances have been reported (Jayakumar et al., 2004; Gonsalves et al., 2011). Jayakumar et al. (2009) and Ward et al. (2009) found that near 200 m below the upper oxycline, denitrifying bacte-ria dominate the biomass. The upper oxycline has also been
station 36 0 0.1 0.2 0 0.4 0.8 −1500 −1200 −900 −600 −300 0 depth [m] station 37 0 0.1 0.2 0 0.4 0.8 station 38 0 0.1 0.2 0 0.4 0.8 station 39 0 0.1 0.2
[0.53−1.06]mm particles abundance [#/L]
0 0.4 0.8[1.06−2.66]mm particles abundance [#/L]
station 40 0 0.1 0.2 0 0.4 0.8 station 41 0 0.1 0.2 0 0.4 0.8 −1500 −1200 −900 −600 −300 0 depth [m] station 42 0 0.1 0.2 0 0.4 0.8Figure 9. Vertical profiles of two size classes of particles [0.53–1.06] mm (red) and > 1.06 mm (black), with oxygen concentration
back-ground (grey colour, for units see Fig. 4).
shown to be a layer of high DOC accumulation (Naqvi and Shailaja, 1993; Azam et al., 1994; Ramaiah et al., 1996; Ward et al., 2008; Paulmier et al., 2011), which could enhance the production of transparent exopolymer particles (TEP), fur-ther triggering the formation of aggregates much larger than individual bacteria (Chin et al., 1998; Verdugo, 2012) thus in the size range of LPM. Another plausible explanation is that these discrete particle layers are formed by transformations of redox-sensitive elements, such as Mn and Fe, which pre-cipitate when oxidized (Tuttle and Jannasch, 1973; Nealson and Myers, 1992). Therefore, one could deduce that INL are controlled by local bacterial activity. The apparent restriction of INL to the upper part of the OMZ implies that active mi-crobial metabolic processes may be more important below the surface production layer than deeper in the OMZ.
At the lower base of the OMZ, a second rich particle layer is observed at almost all stations with variable intensity. This DNL is observed below 900 m depth with the transmissome-ter data (stations 38, 39, 40, and 41) and also to a lesser extent in the larger particles fraction observed by the UVP (Figs. 8 and 9, stations 38, 39 and 40 deeper than 800 m depth). The DNL occurs in the layer just below the OMZ core and is asso-ciated to an increase of oxygen concentration and also to an increase of zooplankton abundance at stations 38, 39, 40 and 41 (Fig. 7). Although not observed at all stations, recurrent observation of this DNL here and in previous study (Naqvi et al., 1993) suggest that the base of the oxycline is a site of spe-cific biological and physical processes. Our observations and numerical simulations of particles sources (Fig. 12) do not
support the hypothesis of lateral transport. Instead we sug-gest that this deep increase in SPM and LPM under the OMZ core results from local physical and biological processes. Physical processes rely on increased collision between or-ganic or inoror-ganic precursors by change in the concentration of cations as observed in estuary (Wetz et al., 2009) or tur-bulence (Jackson, 1995). However, no study is available for both processes in the deep sea but turbulence can be ruled out in quiet deep water (Burd and Jackson, 2009). Collid-ing particles can be aggregated if glued in a TEP like matrix of biological origin. The latter can be affected by direct ef-fect of high metal concentrations (Mari and Robert, 2008), modification of pH (Riebesell et al., 2007; Mari, 2008), and to microbial processes (e.g. Muylaert et al., 2000). A recent study (Ganesh et al., 2014) has shown that particle attached bacteria are particularly present (and possibly active) in oxy-gen deficient water (South Pacific OMZ). Knowledge on the processes remains spare in OMZ anaerobic systems but re-peated observation by us and other (Vinogradov and Voron-ina, 1962; Wishner et al., 1995, 1998, 2008; Lee et al., 1998) supports the fact that this lower oxycline is a site of enhanced bacterial and plankton activity acting on particles. To date, this layer remains un-explored because of technological is-sues in sampling (by traps, pumps and nets) or observing (with in situ sensors) this deep layer.
According to Wishner et al. (2008, 2013) and Levin (2002), a unique zooplankton assemblage and secondary biomass peak occurred at the lower oxycline of the OMZ and is strongly associated with a specific oxygen concentration
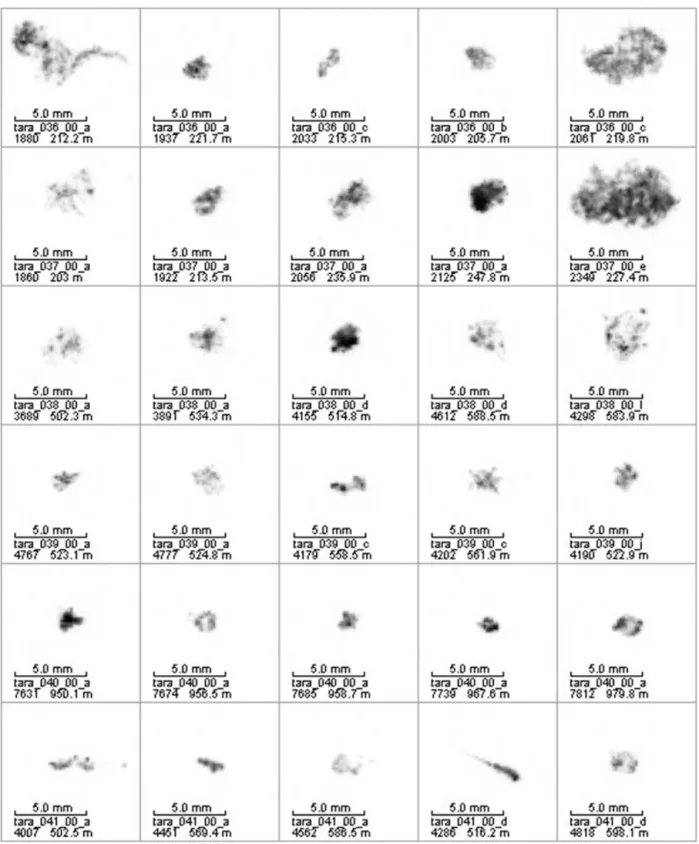
Figure 10. Examples of large aggregates observed at station 36 to 41 (depth is indicated on pictures).
of 2 µM. Even if the vertical resolution of the net sampling remains relatively poor in our case, the increase of zooplank-ton abundance at the lower oxycline contrasts notably with the OMZ core (Fig. 7). The biological habitat of the lower oxycline reported by Wishner et al. (1998, 2013) includes
different organisms such as foraminifera, copepods, chaetog-naths, gelatinous zooplankton, numerous non-migrating fish, and shrimp. Copepods living at depth in this region appeared to be persistent residents (Wishner et al., 2008). Many of the lower oxycline copepods are probably omnivorous particle
Figure 11. (A) Station 37, left panel: vertical profile of LPM fluxes with oxygen concentration background (grey colour, for units see Fig. 4).
Right panel: PSD in increasing depth layers (each layer is 200 m depth). The red line has a slope of −4 and is given as a reference line for all PSD. (B) same as (A) for station 40.
feeders, able to feed on bacteria, as shown by gut contents of S. antarcticus and L. grandis (Wishner et al., 2008). In the Arabian Sea, during the Joint Global Ocean Flux Study (JGOFS), Lee et al. (1998) also showed that particulate organic carbon (POC) flux could increase in this layer. These particle increases could result from trophic transformation by midwater zooplankton for example by repackaging of suspended material including bacteria into larger aggregates and/or by the release of body parts in the medium. Biologi-cal processes (bacterial growth, zooplankton feeding) at the lower oxycline could also be reinforced due to the sinking of fresh, non-degraded organic particles transiting through the OMZ core (Wishner et al., 1995, 2008).
4.4 Impact of the OMZ layer on particle and carbon flux
The vertical flux calculated using the UVP profiles (range 1–5 mg C m−2d−1at station 40 in the mesopelagic layer) is well within previous estimates during the same period of the year at similar depth (Lee et al., 1998). The vertical flux de-rived from the PSD show a strong variability at station 37 compared to station 40 probably due to the temporal dynam-ics of the surface bloom and lateral particle transport (see
large change in PSD associated to the PGW in Fig. 10a). Therefore, 1-D vertical assumption for station 37 cannot be assumed and the Martin model cannot be applied. By con-trast, stations 39 and 40 can be considered 1-D but due to deep increase in the calculated flux at the lower oxycline, we fitted the Martin law only to the points above the oxy-cline. For these stations, mean b value is equal to 0.22 ± 0.09 (n = 5) which is much lower than the value of 0.85 (Martin et al., 1987) obtained using sediment traps in non-OMZ region and more comparable to values found in other OMZs in sedi-ment traps (0.36–0.4, Devol and Hartnet, 2001; Van Mooy et al., 2002). In addition the b values at stations 39 and 40 are also in the lower range of values calculated in oligotrophic non-OMZ regions using similar and more comparable imag-ing approach (Guidi et al., 2009). At the upper oxycline, PSD does not show any variability (Fig. 11b) suggesting that the microbial activity as indicated by the change in nitrate or by the INL does not impact the settling of large particles.
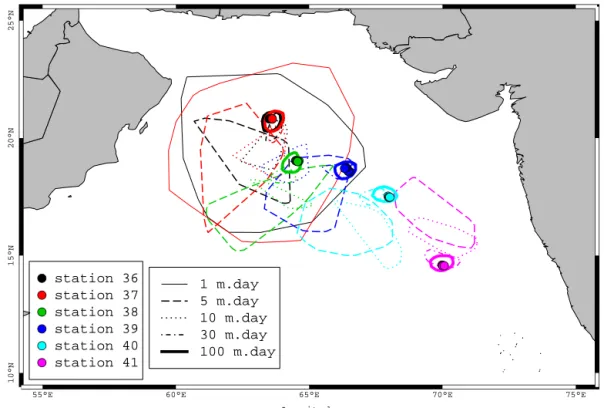
● ● ● ● ● ● station 36 station 37 station 38 station 39 station 40 station 41 1 m.day 5 m.day 10 m.day 30 m.day 100 m.day ●●●●●●●● ● ●●●●●●●●●● ● ● ● ●● ● ● ● ●●●●●● ●●●● Latitude Longitude
55°E 60°E 65°E 70°E 75°E
10°N
15°N
20°N
25°N
Figure 12. Results from backward Lagrangian simulations. Each envelope contains the 75 % of the initial particle number locating possible
source of particles observed in each vertical profiles. Five settling velocities were used (see legend). Note that envelopes are drawn only if more than 100 particles have reached the surface.
5 Conclusions
We observed strong vertical gradients in particle size distri-bution, biogeochemical and biological variables at the upper boundary of the OMZ. A gradient in particle concentration was also observed at the lower oxycline but less intense. Al-though many aspects of OMZ functioning still remain un-known, our results support earlier studies showing a strong layering of biological communities and processes. Our new results can be used to further discuss causal mechanisms. In the upper part of the OMZ core, the anaerobic microbial res-piration probably enhanced production and accumulation of observed particles < 100 µm but did not modify the calcu-lated particulate vertical flux. No specific vertical change of PSD > 100 µm was observed in the core of the OMZ sug-gesting that particulate flux transformation was low in that layer. At the lower oxycline of some stations, changes of abundances in both small and large particles classes are asso-ciated to zooplankton-enriched layers. There, the accumula-tion of large particles enhanced the calculated POC vertical flux to the bathy-pelagic zone of the ocean. Finally, the lack or low intensity of large particle remineralization in the core of the OMZ and possible particulate repackaging in the lower oxycline may further increase the ocean carbon sequestration in the OMZ of Arabian Sea relative to non-OMZ situations.
Acknowledgements. We thank the three anonymous reviewers
and Karl Banse for their comprehensive comments that helped us to improve the manuscript. We thank Rainer Kiko, Emmanuel Boss and Sergey Piontkovski for fruitful discussion on the subject, Philippe Verley for helping us with the ICHTHYOP model and Dominique Lefevre for his discussion about oxygen data. This study is partly based on data sets gathered by the TARA oceans expeditions 2009–2012 and funded by the ANR/Investissements d’Avenir program by means of the Oceanomics project (grant No. ANR-11-BTBR-0008). We are keen to thank the commitment of the people and the following sponsors who made this singular expedition possible: CNRS, EMBL, Genoscope/CEA, ANR, agnès b., the Veolia Environment Foundation, Region Bretagne, World Courier, Cap l’Orient, the Foundation EDF Diversiterre, FRB, the Prince Albert II de Monaco Foundation, Etienne Bourgois and the Tara schooner, crew. Moreover, this integrated sampling strategy could not have been done without the involvement of Ecole Normale Supérieure, Université Pierre et Marie Curie, Stazione Zoologica, University College Dublin, University of Milan-Bicocca, Institute de Ciences del Mar, University of Bremen, Institute de Microbiologie de la Mediterranée, MNHN, MIT, UofA, Bigelow Institute, Universite libre de Bruxelles, University of Hawaii.
The publication of this article is financed by CNRS-INSU.
References
Alldredge, A. L. and Silver, M. W.: Characteristics, dynamics and significance of marine snow, Progr. Oceanogr., 20, 41–82, 1988. Anderson, T. R., Ryabchenko, V. A., Fasham, M. J. R., and Gor-chakov, V. A.: Denitrification in the Arabian Sea : A 3D ecosys-tem modelling study, Deep-Sea Res. Pt. I, 54, 2082–2119, 2007. Azam, F., Steward, G. F., Smith, D. C., and Ducklow, H. W.: Sig-nificance of bacteria in carbon fluxes in the Arabian Sea, J. Earth Syst. Sci., 103, 341–351, 1994.
Bahurel, P.: Mercator Ocean Global to Regional Ocean Monitoring and Forecasting, Ocean Weather Forecasting, Springer Nether-lands, 381–395, 2006.
Behrenfeld, M. J. and Falkowski, P. G.: Photosynthetic rates de-rived from satellite-based chlorophyll concentration, Limnol. Oceanogr., 42, 1–20, 1997.
Boyd, P., Newton, P., Rivkin, R. B., Legendre, L., Deibel, D., Trem-blay, J.-E., Klein, B., Crocker, K., Roy, S., Silverberg, N., Love-joy, C., Mesplé, F., Romero, N., Anderson, M. R., Matthews, P., Savenkoff, C., Vézina, A., Therriault, J.-C., Wesson, J., Bérubé, C., and Ingram, R. G.: Measuring Biogenic Carbon Flux in the Ocean, Science, 24, 554–555, 1997.
Burd, A. B. and Jackson, G. A.: Particle aggregation, Annu. Rev. Mar. Sci., 1, 65–90, 2009.
Chin, W.-C., Orellana, M. V. and Verdugo, P.: Spontaneous assem-bly of marine dissolved organic matter into polymer gels, Nature, 391, 568–572, 1998.
Claustre, H.: The trophic status of various oceanic provinces as re-vealed by phytoplankton pigment signatures, Limnol. Oceanogr., 39, 1206–1210, 1994.
Courant, R., Friedrichs, K., and Lewy, H.: On the Partial Differ-ence Equations of Mathematical Physics, IBM Journal, Transla-tion from a paper originally appeared in Mathematische Annalen, 100, 32–74, 1928, 1967.
de Boyer Montegut, C., Madec, G., Fischer, A. S., Lazar, A., and Iudicone, D.: Mixed layer depth over the global ocean : An ex-amination of profile data and a profile-based climatology, J. Geo-phys. Res., 109, C12003, doi:10.1029/2004JC002378, 2004. Devol, A. H. and Hartnett, H. E.: Role of the oxygen-deficient
zone in transfer of organic carbon to the deep ocean, Limnol. Oceanogr., 46, 1684–1690, 2001.
Ganesh, S., Parris, D. J., Delong, E. F., and Stewart, F. J.: Metage-nomic analysis of size-fractionated picoplankton in a marine oxygen minimum zone, ISME J., 8, 187–211, 2014.
Garcia, H. E., Locarnini, R. A., Boyer, T. P., Antonov, J. I., Bara-nova, O. K., Zweng, M. M., and Johnson, D. R.: World Ocean Atlas 2009, Volume 3: Dissolved Oxygen, Apparent Oxygen Uti-lization, and Oxygen Saturation, edited by: Levitus, S., NOAA Atlas NESDIS 70, U.S. Government Printing Offce, Washington DC, 344 pp., 2010.
Garfield, P. C., Packard, T. T., Friederich, G. E., and Codispoti, L. A.: A subsurface particle maximum layer and enhanced
micro-bial activity in the secondary nitrite maximum of the northeastern tropical Pacific Ocean, J. Mar. Res., 41, 747–768, 1983. Gomes, H. do R, Goes, J. I., Matondkar, S. G. P., Parab, S. G.,
Al-Azri, A. R. N., and Thoppil, P. G.: Blooms of Noctiluca miliaris in the Arabian Sea – An in situ and satellite study, Deep-Sea Res. Pt. I, 55, 751–65, 2008.
Gonsalves, M.-J., Paropkari, A. L., Fernandes, C. E. G., Loka Bharathi, P. A., Krishnakumari, L., Fernando, V., and Nam-poothiri, G. E.: Predominance of anaerobic bacterial community over aerobic community contribute to intensify “oxygen min-imum zone” in the eastern Arabian Sea, Cont. Shelf Res., 1, 1224–1235, 2011.
Gorsky, G., Ohman, M. D., Picheral, M., Gasparini, S., Stemmann, L., Romagnan, J. B., Cawood, A., Pesant, S., Pesant, C., and Pre-jger, F.: Digital zooplankton image analysis using the ZooScan integrated system, J. Plankton Res., 32, 285–303, 2010. Guidi, L., Jackson, G. A., Stemmann, L., Miquel, J. C., Picheral, M.,
and Gorsky, G.: Relationship between particle size distribution and flux in the mesopelagic zone, Deep-Sea Res. Pt. I, 55, 1364– 1374, 2008.
Guidi, L., Stemmann, L., Jackson, G. A., Ibanez, F., Claustre, H., Legendre, L., Picheral, M., and Gorsky, G.: Effects of phyto-plankton community on production, size and export of large ag-gregates: a world-ocean analysis, Limnol. Oceanogr., 54, 1951– 1963, 2009.
Haake, B., Ittekkot, V., Ramaswamy, V., Nair, R. R., and Honjo, S.: Fluxes of amino acids and hexosamines to the deep Arabian Sea, Mar. Chem., 40, 291–314, 1992.
Jackson, G. A.: TEP and coagulation during a mesocosm experi-ment, Deep-Sea Res. Pt. II, 42, 215–222, 1995.
Jayakumar, D. A., Francis, C. A., Naqvi, S. W. A., and Ward, B. B.: Diversity of nitrite reductase genes (nirS) in the denitrifying water column of the coastal Arabian Sea, Aquat. Microbial Ecol., 34, 69–78, 2004.
Jayakumar, D. A., O’Mullan, G. D., Naqvi, S. W. A., and Ward, B. B.: Denitrifying bacterial community composition changes asso-ciated with stages of denitrification in oxygen minimum zones, Microbial Ecol., 58, 350–362, 2009.
Kristensen, E., Devol, A. H., and Hartnett, H. E.: Organic matter diagenesis in sediments on the continental shelf and slope of the Eastern Tropical and temperate North Pacific, Cont. Shelf Res., 19, 1331–1351, 1999.
Lee, C., Murray, D. W., Barber, R. T., Buesseler, K. O., Dymond, J., Hedges, J. I., Honjo, S., Manganini, S. J., Marra, J., Moser, C., Peterson, M. L., Prell, W. L., and Wakeham, S. G.: Particulate organic carbon fluxes: compilation of results from the 1995 US JGOFS Arabian Sea Process Study: By the Arabian Sea Carbon Flux Group, Deep-Sea Res. Pt. II, 45, 2489–2501, 1998. Lellouche, J.-M., Le Galloudec, O., Drévillon, M., Régnier, C.,
Greiner, E., Garric, G., Ferry, N., Desportes, C., Testut, C.-E., Bricaud, C., Bourdallé-Badie, R., Tranchant, B., Benkiran, M., Drillet, Y., Daudin, A., and De Nicola, C.: Evaluation of global monitoring and forecasting systems at Mercator Océan, Ocean Sci., 9, 57–81, doi:10.5194/os-9-57-2013, 2013.
Lett, C., Verley, P., Mullon, C., Parada, C., Brochier, T., Penven, P., and Blanke, B.: A lagrangian tool for modelling ichthyoplankton dynamics, Environ. Model. Softw., 23, 1210–1214, 2008. Levin, A.: Deep-ocean life where oxygen is scarce, Am. Sci., 90,
Mari, X.: Does ocean acidification induce an upward flux of marine aggregates?, Biogeosciences, 5, 1023–1031, doi:10.5194/bg-5-1023-2008, 2008.
Mari, X. and Robert, M.: Metal induced variations of TEP sticking properties in the southwestern lagoon of New Caledonia, Mar. Chem., 110, 98–108, doi:10.1016/j.marchem.2008.02.012, 2008. Martin, J. H., Knauer, G. A., Karl, D. M., and Broenkow, W. W.: VERTEX: carbon cycling in the northeast Pacific, Deep-Sea Res., 34, 267–85, 1987.
McCave, I. N., Hall, I. R., Antia, A. N., Chou, L., Dehairs, F., Lampitt, R. S., Thomsen, L., van Weering, T. C. E., and Wol-last, R.: Distribution, composition and flux of particulate mate-rial over the European margin at 47◦–50◦N, Deep-Sea Res. Pt. II, 48, 3107–3139, 2001.
Morel, A. and Berthon, J.-F: Surface pigments, algal biomass pro-files, and potential production of the euphotic layer: Relation-ships reinvestigated in view of remote-sensing applications, Lim-nol. Oceanogr., 34, 1545–1562, 1989.
Morrison, J. M., Codispoti, L. A., Smith, S. L., Wishner, K., Flagg, C., Gardner, W. D., Gaurin, S., Naqvi, S. W. A., Manghnani, V., Prosperie, L., and Gundersen, J. S.: The oxygen minimum zone in the Arabian Sea during 1995. Deep-Sea Res. Pt. II, 46, 1903– 1931, 1999.
Muylaert, K., Sabbe, K., and Vyverman, W.: Spatial and temporal dynamics of phytoplankton communities in a freshwater tidal es-tuary (Schelde, Belgium), Estuar. Coast. Shelf S., 50, 673–687, 2000.
Naqvi, S. W. A.: Some aspects of the oxygen-deficient conditions and denitrification in the Arabian Sea, J. Mar. Res., 45„ 1049– 1072, 1987.
Naqvi, S. W. A. : Denitrification processes in the Arabian Sea, P. Indian AS – Earth, 103, 279–300, 1994.
Naqvi, S. W. A. and Shailaja, M. S.: Activity of the respiratory electron transport system and respiration rates within the oxy-gen minimum layer of the Arabian Sea, Deep-Sea Res. Pt. II, 40, 687–695, 1993.
Naqvi, S. W. A., Kumar, M. D., Narvekar, P. V., De Sousa, S. N., George, M. D., and D’Silva, C.: An intermediate nepheloid layer associated with high microbial metabolic rates and denitrifica-tion in the northwest Indian Ocean. J. Geophys. Res., 98, 16469– 16416, 1993.
Nealson, K. H. and Myers, C. R.: Microbial reduction of manganese and iron: new approaches to carbon cycling, Appl. Environ. Mi-crobiol., 58, 439–443, 1992.
Pak, H., Codispoti, L. A., and Zaneveld, J. R. V.: On the intermedi-ate particle maxima associintermedi-ated with oxygen-poor wintermedi-ater off west-ern South America, Deep-Sea Res., 27, 783–797, 1980. Paulmier, A. and Ruiz-Pino, D.: Oxygen minimum zones (OMZs)
in the modern ocean, Progr. Oceanogr., 80, 113–128, 2008. Paulmier, A., Ruiz-Pino, D., and Garçon, V.: CO2 maximum in
the oxygen minimum zone (OMZ), Biogeosciences, 8, 239–252, doi:10.5194/bg-8-239-2011, 2011.
Peterson, M. L., Wakeham, S. G., Lee, C., Askea, M. A., and Miquel, J. C.: Novel techniques for collection of sinking parti-cles in the ocean and determining their settling rates, Limnol. Oceanogr.-Methods, 3, 520–532, 2005.
Picheral, M., Guidi, L., Stemmann, L., Karl, D. M., Iddaoud, G., and Gorsky, G.: The Underwater Vision Profiler 5: An advanced in-strument for high spatial resolution studies of particle size
spec-tra and zooplankton, Limnol. Oceanogr.-Methods, 8, 462–473, 2010.
Ploug, H.: Small-scale oxygen fluxes and remineralization in sink-ing aggregates, Limnol. Oceanogr., 46, 1624–1631, 2001. Ramaiah, N., Raghukumar, S., and Gauns, M.: Bacterial abundance
and production in the central and eastern Arabian Sea, Curr. Sci., 71, 878–882, 1996.
Riebesell, U., Schulz, K. G., Bellerby, R. G. J., Botros, M., Fritsche, P., Meyerhöfer, M., Neill, C., Nondal, G., Oschlies, A., Wohlers, J., and Zöllner, E.: Enhanced biological carbon consumption in a high CO2ocean, Nature, 450, 545–548, 2007.
Schott, F. A and McCreary Jr., J. P.: The monsoon circulation of the Indian Ocean, Progr. Oceanogr., 51, 1–123, 2001.
Shailaja, M. S.: Respiratory enzyme activities in the oxygen-deficient waters of the Arabian Sea, Curr. Sci., 81, 684–689, 2001.
Siegel, D. A., Fields, E. and Buesseler, K. O.: A bottom-up view of the biological pump: Modeling source funnels above ocean sediment traps, Deep-Sea Res. Pt. I, 55, 108–127, 2008. Stemmann, L., Gorsky, G., Marty, J. C., Picheral, M., and Miquel,
J. C.: Four-year study of large-particle vertical distribution (0– 1000 m) in the NW Mediterranean in relation to hydrology, phy-toplankton, and vertical flux, Deep-Sea Res. Pt. II, 49, 2143– 2162, 2002.
Stemmann, L., Jackson, G., and Ianson, D.: A vertical model of particle size distributions and fluxes in the midwater column that includes biological and physical processes, I Model formulation, Deep-Sea Res. Pt. I, 51, 885–908, 2004.
Stramma, L., Schmidtko, S., Levin, L. A., and Johnson, G. C.: Ocean oxygen minima expansions and their biological impacts, Deep-Sea Res. Pt. I, 57, 587–595, 2010.
Swift, S. A. and Bower, A. S.: Formation and circulation of dense water in the Persian/Arabian Gulf, J. Geophys. Res.-Oceans, 108, 3004, doi:10.1029/2002JC001360, 2003.
Syvitski, J. P. M., Asprey, K. W., and Leblanc, K. W. G.: In-situ characteristics of particles settling within a deep-water estuary, Deep-Sea Res. Pt. II, 42, 223–256, 1995.
Taylor, G. T., Iabichella, M., Ho, T.-Y., Scranton, M., Thunell, R. C., Muller-Karger, F., and Varela, R.: Chemoautotrophy in the redox transition zone of the cariaco basin: A significant midwa-ter source of organic carbon production, Limnol. Oceanogr., 46, 148–163, 2001.
Tuttle, J. H. and Jannasch, H. W.: Sulfide and thiosulfate-oxidizing bacteria in anoxic marine basins. Mar. Biol., 20, 64–70, 1973. Uitz, J., Claustre, H., Morel, A., and Hooker, S. B.: Vertical
dis-tribution of phytoplankton communities in open ocean : An as-sessment based on surface chlorophyll, J. Geophys. Res., 111, C08005, doi:10.1029/2005JC003207, 2006.
Van Mooy, B. A. S., Keil, R. G., and Devol, A. H.: Impact of sub-oxia on sinking particulate organic carbon: Enhanced carbon flux and preferential degradation of amino acids via denitrification, Geochim. Cosmochim. Ac., 66, 457–465, 2002.
Verdugo, P.: Marine microgels, Annu. Rev. Mar. Sci., 4, 375–400, 2012.
Vinogradov, M. E. and Voronina, N. M.: Influence of the oxygen deficit on the distribution of plankton in the Arabian Sea, Deep-Sea Res., 9, 523–530, 1962.
Ward, B. B., Tuit, C. B., Jayakumar, A., Rich, J. J., Moffett, J., and Naqvi, S. W. A.: Organic carbon, and not copper, controls
denitri-fication in oxygen minimum zones of the ocean, Deep-Sea Res. Pt. I, 55, 1672–1683, 2008.
Ward, B. B., Devol, A. H., Rich, J. J., Chang, B. X., Bulow, S. E., Naik, H., Pratihary, A., and Jayakumar, A.: Denitrification as the dominant nitrogen loss process in the Arabian Sea, Nature, 461, 78–81, 2009.
Wetz, M. S., Robbins, M. C., and Paerl, H. W.: Transparent ex-opolymer particles (TEP) in a river-dominated estuary: spatial-temporal distributions and an assessment of controls upon TEP formation, Estuar. Coasts, 33, 447–455, 2009.
Whitmire, A. L., Letelier, R. M., Villagran, V., and Ulloa, O.: Autonomous observations of in vivo fluorescence and particle backscattering in an oceanic oxygen minimum zone, Opt. Expr., 17, 21992–22004, 2009.
Wishner, K. F., Ashjian, C. J., Gelfman, C., Gowing, M. M., Kann, L., Levin, L. A., Mullineaux, L. S., and Saltzman, J.: Pelagic and benthic ecology of the lower interface of the Eastern Tropical Pacific oxygen minimum zone, Deep-Sea Res. Pt. I, 42, 93–115, 1995.
Wishner, K. F., Gowing, M. M., and Gelfman, C.: Mesozooplankton biomass in the upper 1000 m in the Arabian Sea: overall seasonal and geographic patterns, and relationship to oxygen gradients, Deep-Sea Res. Pt. II, 45, 2405–2432, 1998.
Wishner, K. F., Gelfman, C., Gowing, M. M., Outram, D. M., Rapien, M., and Williams, R. L.: Vertical zonation and distri-butions of calanoid copepods through the lower oxycline of the Arabian Sea oxygen minimum zone, Progr. Oceanogr., 78, 163– 191, 2008.
Wishner, K. F., Outram, D. M., Seibel, B. A., Daly, K. L., and Williams, R. L.: Zooplankton in the eastern tropical north Pacific: Boundary effects of oxygen minimum zone expansion, Deep-Sea Res. Pt. I, 79, 122–140, 2013.
![Figure 9. Vertical profiles of two size classes of particles [0.53–1.06] mm (red) and > 1.06 mm (black), with oxygen concentration back- back-ground (grey colour, for units see Fig](https://thumb-eu.123doks.com/thumbv2/123doknet/13612238.424861/12.918.84.833.101.488/figure-vertical-profiles-classes-particles-oxygen-concentration-ground.webp)