HAL Id: hal-02448719
https://hal.archives-ouvertes.fr/hal-02448719
Submitted on 22 Jan 2020
HAL is a multi-disciplinary open access archive for the deposit and dissemination of sci-entific research documents, whether they are pub-lished or not. The documents may come from teaching and research institutions in France or abroad, or from public or private research centers.
L’archive ouverte pluridisciplinaire HAL, est destinée au dépôt et à la diffusion de documents scientifiques de niveau recherche, publiés ou non, émanant des établissements d’enseignement et de recherche français ou étrangers, des laboratoires publics ou privés.
The inclusion of biodiversity in impact assessment for
urban development: policy-related progress limited by
gaps and semantic confusion
Charlotte Bigard, Sylvain Pioch, John Thompson
To cite this version:
Charlotte Bigard, Sylvain Pioch, John Thompson. The inclusion of biodiversity in impact assessment for urban development: policy-related progress limited by gaps and semantic confusion. Journal of Environmental Management, Elsevier, 2017, 200, pp.35-45. �hal-02448719�
1 Title
The inclusion of biodiversity in impact assessment for urban development: policy-related
progress limited by gaps and semantic confusion
Authors
Charlotte Bigarda,c,*, Sylvain Piochb, John D. Thompsona
a UMR 5175 Centre d'Ecologie Fonctionnelle et Evolutive, CNRS, 1919 route de Mende, 34293 Montpellier Cedex 5, France
b UMR 5175, Centre d'Ecologie Fonctionnelle et Evolutive, Université de Montpellier - Université Paul-Valéry Montpellier, Route de Mende, 34199 Montpellier Cedex 5, France
c Montpellier Méditerranée Métropole, 50, place Zeus, CS 39556, 34961 Montpellier CEDEX 2, France
* Corresponding author: Charlotte Bigard, Tel. : +33(0)682374628
E-mail addresses: charlotte.bigard@cefe.cnrs.fr (C. Bigard), sylvain.pioch@gmail.com (S. Pioch), john.thompson@cefe.cnrs.fr (J.D. Thompson)
Key words: environmental impact assessment; mitigation hierarchy; conservation science; land use planning; no net loss
2 ABSTRACT
Natural habitat loss and fragmentation, as a result of development projects, are major causes of biodiversity erosion. Environmental impact assessment (EIA) is the most commonly used site-specific planning tool that takes into account the effects of development projects on biodiversity by integrating potential impacts into the mitigation hierarchy of avoidance, reduction, and offset measures. However, the extent to which EIA fully address the identification of impacts and conservation stakes associated with biodiversity loss has been criticized in recent work. In this paper we examine the extent to which biodiversity criteria have been integrated into 42 EIA from 2006 to 2016 for small development projects in the Montpellier Metropolitan territory in southern France. This study system allowed us to question how EIA integrates biodiversity impacts on a scale relevant to land-use planning. We examine how biodiversity inclusion has changed over time in relation to new policy for EIA and how the mitigation hierarchy is implemented in practice and in comparison with national guidelines. We demonstrate that the inclusion of biodiversity features into EIA has increased significantly in relation to policy change. Several weaknesses nevertheless persist, including the continued absence of substitution solution assessment, a correct analysis of cumulative impacts, the evaluation of impacts on common species, the inclusion of an ecological network scale, and the lack of monitoring and evaluation measures. We also show that measures for mitigation hierarchy are primarily associated with the reduction of impacts rather than their avoidance, and avoidance and offset measures are often misleadingly proposed in EIA. There is in fact marked semantic confusion between avoidance, reduction and offset measures that may impair stakeholders’ understanding. All in all, reconsideration of stakeholders routine practices associated with a more strategic approach towards impact anticipation and avoidance at a land-use planning scale is now necessary for the mitigation hierarchy to become a clear and practical hierarchy for “no net loss” objectives based on conservation priorities.
Highlights
The inclusion of biodiversity features in EIA has increased in relation to new policy. The analyses of cumulative impacts and ecological networks remain weak.
Proposed mitigation measures are often poorly defined and primarily concern reduction of impacts.
Avoidance measures are seldom implemented within EIA.
A strategic approach based on priorities for avoidance could render mitigation measures a true hierarchy.
3 1. Introduction
Natural habitat destruction by development projects (e.g. linear infrastructures, urbanisation, commercial centres, quarries, etc) has continued to cause the loss of genetic and species diversity, the fragmentation of natural habitats and the degradation of ecosystem function (Fahrig, 2003; McKinney, 2008; MEA, 2005). Many countries have thus developed instruments that attempt to ensure a « no net loss » (henceforth NNL) of biodiversity with measures to attenuate and mitigate the loss of biodiversity in the face of land development (Bull et al., 2016; Hassan et al., 2015; Maron et al., 2016). The development of the NNL paradigm, and its application in land-use planning, has however encountered difficulties due to inconsistencies in the way its underlying concepts are framed (Apostolopoulou and Adams, 2015; Bull et al., 2016; Gordon et al., 2015), how impacts are compared with a baseline to assure NNL (Bull et al., 2014; Maron et al., 2016, 2015). Indeed, in practice, NNL appears to be impossible, there is nearly always some form of decline in biodiversity - a sort of generalised net loss impossible to avoid, but never explicitly presented (Aronson and Moreno-Mateos, 2015; Maron et al., 2012; Moreno-Mateos et al., 2015). In relation to these difficulties, many countries have developed two main instruments to apply NNL policy in their land-use planning procedures.
The first of these instruments concerns Environmental Impact Assessment (henceforth EIA) that developed during the 1970’s to become a key instrument in site specific planning for biodiversity (Mandelik et al., 2005) and environmental management (Morgan, 2012). EIA contributes to the assessment and anticipation of development projects and their impacts and to the adoption of pro-active policy to mitigate the impacts of such projects. However, many authors have pointed out recurrent weakness in the identification of impacts and the conservation stakes associated with biodiversity (Byron et al., 2000; Drayson et al., 2015; Gontier et al., 2006; Thompson et al., 1997; Treweek and Thompson, 1997). EIA has also been criticised because choices among alternative options for development projects are more often based on socio-economic considerations than on ecological arguments (Bonthoux et al. 2015), the delimitation of the area used to assess impacts is often made on a non-ecological basis (Geneletti, 2006), measurable indicators or quantitative predictions are rarely used (Mandelik et al., 2005; Samarakoon and Rowan, 2008), and because the assessment of the relevance of an impact is unclear (Atkinson et al., 2000; Khera and Kumar, 2010). In addition, the study scope is often poorly defined or too narrow; many studies only assess biodiversity in terms of species populations’ with little attention paid to understanding of effects on ecological processes, ecosystem function or genetic variation (Atkinson et al., 2000; Gontier et al., 2006; Khera and Kumar, 2010). Finally, although the determination of the significance of impacts has become more standardised, accurate and more clearly justified, several limitations remain in terms
4 of the identification of significant impacts and the lack of monitoring (Briggs and Hudson, 2013; Mandelik et al., 2005; Treweek and Thompson, 1997).
EIA provides basic information for the identification of NNL objectives within the context of a second major policy instrument, the so-called mitigation hierarchy. This hierarchy provides a policy framework to identify the process by which environmental impacts from development can be “avoided”, unavoidable impacts “reduced”, and residual impacts “offset” (Maron et al., 2016). This mitigation hierarchy has also become a subject of concern in terms of its environmental efficiency, social implications and ethical basis (Gobert, 2015; Gordon et al., 2015; Levrel et al., 2015; Lucas, 2009; Maron et al., 2016; Moreno-Mateos et al., 2015). Despite high scientific tractability, it begets only moderate implementation tractability and clear-cut rules on how to classify certain impacts within the mitigation hierarchy and in the use of its terminology, barely exist (Martin, 2015; Bull et al., 2016; Maron et al., 2016). In addition, the common reliance on offsetting to achieve NNL has received serious criticism due to the fact that offsets are rarely adequate, complete offsetting may be illusory due to the complexity of ecological processes (Gardner et al., 2013; Moreno-Mateos et al., 2015) and weak institutional organisation of the mitigation hierarchy impairs attempts to achieve NNL(Jacob et al., 2015; Lucas, 2009). Problems associated with identifying ecological equivalence and the absence of a systematic regional approach further undermine the efficiency of the mitigation hierarchy (Habib et al., 2013; Kujala et al., 2015).
The objective of this study is to examine how biodiversity is integrated into EIA and then defined and treated in the mitigation hierarchy. We examine this issue in relation to recent changes in French policy and recommendations to improve the EIA procedure and implement the mitigation hierarchy. In this context, our study addresses four main questions. First, how are impacts on biodiversity taken into account in a large sample of EIA, all elaborated within a single territory? Second, is there a significant effect of new policy that proposes to make a more detailed analysis of biodiversity features and their inclusion in EIA? Third, how are cumulative impacts taken into account for the study area? Finally, how well are impacts and propositions made in the EIA defined within the mitigation hierarchy in relation to French national guidelines?
5 2. Methods
2.1. Case study
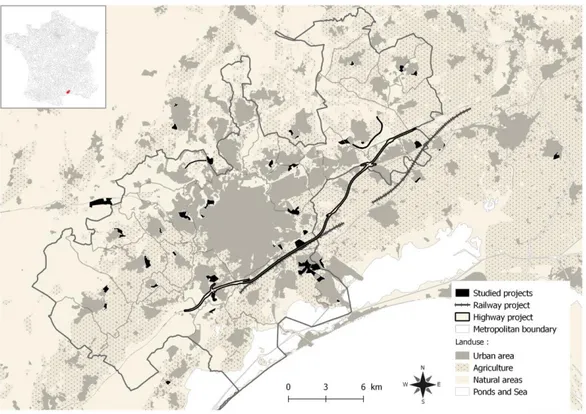
To undertake this study we analysed 42 EIA associated with projects in a single territory, that of the Montpellier Metropolitan Territory (31 municipalities) and nine adjoining municipalities in southern France (Fig. 1). This form of territorial grouping allows the different local municipalities to mutualise their objectives and obligations (waste treatment, sanitation, economic development …) and to develop coherent urban land-use planning strategies. The territory contains a patchwork of semi-natural Mediterranean-type habitats rich in biodiversity, various agricultural areas and is one of the fastest developing metropolitan territories in France.
Figure 1: Spatial distribution of the 42 EIA elaborated in and around the Montpellier Metropolitan territory in
France from 2006 to 2016.
The 42 EIA we studied represent a large number of small-scale projects each of which has impacts primarily on common species and habitats and, to a lesser extent on protected habitats and species. The EIA for the 42 projects were elaborated between 2006 and 2016. Two major infrastructures projects that had EIA documents elaborated during this time period were not used in the initial analyses because their impact concerned several municipalities and different types of ecosystem. Hence, the amount of money and time invested in the EIA production was way above that of all the other 42 projects. The two infrastructure projects are thus not comparable with the 42 small-scale
6 projects. We thus only used the information in these two EIA in the analysis of cumulative impacts on biodiversity (see below). Thirty-nine of the development projects are small-scale development zones or housing projects, there is one photovoltaic solar power plant project and two short sections of local road construction. They all have irreversible impacts on terrestrial habitats. The EIA of each project was obtained from the archives of the State environmental agency in the study region (DREAL), the authority in charge of examining EIA.
2.2. A data base to examine biodiversity inclusion in EIA
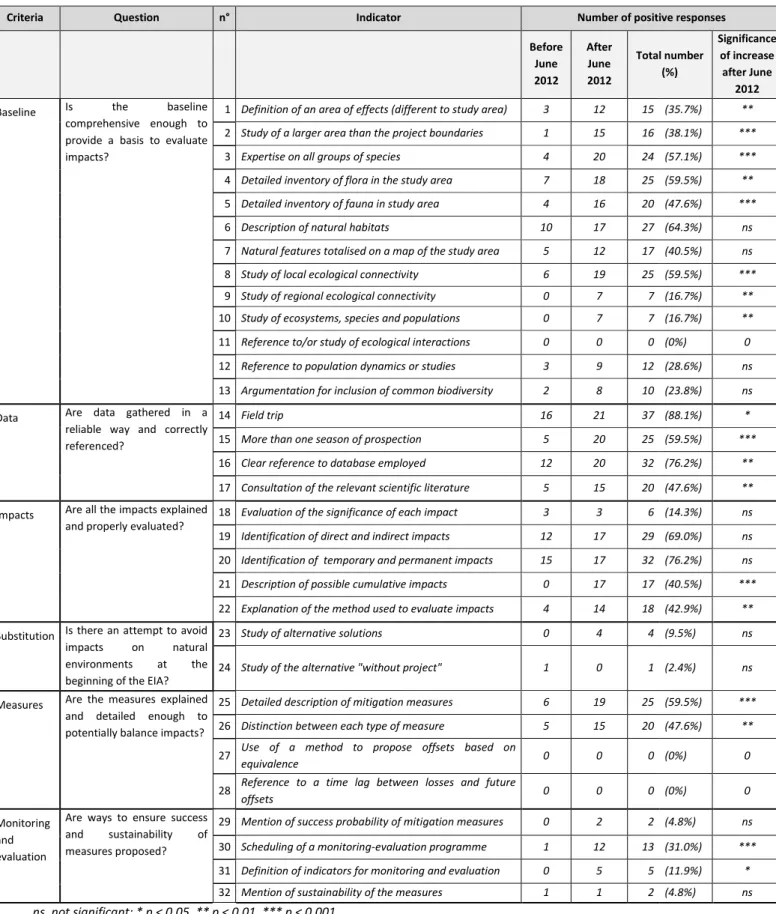
We conducted a systematic examination of the extent to which biodiversity is included in each of the 42 EIA. To do so we analysed six criteria, or questions, that reflect the organisation of the different chapters of an EIA (Table 1). The first criterion concerns a “baseline” description of the impacted zone in terms of species and habitats present, ecological networks, ecological equilibria and ecological interactions. The second involves how “data” are collected and their pertinence. The third concerns a description of the “impacts” which may be positive or negative, direct or indirect, temporary or permanent and can be cumulative with those in other development projects. The fourth requires an assessment of alternative (“substitution”) solutions and a test of the compatibility with existing planning documents. The fifth involves descriptions of the necessary “measures” that are proposed for implementation within the mitigation hierarchy. The sixth criterion relates to propositions for “monitoring and evaluation”. To provide quantitative and qualitative response data in relation to these questions, 32 indicators concerning how biodiversity is included in an EIA were developed (Table 1).
7
Criteria Question n° Indicator Number of positive responses Before June 2012 After June 2012 Total number (%) Significance of increase after June 2012
Baseline Is the baseline comprehensive enough to provide a basis to evaluate impacts?
1 Definition of an area of effects (different to study area) 3 12 15 (35.7%) **
2 Study of a larger area than the project boundaries 1 15 16 (38.1%) *** 3 Expertise on all groups of species 4 20 24 (57.1%) *** 4 Detailed inventory of flora in the study area 7 18 25 (59.5%) **
5 Detailed inventory of fauna in study area 4 16 20 (47.6%) *** 6 Description of natural habitats 10 17 27 (64.3%) ns 7 Natural features totalised on a map of the study area 5 12 17 (40.5%) ns 8 Study of local ecological connectivity 6 19 25 (59.5%) ***
9 Study of regional ecological connectivity 0 7 7 (16.7%) **
10 Study of ecosystems, species and populations 0 7 7 (16.7%) ** 11 Reference to/or study of ecological interactions 0 0 0 (0%) 0
12 Reference to population dynamics or studies 3 9 12 (28.6%) ns
13 Argumentation for inclusion of common biodiversity 2 8 10 (23.8%) ns Data Are data gathered in a
reliable way and correctly referenced?
14 Field trip 16 21 37 (88.1%) *
15 More than one season of prospection 5 20 25 (59.5%) *** 16 Clear reference to database employed 12 20 32 (76.2%) ** 17 Consultation of the relevant scientific literature 5 15 20 (47.6%) ** Impacts Are all the impacts explained
and properly evaluated?
18 Evaluation of the significance of each impact 3 3 6 (14.3%) ns
19 Identification of direct and indirect impacts 12 17 29 (69.0%) ns 20 Identification of temporary and permanent impacts 15 17 32 (76.2%) ns 21 Description of possible cumulative impacts 0 17 17 (40.5%) *** 22 Explanation of the method used to evaluate impacts 4 14 18 (42.9%) ** Substitution Is there an attempt to avoid
impacts on natural environments at the beginning of the EIA?
23 Study of alternative solutions 0 4 4 (9.5%) ns
24 Study of the alternative "without project" 1 0 1 (2.4%) ns
Measures Are the measures explained and detailed enough to potentially balance impacts?
25 Detailed description of mitigation measures 6 19 25 (59.5%) ***
26 Distinction between each type of measure 5 15 20 (47.6%) **
27
Use of a method to propose offsets based on
equivalence 0 0 0 (0%) 0
28
Reference to a time lag between losses and future
offsets 0 0 0 (0%) 0
Monitoring and evaluation
Are ways to ensure success and sustainability of measures proposed?
29 Mention of success probability of mitigation measures 0 2 2 (4.8%) ns
30 Scheduling of a monitoring-evaluation programme 1 12 13 (31.0%) ***
31 Definition of indicators for monitoring and evaluation 0 5 5 (11.9%) *
32 Mention of sustainability of the measures 1 1 2 (4.8%) ns ns, not significant; * p < 0.05, ** p < 0.01, *** p < 0.001
Table 1: Criteria used to assess the inclusion of biodiversity in 42 EIA in the Montpellier Metropolitan territory
from 2006 to 2016. Criteria concern six questions that are assessed with a total of 32 indicators. For each indicator, the number of positive responses (i.e. score of 1) before and after June 2012 are recorded and significant differences are tested with a Fisher exact test.
8 Each indicator is noted with a score of 1 or 0, depending on whether the response is positive (inclusion of biodiversity) or negative respectively. The sum of the scores for each indicator was used to examine where and how EIA best integrate biodiversity. To do so, an “Index of Biodiversity Inclusion” (IBI), adapted from Atkinson et al. (2000), was calculated. IBI calculation is based on the number of positive answers (P) relative to the total number (N) of questions (32 for EIA involving offsetting measures, 30 for the others): i.e. IBI = P/N.
Given the binomial nature of the response data, analyses were made using Fisher exact tests and percentages were compared using a nonparametric Wilcoxon test, for several predictor variables of the IBI. The variables we tested concern project size (number of pages in the EIA), the type of natural environment impacted, the involvement of expert naturalists in the EIA, the need for compensation measures and the need for an authorisation to destruct the habitat of protected species. Linear regression analyses were used in the case of quantitative data for some of the indicators (e.g. surface area and number of pages).
We tested whether the adoption of new policy, aimed at reforming the procedure for EIA and the mitigation hierarchy in France, has had an impact on the integration of criteria to more fully assess impacts on biodiversity and measures for conservation within the mitigation hierarchy. This policy came with the law n° 2010-788 published on the 12th July 2010 relative to national commitment for the environment, with the application of the decree n° 2011-2019 of December 2011 and put into force in June 2012. The main changes introduced by this reform concern the need to enlarge the scope of EIA for all projects that may have a significant impact on the environment, the requirement of propositions for measures for implementation within the mitigation hierarchy, an evaluation of cumulative impacts, the necessity of a monitoring plan and the necessity of environmental compliance (Quétier et al., 2014). To examine the effect of this policy we compared IBI for the 21 EIA that were made before June 2012 with the 21 EIA made after this date.
To study the cumulative impact of the 42 development projects in the studied territory, one the recommendations of the policy reform, we examined the spatial distribution of projects and the number of projects that have a moderate, high or very high impact on listed species using GIS software. We also quantified the number of projects that impact on each of the listed species that incur impact in at least one EIA. The identity of the listed species is provided in Appendix 1.
2.3. Attribution of measures to the mitigation hierarchy
Finally, we examined how the 42 EIA propose measures within the mitigation hierarchy relative to definitions for each level of the hierarchy in recent national doctrine (MEDDE, 2012) and guidelines (MEDDE, 2013) proposed by the French Ministry of Ecology. First, avoidance measure are those that supress any impacts ahead of the project development by the abandon of the project, changes in its
9 perimeter or surface area, or the choice of a new site or use of technical solutions. Second, reduction measures involve the implementation of technical solutions to alleviate impacts during construction and exploitation. Third, offset measures aim to maintain or enhance biodiversity features that are impacted by a project. These include ecological restoration and the recreation and management of natural habitats, species communities, and ecological networks and can thus include the reinforcement of natural populations or their reintroduction. Finally, support measures can be proposed to improve the efficiency or to ensure the possible success of biodiversity offset initiatives and include knowledge improvement, methodological development, etc.
We quantified the number of measures proposed within each EIA for each of these four types of measure and re-evaluated and recompiled the number of measures for each of these measures in relation to definitions in the ministry doctrine. Then, we compared the number of measures in each level as proposed by the EIA, with the number of measures reclassified according to ministry definitions and quantified the number of transitions among levels along the hierarchy. In this way, transitions are negative when EIA makes a more ambitious definition of the measure than the ministry definition (e.g. an avoidance measure proposed in the EIA is in reality a reduction measure), and positive if the EIA is more prudent than the official doctrine (e.g. proposed offset measures are in fact measures that reduce impacts and do not compensate residual impacts).
3. Results
3.1. Inclusion of biodiversity criteria in relation to policy reform
IBI ranged between 0.07 and 0.75 with a mean value of 0.38 (Appendix 2), i.e. a positive response was observed for an average of 38% of the indicators per EIA. 14 EIA (33%) had a very low IBI (< 0.2) and 15 EIA (36%) had an index between 0.4 and 0.6. Only six EIA had indexes between 0.2 and 0.4, seven between 0.6 and 0.8 and no EIA had an IBI > 0.8. As a result, more than two thirds of the EIA had either a very low IBI (< 0.2) indicative of very little effort to integrate biodiversity issues or an higher than average IBI of 0.4-0.6. A minority of EIA with a high IBI (>0.6) make a solid effort to take into account biodiversity.
These different groups showed a clear temporal gap in their occurrence (Fig. 2; Appendix 2). We observed a significant increase in values for the IBI after 2010 (Wilcoxon test: w = 29.5, p = 1.54e-6) and after 2012 (w = 303, p = 2.44e-5). EIA conducted before June 2012 had an average IBI of 0.21 and those conducted post-June 2012 had an average IBI of 0.55. The former test should be viewed with caution given the small number (n = 10) of EIA prior to 2010. The criteria that contribute to this increase are mentioned below.
10 Figure 2: Index of biodiversity inclusion (IBI) as a function of EIA submission date and temporal benchmarks for
the EIA reform law n° 2010-788 of July 2010 (dotted line) and the EIA reform decree n° 2011-2019 of December 2011 implemented from June 2012 (dashed line).
The policy reform recommended more consistent naturalist expertise on biodiversity. In our sample we found that the inclusion of expert naturalist advice in a specific section of the EIA represents a major contribution to the IBI (W = 329, p < 0.001), as does the inclusion of a specific section on biodiversity (W = 367, p < 0.001). Naturalist expert advice on the fauna, flora and habitats impacted by a project was present in roughly 50% of the EIA. In 25 EIA (61%) the spatial area of impacts due to the development project was not clearly defined. When the studied area was described as going beyond the current perimeter of the project, the limits were usually defined on the base of land-use borders (roads, field boundary, etc.) or with a buffer zone with an arbitrary width. In none of the EIA there was evidence of an attempt to assess this area on the basis of the knowledge of species present in the zone or the functional characteristics of the local ecosystem. Field studies to provide up-to-date information were made in 37 EIA (90%) but in only 25 (60%) of these were fauna and flora prospected in more than one season (Table 1), even though two seasons are a minimum under the Mediterranean climate due to the marked seasonal contrast that impacts on biodiversity in this region (Thompson, 2005). Nineteen out of 21 EIA (90%) produced after June 2012 involved prospection in more than one season and provide references of databases employed. Most of the studies provided clear information on the databases used to make the EIA and 20 out of 42 (48%) contain scientific references. In all 21 of the EIA conducted after June 2012 a large range of
11 taxonomic groups were analysed, whereas only four of the 21 EIA conducted before June 2012 had such information. Only seven EIA (~20%) took into account impacts on all three scales of biodiversity (ecosystem function, species diversity and genetic variation). Ecological interactions were not included in any of the EIA. In 12 of the 42 EIA (~25%) there were either references to population dynamics or there was a presentation of impacts on “ordinary nature” (species or habitats without a protection status).
Although, according to the EIA proportionality principle1 promulgated in the policy reform, one would expect that a bigger project (in terms of project surface area) would have a better index in terms of biodiversity inclusion because the impact is higher, statistical analyses show that the size of a development project does not lead to a higher IBI. A similar result was observed for the type of naturel environment that is impacted by the project. Semi-natural habitats are represented by six main groups in the study region: woodland, cultivated land, post-cultural fields (semi-open habitat undergoing secondary succession to scrubland and woodland), wetland, garrigues, heathland and thickets. For this study, natural habitat is taken into account if more than ¼ of the study area is concerned. We detected no difference in the IBI for projects impacting these different types of habitats despite the fact that one would expect a project impacting a more “natural” and typical Mediterranean habitat (e.g. garrigues) would have a better index in terms of biodiversity inclusion. Moreover, the larger the part of the EIA dedicated to the natural environment (based on the number of pages in the EIA), the higher the IBI obtained (Linear regression: F = 2.6948, p < 0.001). The significance of impacts was only defined and evaluated in six EIA. In 27 EIA (64%) the nature of the impacts were however detailed as being either direct or indirect and either temporary or permanent. The necessity of an authorisation to destroy protected species and their habitats or the necessity of offsetting significant residual impacts of the project, also contributed significantly to the IBI (W = 178,
p < 0.001 and W = 264, p < 0.001 respectively).
The policy reform specifically identified the need to assess potential impacts at the scale of the ecological network (green infrastructure). We observed a significantly higher number of positive responses after June 2012 for consideration of the ecological network (Table 1). The inclusion of a study of locally and regionally identified areas of ecological continuity in the territory showed that the publication of the law and decree produced a three-fold increase in the inclusion of local continuities and stimulated studies about regional ecological networks (absent from all EIA prior to June 2012). Impacts on the local ecological network were assessed in 21 EIA, 19 of which were
1 Principle that establishes a link between the size or the level of impact, as a justification for the intensity, and
the requirement level of precision needed to assess the environmental impact (European Directive 2014/52/UE).
12 conducted post-June 2012. Impacts at the scale of the regional ecological network were only assessed in seven EIA (20%), all of which were conducted after June 2012.
The new policy also highlighted the need to assess cumulative impacts on biodiversity. Our results show that there has been a dramatic appearance and improvement in terms of taking into account cumulative impacts after June 2012. Prior to this date no EIA performed a study whereas 17 out of 21 EIA (published after this date) clearly mentioned cumulative impacts on biodiversity (Fig. 3).
Figure 3: The number of EIA that include (dark part of histogram) or do not include (white part of histogram) a
reference to cumulative impacts on biodiveristy in relation to publication of the EIA reform law n° 2010-788 of July 2010 (dotted arrow) and the EIA reform decree n° 2011-2019 of december 2011 implemented from June 2012 (dashed arrow).
In Figure 3, it can be seen that in 2012, the three EIA that identified a cumulative impact all occur after June 2012. Basically, cumulative impact assessment involved taking into account projects spatially close to the project under EIA, with an identification of whether individual species are impacted in the neighbouring projects. This assessment can range from a simple expert judgment to a further analysis of impacted species, based on field ecological valuation. Among the 17 EIA which mentioned cumulative impacts, 12 included an assessment of their impacts on listed species, nine detected cumulative impacts due to the project, but only two of these explicitly proposed to take them into account in the mitigation measures. As a result, although projects assessed after 2012 more rigorously described cumulative impacts, there was a lack of proposed action to precisely quantify such impacts and propose adequate measures within the mitigation hierarchy. To examine cumulative impacts on listed species, the two infrastructure projects that cross the territory from
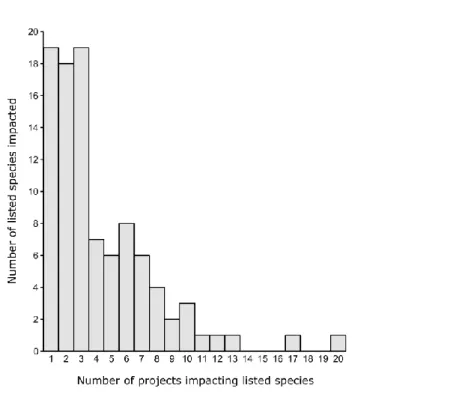
13 East to West were added to the study of cumulative impacts. We found that 19 (20%) species are impacted by a single project (Table 1), 37 species (38 %) are impacted by two to three projects and 41 species (42%) are impacted by more than three projects, with a maximum of 20 projects impacting one species (Fig. 4). The number of projects that impact the study species is clearly underestimated; most EIA (60%) do not refer to cumulative impacts and the older EIA do not propose a complete study of species, natural habitats and ecological functions. Nevertheless, it remains clear from our study that cumulative impacts on listed species are a regular feature of impacts in the studied territory.
Figure 4: Number of listed species impacted as a function of the number of EIA in which an impact is detected.
Finally, the policy reform reiterates the requirement of mitigation measures that include avoidance, reduction and offset measures, highlights the necessity to outline the main practicable substitution solutions and proposes monitoring and evaluation to assess the success of mitigation measures. Only four EIA (10%) studied alternative solutions with criteria on the natural environment and none of the 42 EIA studied alternative solutions “without the project” (Table 1). Socio-economic arguments relating to the need for accommodation or employment and coherence with urban planning documents were the primary reasons used to justify choices made for the project. Mitigation measures were described and distinguished from one another in roughly 50% of the EIA. EIA conducted post-June 2012 were significantly clearer about propositions than pre-June 2012 EIA an important point for the results presented below. For the nine EIA that proposed offset measures,
14 methods based on equivalence between losses and gains were never used and none of the EIA referred to a time lag between destruction and offset measures. Proposals for monitoring and evaluation were provided in only 13 EIA (30%) and in these EIA only one out of three provided ecological indicators with which to evaluate and monitor the benefits of mitigation measures. There is almost no mention about how to assess the success and sustainability of the mitigation measures.
3.2. Attribution of measures to the mitigation hierarchy
For the 42 EIA analysed in this study, a total of 333 measures were proposed for the different elements of the mitigation hierarchy. However, when we compared proposed measures with ministry definitions for these different elements of the mitigation hierarchy, we found that only 40% of the proposed measures fit the definitions of the national guidelines (Fig. 5). Most of the proposed measures for avoidance were in fact measures to reduce impacts (40 out of 47 proposed avoidance measures). The four measures that were truly avoidance measures involved a reduction of the boundary of the project and landscaping. Almost all measures that proposed a reduction in impacts are stable; they fit the national definition for a reduction in the impact. For the 27 proposed offset measures, 11 were in fact measures that reduce impacts, and 15 were correctly defined as offset measures. All in all, measures to reduce impacts were by far the dominant type of proposition in our study area and the majority of EIA did not propose “real” offset measures (only 8 out of 42 EIA propose offset measures). When present, offset measures showed little diversity. The most common measures are linked to a management project to maintain open habitats that favour the presence of Mediterranean listed species.
For supporting measures, there was a major confusion of what such measures really represent. This kind of measure should concern action to improve knowledge (research, experimental project) and methods, to implement a larger-scale conservation strategy, and/or to delimit protected areas, all of which should contribute to improve the effectiveness of offset measures. In fact, as Fig. 5 shows, almost all supporting measures were, in fact, according to ministry definitions, measures that directly relate to a reduction in the impact of the project.
Finally, it should be noted that 34% of all measures proposed in the 42 EIA, were made in absence of a clear statement about what type of measures are being proposed. When we analysed carefully this result, we found that all such measures concerned a reduction in the impact of the project (Fig. 5). There was thus a slight balance in transitions, but with a major bias towards a weakening of the mitigation hierarchy when measures are compared with national guidelines, primarily because avoidance is a less-used measure than what propositions would suggest (Fig. 5).
15 Figure 5: The number of proposed measures (in the 42 EIA) for each category of the mitigation hierarchy (in
left) and how these numbers change (in right) once the proposed measures are reclassified in relation to definitions of the national guidelines following the EIA reform law of 2010 (A- Avoid, R- Reduce, O-Offset, S-Support, M-Monitor, NQ- Not qualified in the proposition).
4. Discussion
Our study reveals a clear improvement in how biodiversity is incorporated within the framework of EIA for development projects during a period of policy reform. However, several important weaknesses persist and there is much confusion around the definition of measures that are proposed to alleviate impacts within the mitigation hierarchy. Hence, a gap between promoting biodiversity in official texts and how biodiversity is integrated into an operational conservation procedure remains.
4.1. Improved but incomplete integration of biodiversity
In this study we have shown an improvement in the inclusion of biodiversity indicators in the framework of EIA for the Montpellier Metropolitan territory that is correlated with the elaboration of new policy in 2010 and its application decree. This policy thus has the potential to provide a legal framework to elaborate a more complete identification of the major stakes associated with biodiversity in the zone where individual development projects are proposed (baseline approach), the impacts on species and their habitats in addition to the ecological networks within which they occur, and the cumulative impacts on biodiversity elements in association with other known projects in the surrounding territory. In fact, this policy has proposed that alternative solutions to the project
16 and its impacts be carefully examined in terms of biodiversity features prior to project development. However, our analysis of 42 EIA reveals that such alternative solutions are rarely explored in the framework of their ecological significance. As a result, avoidance, which is supposedly the first element in the mitigation hierarchy, is rarely employed. This is a critical result because it reveals one reason why “no net loss” is nigh on impossible to achieve because biodiversity conservation occurs in a world where there is a background form of generalised “net loss” (Maron et al., 2016; Moreno-Mateos et al., 2015). This absence of a search for alternative options to avoid impacts and to curtail biodiversity loss in the very early phases of development projects is a clear indication of the need for land-use planning agencies to develop a strategy of anticipation for avoidance as a priority to ensure more efficient biodiversity conservation at a territorial scale, i.e. one that goes well beyond the scale of individual projects (Kujala et al., 2015). As these authors illustrate, the application of a systematic conservation planning approach to the question of avoidance (and also offset proposition) could provide a sound framework for such a strategy based on anticipation.
Although the identification of baseline information on the key environmental stakes in the project area is clearly more completely assessed in EIA since policy reform, there remain several important gaps that are open for improvement. For instance, the definition of the study area (beyond just the area directly impacted by the project) is in most cases still made on an arbitrary basis and the global ecological network and ecosystem levels are rarely considered in the EIA. Moreover, as illustrated elsewhere (Atkinson et al., 2000; Gontier et al., 2006; Regnery et al., 2013a), we found that the main focus remains directed towards listed species and habitats with less interest in common species and habitats. In addition, we have shown that the presence of listed species has a significant positive effect on IBI, i.e. their presence partly conditions the quality of the EIA. The problem here is that common habitats and species play a major role in enhancing biodiversity, particularly by supporting the interaction of listed species (Elliott and Whitfield, 2011; Gaston and Fuller, 2008) and in terms of the loss of ecological services that their destruction may cause. Indeed, recent work illustrates how non-listed species and habitats can be integrated into EIA in a way that recognises both direct and indirect impacts of large-scale projects on such services (Tardieu et al., 2015).
As recommended by the recent reform policy, we found that the identification of cumulative impacts has become a common feature of recent EIA. However, their analysis remains superficial in nearly all of the EIA that refer to cumulative impacts. This is despite our finding that such cumulative impacts are a common feature of the impacts on several listed species in our study territory. Indeed, a critical element of our results is the accumulation of impacts by numerous small and isolated projects that individually may appear to have minor impacts on biodiversity in comparison with large individual projects, but which, when analysed together over a period of 10 years or more, clearly
17 cause major cumulative impacts on listed species. Hence, although we show that cumulative impacts are more frequently considered in the elaboration of an EIA, they are rarely precisely examined and quantified; we found that none of the EIA precisely proposed measures to avoid, reduce or mitigate cumulative impacts. As a result their effects are largely under-estimated. This remains a second major reason why the objective of no net loss is still practically impossible to achieve. The question of how to correctly assess cumulative impacts thus raises several questions for the scientific community working on the efficiency of no net loss and the mitigation hierarchy (Halpern and Fujita, 2013; Kiesecker et al., 2010; Tallis et al., 2015; Whitehead et al., 2016) and in particular the need for a methodology to assess such impacts in order to get out of the “first come, first served” logic that still remains (Quétier et al., 2014).
A final issue that our study raises, concerns the paucity of monitoring and evaluation measures, despite the fact that half of the post-June 2012 EIA provide a schedule for their implementation. This means that there is still a lack of feedback on the true nature and extent of the impacts generated by development projects and the efficiency of mitigation measures. This lack of feedback is a real concern for stakeholders and the scientific community (Briggs and Hudson, 2013; Curran et al., 2014). The development of such feedback - including negative results - could allow local environmental managers to propose more feasible and efficient measures. In reviews of restoration experiments (Benayas et al., 2009; Curran et al., 2014; Maron et al., 2012; Moreno-Mateos et al., 2012), it has been found that biodiversity equivalency between restored areas and reference areas is rarely if ever reached, and that there are major limits to the effectiveness of restoration action as a result of time-lags, uncertainty and the measurability of success. Maron et al., (2012) also argue that restoration action could work and almost attain no net loss only when impacted ecosystem values can be measured, when results about restoration trials already exist to evaluate their feasibility, and when time-lag and uncertainty (ecological risk) are assessed and clarified in the “loss compared to gain” equation. As we show, such issues are seriously underestimated. Results associated with ecological restoration or eco-engineering actions should thus be examined with much caution (Benayas et al., 2009; Curran et al., 2014; Maron et al., 2012; Moreno-Mateos et al., 2012; Palmer and Filoso, 2009) and a wider use of avoidance and reduction measures is a necessity that can no longer be brushed under the carpet.
4.2. Mitigation measures: blurred semantics
The reform policy we examine is also associated with a clarification of the nature of the different measures proposed in an EIA for the mitigation hierarchy (avoid, reduce or offset) and the modalities of monitoring and evaluation of these measures. Our study reveals critical gaps in terms of both incorporating a functional and wider-scale approach to biodiversity integration in land-use planning
18 and how actors understand the true meaning of the different elements of the mitigation hierarchy. Bull et al. (2016) previously identified this kind of ambiguity and the lack of clarity concerning the concept of biodiversity offsets in relation to no net loss objectives. Our study confirms this issue and provides a quantification of the types of confusion concerning the mitigation hierarchy steps at the EIA level.
For the 42 projects we studied, 60% of the proposed measures are not correctly described in terms of their place in the mitigation hierarchy and, after reclassification by comparison with the national guidelines in the reform doctrine, it turns out that almost 90% of all measures concern a reduction of impacts. So, despite the fact that the mitigation hierarchy provides a framework for the elaboration of alternative solutions depending on project context and impacts, in practice, a reduction in impact is by far the most common measure. However, this represents the second “step” in the mitigation hierarchy, and as discussed above in relation to the search for alternative solutions, avoidance is rarely proposed.
The semantic confusion in the definitions of avoidance, reduction and offset measures can be explained by a lack of understanding of national guidelines and definitions. For instance, the 40 reduction measures proposed in EIA as avoidance (Fig. 5) do not supress any impacts of natural environment features, they simply minimize impacts. For example, propositions for avoidance founded in an EIA could be the “adaptation of the construction schedule to impacted species” or the “maintenance of ecological network features in the impacted site”. These two measures are proposed as avoidance measures in the EIA but they only limit the impacts on biodiversity and do not avoid or supress the impacts. Only a change in the project perimeter or its reduction so as not to impact the identified species or features of the ecological network would represent avoidance measures. In a similar way, “nesting box installation in the development project site” or “plantation of native flora species for the green areas of the project” are proposed in EIA as biodiversity offset measures, but in fact, such measures attenuate (reduce) the impact of the project in the long run. For avoidance to become a reality, stakeholders should thus be questioned in their routine practices. The existing confusion in the correct identification of proposed measures should be addressed to prevent uninformed discussions among stakeholders (decision-makers, developers, architects, regulators, naturalist experts). This issue could be resolved via the formation of consulting agencies that elaborate EIA, developers and regulators and explanation of what different measures actually are in terms of the mitigation hierarchy. Enhancement of regulatory agency control, through standardisation of methods, could also limit this problem. Such options could help homogenize and reduce misunderstanding among stakeholders, optimize decision-making quality in terms of biodiversity conservation, and reinforce the IBI level of EIA.
19 Another reason for the relative absence of true avoidance measures could be the fact that the project boundaries and global form are decided and fixed prior to the elaboration of the EIA. For true avoidance measures to be proposed, developers and experts should be in contact at the very beginning of the project conception in order for any changes in the project form that are necessary to avoid impacts to be made. Hence, a real anticipation of where and what to avoid remains a critical step towards organizing mitigation measures in a way that the hierarchy may become more efficient in terms of biodiversity conservation and no net loss target (Kareksela et al., 2013; Kujala et al., 2015; McKenney and Kiesecker, 2010; Regnery et al., 2013b; Whitehead et al., 2016).
In addition, the proposition of mitigation measures and eco-engineering projects in an EIA does not fully ensure the practical implementation and success of measures in the field, especially during the construction and operation phases. This point underlines the necessity of monitoring measures that are not always well defined. These measures support the implementation and exploitation phases of the development project and must be greatly improved to ensure a positive effect on biodiversity conservation.
Finally, in the scientific literature on mitigation there is a rapidly growing literature on biodiversity offsets (Calvet et al., 2015b). In our sample of many small projects, less than 25% of EIA propose offsetting measures, most propositions are in fact reduction measures. Indeed, by definition, offsetting measures should be a last resort solution, with more emphasis and an accurate focus on avoidance and reduction measures. Otherwise no net loss will remain a lost cause.
4.3. A gap between official texts and EIA in practice
The gap between official texts and EIA in practice can also be seen through the biodiversity approach taken in EIA. Gontier et al., (2006) proposed three scales of approach in order to characterize how biodiversity is taken into account in EIA: (i) a patch by patch approach that focuses on single sites or a single biodiversity element with no general overview, (ii) a more functional and dynamic ecosystem level approach and (iii) a habitat suitability approach that focuses on specific biodiversity components or processes. The reform doctrine and national guidelines, established in the framework of the policy reform in France, recommend the adoption of an approach in which biodiversity and the natural environment represent “natural habitats, animal and vegetal species,
ecological continuities, biological balance, ecological functions, physical and biological features that are the support of former elements and services provided by ecosystems” (MEDDE, 2012). This is in
marked contrast with the approach adopted prior to the policy reform in which EIA were traditionally based on a patchwork approach focused almost entirely on listed species and habitats. The approach adopted in the post-June 2012 EIA is somewhere between a patchwork and habitat suitability approach, with recommendations for the inclusion of criteria to assess impacts on ecological
20 connectivity and cumulative impacts. However, despite the evolution of such guidelines and their ambitions, they remain distinct and separate from practice. The gap between EIA commitment and practice thus persists. This result highlights the dilemma discussed by Calvet et al. (2015a) in which the higher the level of observation of ecological complexity in a system, the more difficult it is to achieve ecological equivalency and no net loss.
5. Conclusion: pertinence and necessity of a territorial-scale analysis
Our study of a large number of projects in a single area illustrates the pertinence of a territorial-scale assessment of impacts on biodiversity in order to assess action within the mitigation hierarchy that may efficiently contribute to a no net loss objective. At the present time a correct assessment of cumulative impacts is completely absent from land-use planning at the scale on which they occur, i.e. a given territory or region. Our capacity to detect changes in how ecological networks are addressed and the major role that cumulative impacts of small projects may have on biodiversity are critical to this issue. The development of a territorial strategy that shifts from an approach based on treating “symptoms” at the scale of individual projects (e.g. proposing offsets) to a more preventive approach focused on the avoidance of biodiversity loss and mitigation of cumulative impacts is now necessary. The territorial scale represents a pertinent scale on which to develop such a strategic approach that anticipates for avoidance in order to render mitigation measures a true hierarchy based on priorities.
Acknowledgements
We thank the DREAL Occitanie for access to their archives and staff at the Montpellier
Mediterranée Métropole for providing advice and for their confidence. We thank Perrine Gauthier for
comments on a preliminary version of the manuscript and Guillaume Papuga for his help and encouragement. This work was carried out with a PhD grant awarded to Charlotte Bigard from the National Association for Research and Technology (ANRT) and funded by the Ministry for Higher Education and Research and Montpellier Mediterranée Métropole.
21 References
Apostolopoulou, E., Adams, W.M., 2015. Biodiversity offsetting and conservation: reframing nature to save it. Oryx 1–9.
Aronson, J., Moreno-Mateos, D., 2015. État des lieux sur les actions de restauration écologique, in: Restaurer La Nature Pour Atténuer Les Impacts Du Développement. Quae, pp. 162–170. Atkinson, S.F., Bhatia, S., Schoolmaster, F.A., Waller, W.T., 2000. Treatment of biodiversity impacts in
a sample of US environmental impact statements. Impact Assess. Proj. Apprais. 18, 271–282. Benayas, J.M.R., Newton, A.C., Diaz, A., Bullock, J.M., 2009. Enhancement of Biodiversity and
Ecosystem Services by Ecological Restoration: A Meta-Analysis. Science 325, 1121–1124. doi:10.1126/science.1172460
Bonthoux, D., Branger, M., Dias, P., Kessler, M., Thoyer, S., Pariente, A., 2015. Note de synthèse bibliographique - Notions « d’intérêt public majeur » et «d’absence de solution alternative de moindre impact » dans le cadre de la séquence Eviter - Réduire - Compenser. SupAgro - DREAL LR.
Briggs, S., Hudson, M.D., 2013. Determination of significance in ecological impact assessment: past change, current practice and future improvements. Environ. Impact Assess. Rev. 38, 16–25. Bull, J.W., Gordon, A., Law, E.A., Suttle, K.B., Milner-Gulland, E., 2014. Importance of baseline
specification in evaluating conservation interventions and achieving no net loss of biodiversity. Conserv. Biol. 28, 799–809.
Bull, J.W., Gordon, A., Watson, J.E.M., Maron, M., 2016. Seeking convergence on the key concepts in “no net loss” policy. J. Appl. Ecol. 53, 1686–1693. doi:10.1111/1365-2664.12726
Byron, H.J., Treweek, J.R., Sheate, W.R., Thompson, S., 2000. Road developments in the UK: an analysis of ecological assessment in environmental impact statements produced between 1993 and 1997. J. Environ. Plan. Manag. 43, 71–97.
Calvet, C., Napoléone, C., Salles, J.-M., 2015a. The Biodiversity Offsetting Dilemma: Between Economic Rationales and Ecological Dynamics. Sustainability 7, 7357–7378.
Calvet, C., Ollivier, G., Napoléone, C., 2015b. Tracking the origins and development of biodiversity offsetting in academic research and its implications for conservation: A review. Biol. Conserv. 192, 492–503. doi:10.1016/j.biocon.2015.08.036
Curran, M., Hellweg, S., Beck, J., 2014. Is there any empirical support for biodiversity offset policy? Ecol. Appl. 24, 617–632. doi:10.1890/13-0243.1
Drayson, K., Wood, G., Thompson, S., 2015. Assessing the quality of the ecological component of English Environmental Statements. J. Environ. Manage. 160, 241–253.
Elliott, M., Whitfield, A.K., 2011. Challenging paradigms in estuarine ecology and management. Estuar. Coast. Shelf Sci. 94, 306–314. doi:10.1016/j.ecss.2011.06.016
Fahrig, L., 2003. Effects of habitat fragmentation on biodiversity. Annu. Rev. Ecol. Evol. Syst. 487–515. Gardner, T.A., HASE, A., Brownlie, S., Ekstrom, J.M., Pilgrim, J.D., Savy, C.E., Stephens, R.T., Treweek, J.O., Ussher, G.T., Ward, G., others, 2013. Biodiversity offsets and the challenge of achieving no net loss. Conserv. Biol. 27, 1254–1264.
Gaston, K.J., Fuller, R.A., 2008. Commonness, population depletion and conservation biology. Trends Ecol. Evol. 23, 14–19.
Geneletti, D., 2006. Some common shortcomings in the treatment of impacts of linear infrastructures on natural habitat. Environ. Impact Assess. Rev. 26, 257–267.
Gobert, J., 2015. Mesures compensatoires socio-environnementales et acceptation sociale, in: Restaurer La Nature Pour Atténuer Les Impacts Du Développement. Quae, pp. 34–45.
Gontier, M., Balfors, B., Mörtberg, U., 2006. Biodiversity in environmental assessment—current practice and tools for prediction. Environ. Impact Assess. Rev. 26, 268–286.
Gordon, A., Bull, J.W., Wilcox, C., Maron, M., 2015. Perverse incentives risk undermining biodiversity offset policies. J. Appl. Ecol. 52, 532–537.
22 Habib, T.J., Farr, D.R., Schneider, R.R., Boutin, S., 2013. Economic and ecological outcomes of flexible
biodiversity offset systems. Conserv. Biol. 27, 1313–1323.
Halpern, B.S., Fujita, R., 2013. Assumptions, challenges, and future directions in cumulative impact analysis. Ecosphere 4, 1–11.
Hassan, F., Levrel, H., Scemama, P., Vaissière, A.-C., 2015. Le cadre de gouvernance américain des mesures compensatoires pour les zones humides, in: Restaurer La Nature Pour Atténuer Les Impacts Du Développement. Quae, pp. 45–58.
Jacob, C., Quétier, F., Aronson, J., Pioch, S., Levrel, H., 2015. Vers une politique française de compensation des impacts sur la biodiversité plus efficace : défis et perspectives. VertigO - Rev. Électronique En Sci. Environ. doi:10.4000/vertigo.15385
Kareksela, S., Moilanen, A., Tuominen, S., Kotiaho, J.S., 2013. Use of Inverse Spatial Conservation Prioritization to Avoid Biological Diversity Loss Outside Protected Areas. Conserv. Biol. 27, 1294–1303. doi:10.1111/cobi.12146
Khera, N., Kumar, A., 2010. Inclusion of biodiversity in environmental impact assessments (EIA): a case study of selected EIA reports in India. Impact Assess. Proj. Apprais. 28, 189–200.
Kiesecker, J., Copeland, H., Pocewicz, A., McKenney, B., 2010. Development by design: blending landscape-level planning with the mitigation hierarchy. Front. Ecol. Environ. 8, 261–266. Kujala, H., Whitehead, A.L., Morris, W.K., Wintle, B.A., 2015. Towards strategic offsetting of
biodiversity loss using spatial prioritization concepts and tools: a case study on mining impacts in Australia. Biol. Conserv. 192, 513–521.
Levrel, H., Frascaria-Lacoste, N., Hay, J., Martin, G., Pioch, S., 2015. Restaurer la nature pour atténuer les impacts du développement: Analyse des mesures compensatoires pour la biodiversité. Editions Quae.
Lucas, M., 2009. La compensation environnementale, un mécanisme inefficace à améliorer. Rev. Jurid. Environ. 34, 59–68.
Mandelik, Y., Dayan, T., Feitelson, E., 2005. Planning for biodiversity: the role of ecological impact assessment. Conserv. Biol. 19, 1254–1261.
Maron, M., Bull, J.W., Evans, M.C., Gordon, A., 2015. Locking in loss: Baselines of decline in Australian biodiversity offset policies. Biol. Conserv. 192, 504–512.
Maron, M., Hobbs, R.J., Moilanen, A., Matthews, J.W., Christie, K., Gardner, T.A., Keith, D.A., Lindenmayer, D.B., McAlpine, C.A., 2012. Faustian bargains? Restoration realities in the context of biodiversity offset policies. Biol. Conserv. 155, 141–148.
Maron, M., Ives, C.D., Kujala, H., Bull, J.W., Maseyk, F.J., Bekessy, S., Gordon, A., Watson, J.E., Lentini, P.E., Gibbons, P., others, 2016. Taming a Wicked Problem: Resolving Controversies in Biodiversity Offsetting. BioScience. doi:10.1093/biosci/biw038
Martin, G.J., 2015. Fonctions du droit et mesures compensatoires françaises, in: Restaurer La Nature Pour Atténuer Les Impacts Du Développement. Quae, pp. 16–25.
McKenney, B.A., Kiesecker, J.M., 2010. Policy development for biodiversity offsets: a review of offset frameworks. Environ. Manage. 45, 165–176.
McKinney, M.L., 2008. Effects of urbanization on species richness: A review of plants and animals. Urban Ecosyst. 11, 161–176. doi:10.1007/s11252-007-0045-4
MEA [Millenium Environmental Assessment], 2005. Current state and trends. Global Assessment Reports. Volume 1., Island Press. Washington, USA.
MEDDE [Ministère de l'Environnement, du Développement Durable et de l'Energie], 2013. Lignes directrices nationales sur la séquence éviter, réduire et compenser les impacts sur les milieux naturels (RéférenceS). Ministère de l’écologie, du développement durable, des transports et du logement, Paris, France.
MEDDE [Ministère de l'Environnement, du Développement Durable et de l'Energie], 2012. Doctrine relative à la séquence éviter, réduire et compenser les impacts sur le milieu naturel. Ministère de l’écologie, du développement durable, des transports et du logement, Paris, France.
23 Moreno-Mateos, D., Maris, V., Béchet, A., Curran, M., 2015. The true loss caused by biodiversity
offsets. Biol. Conserv. 192, 552–559.
Moreno-Mateos, D., Power, M.E., Comín, F.A., Yockteng, R., 2012. Structural and functional loss in restored wetland ecosystems. PLoS Biol 10. doi:10.1371/journal.pbio.1001247
Morgan, R.K., 2012. Environmental impact assessment: the state of the art. Impact Assess. Proj. Apprais. 30, 5–14.
Palmer, M.A., Filoso, S., 2009. Restoration of ecosystem services for environmental markets. Science 325, 575–576.
Quétier, F., Regnery, B., Levrel, H., 2014. No net loss of biodiversity or paper offsets? A critical review of the French no net loss policy. Environ. Sci. Policy 38, 120–131.
Regnery, B., Couvet, D., Kerbiriou, C., 2013a. Offsets and Conservation of the Species of the EU Habitats and Birds Directives. Conserv. Biol. 27, 1335–1343.
Regnery, B., Quétier, F., Cozannet, N., Gaucherand, S., Laroche, A., Burylo, M., Couvet, D., Kerbiriou, C., 2013b. Mesures compensatoires pour la biodiversité : comment améliorer les dossiers environnementaux et la gouvernance ? Sci. Eaux Territ. Hors-série numéro 12, 1–8.
Samarakoon, M., Rowan, J.S., 2008. A critical review of environmental impact statements in Sri Lanka with particular reference to ecological impact assessment. Environ. Manage. 41, 441–460. Tallis, H., Kennedy, C.M., Ruckelshaus, M., Goldstein, J., Kiesecker, J.M., 2015. Mitigation for one &
all: An integrated framework for mitigation of development impacts on biodiversity and ecosystem services. Environ. Impact Assess. Rev. 55, 21–34.
Tardieu, L., Roussel, S., Thompson, J.D., Labarraque, D., Salles, J.-M., 2015. Combining direct and indirect impacts to assess ecosystem service loss due to infrastructure construction. J. Environ. Manage. 152, 145–157.
Thompson, J.D., 2005. Plant evolution in the Mediterranean. Oxford University Press on Demand. Thompson, S., Treweek, J.R., Thurling, D.J., 1997. The ecological component of environmental impact
assessment: a critical review of British environmental statements. J. Environ. Plan. Manag. 40, 157–172.
Treweek, J., Thompson, S., 1997. A review of ecological mitigation measures in UK environmental statements with respect to sustainable development. Int. J. Sustain. Dev. World Ecol. 4, 40– 50.
Whitehead, A.L., Kujala, H., Wintle, B.A., 2016. Dealing with cumulative biodiversity impacts in strategic environmental assessment: A new frontier for conservation planning. Conserv. Lett. 1–10. doi:10.1111/conl.12260
24 Appendix 1: Listed species that are impacted in the studied EIA
Latin name Group
1. Upupa epops avifauna
2. Malpolon monspessulanus reptile
3. Chalcides striatus reptile
4. Miniopterus schreibersii mammal
5. Pipistrellus pygmaeus mammal
6. Timon lepidus reptile
7. Rhinechis scalaris reptile
8. Otus scops avifauna
9. Clamator glandarius avifauna
10. Lacerta bilineata reptile
11. Circaetus gallicus avifauna
12. Burhinus oedicnemus avifauna
13. Lullula arborea avifauna
14. Pipistrellus kuhlii mammal
15. Nyctalus leisleri mammal
16. Rhinolophus ferrumequinum mammal
17. Coracias garrulus avifauna
18. Emberiza calandra avifauna
19. Pipistrellus nathusii mammal
20. Myotis blythii mammal
21. Erinaceus europaeus mammal
22. Psammodromus hispanicus reptile
23. Psammodromus algirus reptile
24. Milvus migrans avifauna
25. Anthus campestris avifauna
26. Podarcis muralis reptile
27. Hyla meridionalis amphibien
28. Tarentola mauritanica reptile
29. Pipistrellus pipistrellus mammal
30. Falco naumanni avifauna
31. Carduelis cannabina avifauna
32. Merops apiaster avifauna
33. Athene noctua avifauna
34. Phoenicurus phoenicurus avifauna
35. Saga pedo insect
36. Lanius senator avifauna
37. Pelodytes punctatus amphibien
38. Caprimulgus europaeus avifauna
39. Sciurus vulgaris mammal
40. Zerynthia polyxena insect
41. Zerynthia rumina insect
42. Cerambyx cerdo insect
43. Tetrax tetrax avifauna
44. Burhinus oedicnemus avifauna
45. Gelochelidon nilotica avifauna
46. Coenagrion mercuriale insect
47. Galerida cristata avifauna
48. Muscicapa striata avifauna
49. Anthus pratensis avifauna
25
51. Natrix maura reptile
52. Strix aluco avifauna
53. Passer montanus avifauna
54. Sylvia melanocephala avifauna
55. Saxicola rubicola avifauna
56. Hypsugo savii mammal
57. Plecotus austriacus mammal
58. Tadarida teniotis mammal
59. Myotis capaccinii mammal
60. Rhinolophus hipposideros mammal
61. Oxygastra curtisii insect
62. Lanius meridionalis avifauna
63. Pelophylax perezi amphibien
64. Bubulcus ibis avifauna
65. Egretta garzetta avifauna
66. Tyto alba avifauna
67. Circus pygargus avifauna
68. Saxicola rubetra avifauna
69. Sylvia cantillans avifauna
70. Lissotriton helveticus amphibien
71. Anguis fragilis reptile
72. Allium chamaemoly plant
73. Myotis myotis mammal
74. Myotis emarginatus mammal
75. Roeseliana azami insect
76. Arcyptera brevipennis vicheti insect
77. Macromia splendens insect
78. Anemone coronaria plant
79. Gagea granatelli plant
80. Emys orbicularis reptile
81. Emberiza hortulana avifauna
82. Tachybaptus ruficollis avifauna
83. Oenanthe oenanthe avifauna
84. Sylvia hortensis avifauna
85. Ischnura pumilio insect
86. Leucojum aestivum plant
87. Castor fiber mammal
88. Euphydryas aurinia insect
89. Lycosa tarantula insect
90. Uroctea durandi insect
91. Zygaena rhadamanthus insect
92. Satyrium w-album insect
93. Gomphus graslinii insect
94. Mentha cervina plant
95. Tulipa sylvestris plant
96. Astragalus glaux plant
26 Appendix 2: Details of EIA published pre-June 2012 (n=21) and post- June 2012 (n=21) with their overall IBI
based on the relative number of positive (P) and negative (N) responses to the different criteria (n=30 or 32 depending on whether offset measures are necessary).
Pre-June 2012 Post-June 2012
Project IBI P N Project IBI P N
Pre_1 0.2 6 24 Post_1 0.75 26 6 Pre_2 0.23 7 23 Post_2 0.57 17 13 Pre_3 0.23 7 23 Post_3 0.37 11 19 Pre_4 0.5 15 15 Post_4 0.63 20 12 Pre_5 0.27 8 22 Post_5 0.75 24 8 Pre_6 0.4 12 18 Post_6 0.6 18 12 Pre_7 0.63 19 11 Post_7 0.73 22 8 Pre_8 0.13 4 26 Post_8 0.58 18 14 Pre_9 0.1 3 27 Post_9 0.5 15 15 Pre_10 0.07 2 28 Post_10 0.56 18 14 Pre_11 0.47 14 16 Post_11 0.43 13 17 Pre_12 0.07 2 28 Post_12 0.59 19 13 Pre_13 0.07 2 28 Post_13 0.44 14 18 Pre_14 0.13 4 26 Post_14 0.5 15 15 Pre_15 0.07 2 28 Post_15 0.69 22 10 Pre_16 0.07 2 28 Post_16 0.33 10 20 Pre_17 0.13 4 26 Post_17 0.53 17 15 Pre_18 0.07 2 28 Post_18 0.5 15 15 Pre_19 0.17 5 25 Post_19 0.47 14 16 Pre_20 0.17 5 25 Post_20 0.5 15 15 Pre_21 0.2 6 24 Post_21 0.63 19 11 Mean 0.21 6.24 23.76 0.55 17.24 13.62