RESEARCH OUTPUTS / RÉSULTATS DE RECHERCHE
Author(s) - Auteur(s) :
Publication date - Date de publication :
Permanent link - Permalien :
Rights / License - Licence de droit d’auteur :
Bibliothèque Universitaire Moretus Plantin
Institutional Repository - Research Portal
Dépôt Institutionnel - Portail de la Recherche
researchportal.unamur.be
University of Namur
ViDaX: an interactive semantic data visualisation and exploration tool
Dumas, Bruno; Broché, Tim; Hoste, Lode; Signer, Beat
Published in:
Proceedings of the International Working Conference on Advanced Visual Interfaces (AVI '12)
DOI:
10.1145/2254556.2254702
Publication date:
2012
Document Version
Peer reviewed version
Link to publication
Citation for pulished version (HARVARD):
Dumas, B, Broché, T, Hoste, L & Signer, B 2012, ViDaX: an interactive semantic data visualisation and
exploration tool. in Proceedings of the International Working Conference on Advanced Visual Interfaces (AVI
'12). ACM Press, pp. 757-760. https://doi.org/10.1145/2254556.2254702
General rights
Copyright and moral rights for the publications made accessible in the public portal are retained by the authors and/or other copyright owners and it is a condition of accessing publications that users recognise and abide by the legal requirements associated with these rights. • Users may download and print one copy of any publication from the public portal for the purpose of private study or research. • You may not further distribute the material or use it for any profit-making activity or commercial gain
• You may freely distribute the URL identifying the publication in the public portal ?
Take down policy
If you believe that this document breaches copyright please contact us providing details, and we will remove access to the work immediately and investigate your claim.
ViDaX: An Interactive Semantic Data Visualisation and
Exploration Tool
Bruno Dumas, Tim Broché, Lode Hoste and Beat Signer
Web & Information Systems Engineering Lab Vrije Universiteit Brussel
Pleinlaan 2, 1050 Brussels, Belgium
{bdumas,tbroche,lhoste,bsigner}@vub.ac.be
ABSTRACT
We present the Visual Data Explorer (ViDaX), a tool for visualising and exploring large RDF data sets. ViDaX enables the extraction of information from RDF data sources and offers functionality for the analysis of various data characteristics as well as the exploration of the corresponding ontology graph structure. In addition to some ba-sic data mining features, our interactive semantic data visualisation and exploration tool offers various types of visualisations based on the type of data. In contrast to existing semantic data visualisation solutions, ViDaX also offers non-expert users the possibility to ex-plore semantic data based on powerful automatic visualisation and interaction techniques without the need for any low-level program-ming. To illustrate some of ViDaX’s functionality, we present a use case based on semantic data retrieved from DBpedia, a semantic version of the well-known Wikipedia online encyclopedia, which forms a major component of the emerging linked data initiative.
Keywords
Information visualisation, visual data exploration, data mining, RDF
Categories and Subject Descriptors
H.5.2 [Information Interfaces and Presentation]: User Interfaces
General Terms
Human Factors
1.
INTRODUCTION
“A picture is worth a thousand words”—this well-known saying could be transformed into today’s hyper-connected online world as “A visualisation is worth a thousand pieces of information”. The appropriate visualisation of information indeed helps to explore the large amount of new data that is produced daily by humanity. Of special interest are interactive visualisations which allow users to explore data in an interactive manner by selecting specific parts of a data source as well as reconfiguring, encoding, abstracting or filtering the data [11].
Permission to make digital or hard copies of all or part of this work for personal or classroom use is granted without fee provided that copies are not made or distributed for profit or commercial advantage and that copies bear this notice and the full citation on the first page. To copy otherwise, to republish, to post on servers or to redistribute to lists, requires prior specific permission and/or a fee.
AVI’12, May 21-25, 2012, Capri Island, Italy
Copyright 2012 ACM 978-1-4503-1287-5/12/05 ...$10.00.
Until now, information visualisation has been mainly confined to professional circles. Most existing visualisation tools assume that their users have some programming knowledge such as in the case of the Processing [10] and R [7] programming languages as well as the Prefuse [4] visualisation tool or they target a professional audi-ence like the Tableau [8] data visualisation solution. At the same time, more and more semantic data is available on the Web, which often results in some forms of information overload. Innovative information visualisation should therefore not only address profes-sionals but also offer new tools for the visualisation and exploration of these semantic data sets to non-expert users.
We present ViDaX, an interactive semantic data visualisation and exploration tool for non-expert users. We decided to focus on the exploration and visualisation of data described via the Resource Description Framework (RDF)1 due to its widespread use on the Web. Our use case is based on the DBpedia2 data source and the user can select from different Web Ontology Language (OWL)3
classes. ViDaX analyses the data and automatically creates the rel-evant visualisations. In a subsequent step, the user has the pos-sibility to refine or correct some of the automatic settings, select different dimensions and adapt the visualisation. We start with a presentation of some related work in Section 2. In Section 3, we introduce the ViDaX visual data explorer and describe the architec-ture of our solution. After presenting a number of ViDaX visuali-sations of DBpedia data, some concluding remarks and comments about future work are given in Section 4.
2.
BACKGROUND
The Resource Description Framework (RDF) has been defined by the W3C consortium as a standard model for semantic data rep-resentation and interchange on the Web. RDF is widely used for the modelling of information in the context of the Semantic Web. The Web Ontology Language (OWL) builds on RDF to represent knowledge about things and relationships between these things. Ontologies in OWL exist for example for biological processes, ge-ographic information or chemical processes. Numerous sources of rich RDF data sources are nowadays available on the Web, includ-ing the DBpedia project which we investigate in our use case. The DBpedia project aims at providing the information that is avail-able in infoboxes forming part of single Wikipedia pages as a uni-form semantic dataset. Note that to explore the data present in the DBpedia database, a facetted browser is available from the DBpedia website4. 1http://www.w3.org/RDF/ 2http://dbpedia.org 3 http://www.w3.org/OWL/ 4 http://dbpedia.neofonie.de/browse/
The visualisation of RDF data has already been explored by vari-ous authors including Frasincar et al. [3] or Mutton et al. [9]. These solutions focus on exploring the structure of RDF data in the form of graph visualisations. The graph visualisations display the struc-ture of relationships between classes as well as their properties. The aim of these projects was to ease the navigation and exploration of RDF-based structures. Similar projects are available for DBpedia, including gFacet [5] or OpenLink Virtuoso [6]. However, in these projects the RDF data has not been exploited beyond the visualisa-tion of property values.
Cammarano et al. [1] as well as Chan et al. [2] went beyond mere RDF data visualisation and explored possibilities to visualise the actual data. They offer a complement to available sources such as Wikipedia and reduce the information overload when consider-ing data from these sources. The research track explored by these researchers is mainly positioned in the mashup of RDF and visu-alisation techniques. Cammarano et al. [1] integrated automatic search within a visualisation pipeline, but user intervention is still important in their solution. Vispedia, the project described by Chan et al. [2], focusses on visualising tables from Wikipedia pages and makes use of ontologies to suggest the dimensions to be visualised. We intend to go a step further than these two projects by offering some basic automatic data mining functionality as well as advanced visualisation and interaction in an integrated tool.
3.
RDF DATA VISUALISATION
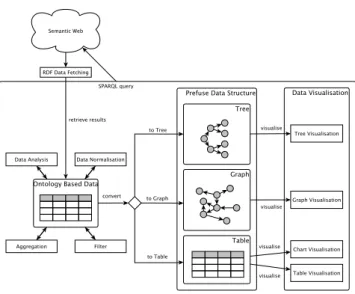
In this section we present ViDaX, our automatic Java visuali-sation tool for RDF data. The overall architecture of the ViDaX tool is shown in Figure 1. As highlighted in this figure, seman-tic web data sources are queried with help of the SPARQL5query language for RDF and the semantic data is fetched and stored in a local database. This database with the cached semantic data has two goals. First, since some semantic data sources on the Web can be quite large, the local caching of these data sources during a ses-sion helps to significantly increase the performance. Second, the data passes the data normalisation and analysis phases, which are applied only once per session due to the local caching mechanism. The data analysis and normalisation phases are applied in order to prepare the data before visualising. The data analysis phase ex-tracts the types of the different properties of an RDF resources in order to define the relevant visualisation properties. The data nor-malisation phase processes and cleans the analysed data. These two phases are used to extract the necessary features in order that the data can be properly visualised with minimal user intervention. In a subsequent step some aggregate and filter operations are ap-plied to the local database cache based on the current choice of visualisation. Certain visualisation techniques will require specific operations to be applied. For example, when zooming out on a map, elements too close to each other are aggregated. As another example, a visualisation of the population of Spanish cities filters data from non-Spanish countries.
The visualisation techniques used in ViDaX are based on the Prefuse [4] visualisation toolkit. Prefuse is a Java GUI toolkit tar-geting to offer a range of classic visualisation techniques. In ad-dition, Prefuse supports multiple interaction techniques which are linked to the different visualisations. However, Prefuse focusses on the view component of the Model-View-Controller (MVC) model which means that data must be carefully prepared before it can be processed by the toolkit. Furthermore, a developer using Prefuse is also in charge of the controller component. Nevertheless, the use of the Prefuse visualisation toolkit made perfect sense for the
im-5
http://www.w3.org/TR/rdf-sparql-query/
Figure 1: ViDaX architecture
plementation of our automatic visualisation tool for RDF data since ViDaX has the goal to fetch and prepare Semantic Web data before feeding it to a visualisation toolkit.
When launching ViDaX, the user is first offered a choice of exist-ing predefined online RDF sources. In addition, the user is offered the possibility to access arbitrary data sources by providing a spe-cific URL. Among the predefined sources, we used DBpedia as our main use case. As presented in the background section, DBpedia is a project aiming to provide the information of Wikipedia’s in-foboxes as a uniform semantic dataset. However, even if only data from infoboxes is considered, the heterogeneity of data is still an issue. For a given class, the representation of the data stored in properties can be quite heterogeneous due to the fact that different units are used or data is missing. DBpedia is a good use case for the kind of difficulties that one can encounter when dealing with semantic data sources on the Web. Of course, ViDaX cannot do much when data is missing and RDF instances with missing in-formation are simply not considered for a particular visualisation session. However, if the dropped instance contains relevant data at a later time during the session, it will be reconsidered. In the case that multiple units of measurement have been used, ViDaX tries to normalise the data to the most common unit. Finally, if the data representation differs from one piece of data to another, the tool tries to normalise everything and drops pieces of data which cannot be normalised.
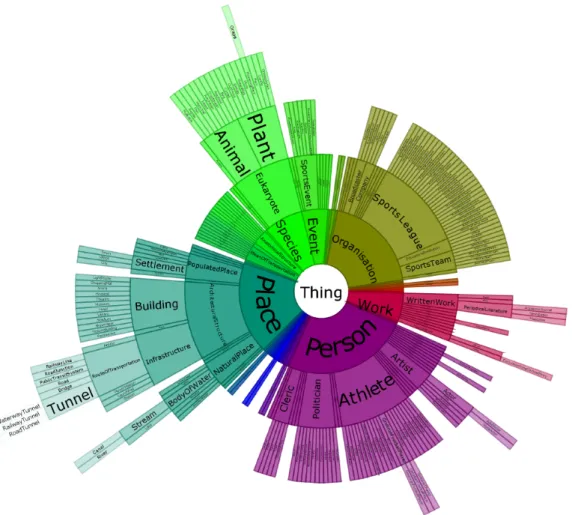
After the fetching, initial analysis and normalisation phases, the set of all OWL classes present in the selected RDF data source is displayed to the user. We experimented with different visualisa-tions including tree and graph representavisualisa-tions. Finally, we decided to use the radial tree representation which is shown in Figure 2 for the DBpedia dataset. In this visualisation, the Thing class forms the root of all other classes with subclasses directly springing from the class they inherit from. For example, the Person class has the subclasses Artist, Athlet, Politician or Cleric. The Politician class then has Mayor, Deputy, Senator or Congressmanas direct subclasses.
When clicking on a particular class, a panel on the left lists all the properties of the selected class. For example, for the Person class, these properties include the birthDate, birthPlace, birthYear, deathDate, country, gender and some more properties. A user can then select the properties they want to vi-sualise. The number of properties which can be selected depends
Figure 2: Radial tree visualisation of all DBpedia OWL classes
of the chosen type of visualisation. The tool engine extracts the types of the different properties and maps them to the supertypes Size, Enum, Graph, Time, Location and Label. Figure ?? shows the relation between the properties extracted from the OWL ontology description, the mapped supertypes and the suggested vi-sualisations. Based on these supertypes, the appropriate visualisa-tion templates are proposed to the user. ViDaX maps the different dimensions to coordinates, the x-y axes, colours, sizes or shapes.
OWL Description Property Types Supertypes Visualisations
<owl:ObjectProperty rdf:ID="lens"> <rdfs:subPropertyOf rdf:resource="#part"/> <rdfs:domain rdf:resource="#Camera"/> <rdfs:range rdf:resource="#Lens"/> </owl:ObjectProperty> <owl:ObjectProperty rdf:ID="body"> <rdfs:subPropertyOf rdf:resource="#part"/> <rdfs:domain rdf:resource="#Camera"/> <rdfs:range rdf:resource="#Body"/> </owl:ObjectProperty> <owl:ObjectProperty rdf:ID="viewFinder"> <rdf:type rdf:resource="http://www.w3.org /2002/07/owl#FunctionalProperty"/> <rdfs:domain rdf:resource="#Camera"/> <rdfs:range rdf:resource="#Viewer"/> </owl:ObjectProperty> <owl:DatatypeProperty rdf:ID="size"> <rdfs:domain rdf:resource="#Lens"/> <rdfs:range rdf:resource="http://www.w3.org /2001/XMLSchema#string"/> </owl:DatatypeProperty Person Location Time Time Graph Label Graph birthPlace Place birthDate xsd:date deathYear xsd:gYear child Person party PoliticalParty pseudonym xsd:string ... ...
Figure 3: OWL description, the properties, attached super-types and the proposed visualisation category
Figure 3 illustrates an exemplary visualisation for the Person class based on its birthYear and deathYear properties. The total 308’497 Person class instances6stored in DBpedia are
anal-6
As of March 14th, 2012
ysed by ViDaX. Only instances for which the birthYear and deathYearproperties have been defined are selected. Since both properties are of the type xsd:gYear, ViDaX considers them compatible and a standard stacked chart visualisation is chosen.
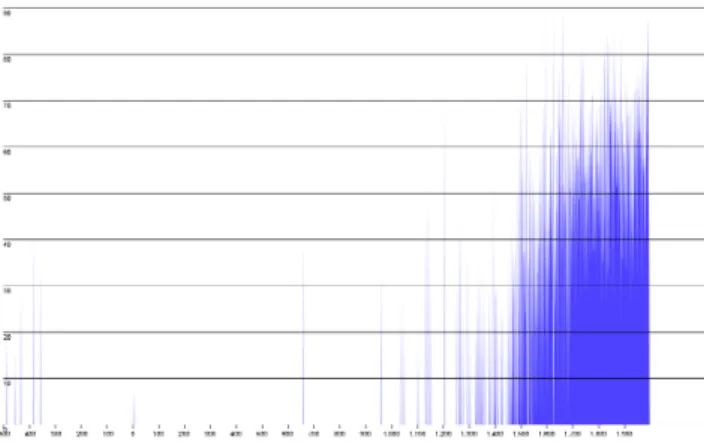
Figure 4: Number of people born/died between 1800 and 2012 In Figure 3, the user dynamically configured the x-axis to show data between the years 1800 and 2012. The number of births per year is represented by the blue top curve, while the number of deaths is visualised via the lower orange curve. The resulting graph is representative for the type of observation that can be made based on Wikipedia data. Since the data for the Person class is extracted
from Wikipedia personalities, the second half of the 20th century is well represented. On the one hand, birth rates between 1995 and 2012 are rather low. This is not because less people were born, but because only a few people younger than 17 years already managed to have their own Wikipedia page. On the other hand, any deaths reported in the news have been well documented on Wikipedia.
Figure 5: Average lifetime of people born in a given year The goal of ViDaX is to also offer some basic data mining func-tionality while preserving enough usability that a non-expert user is still able to explore RDF data from DBpedia and other sources. Figure 4 shows an example of what has already been achieved with the help of some basic operations. This visualisation uses exactly the same data source with the Person class and its properties birthYearand deathYear. However, instead of directly dis-playing the number of instances related to each property, Figure 4 shows the average lifetime of people born in a given year, by asking the tool to subtract the deathYear and birthYear properties. Note that for some of the years, the average lifetime might be quite high based on the fact that only a few old persons are recorded in DBpedia. Figure 5 outlines how such a query can be visually for-mulated. Note that Figure 5 is a mockup since the integration of the parsing of such expressions is still work in progress.
Figure 6: Defining the data range, values and related operators On the left-hand side, a list of all available properties for a given class (in this case the Person class) are shown. In the upper right part, the user can drag and drop properties and associate them with specific operations. ViDaX analyses the properties and expressions in this field and deducts potential ranges and values to be mapped to the different dimensions. In our simple chart case, only the x and y dimensions have been considered. However, with other visualisa-tion techniques, addivisualisa-tional dimensions like size or colour can also be mapped to value ranges. For example, a property with a limited set of values, such as the number of children per Person, could be mapped to particular shapes.
4.
CONCLUSIONS AND FUTURE WORK
We presented ViDaX, a visualisation and exploration tool for RDF data. The goal of our tool is to provide non-expert users the possibility to easily explore semantic web data sources with pow-erful visualisation and interaction techniques. ViDaX allows the non-expert user to explore any RDF data source accessible on the Web by automatically normalising and analysing the data in order to offer a consistent interface. We believe that such a visualisa-tion and exploravisualisa-tion tool can help to enhance the value of emerging semantic web data sources.
As explained earlier, ViDaX is still work in progress and the in-terface to formulate complex queries over data sources is currently under development. Furthermore, we are exploring the possibility to select and browse multiple classes at the same time. We also in-vestigate specific visualisation techniques for geographic and graph data. Note that even if the current implementation focusses on RDF data, ViDaX could be easily adapted to deal with arbitrary semantic data sources in the near future.
5.
ACKNOWLEDGMENTS
Bruno Dumas is supported by MobiCraNT, a project forming part of the Strategic Platforms programme by the Brussels Institute for Research and Innovation (Innoviris). The work of Lode Hoste is funded by an IWT doctoral scholarship.
6.
REFERENCES
[1] M. Cammarano, X. L. Dong, B. Chan, J. Klingner, J. Talbot, A. Halevey, and P. Hanrahan. Visualization of Heterogeneous Data. IEEE Transactions on Visualization and Computer Graphics, 13(6), November 2007.
[2] B. Chan, J. Talbot, L. Wu, N. Sakunkoo, M. Cammarano, and P. Hanrahan. Vispedia: On-Demand Data Integration for Interactive Visualization and Exploration. In Proceedings of SIGMOD 2009, Providence, USA, June 2009.
[3] F. Frasincar, A. Telea, and G.-J. Houben. Adapting Graph Visualization Techniques for the Visualization of RDF Data. In V. Geroimenko and C. Chen, editors, Visualizing the Semantic Web. Springer Verlag, 2006.
[4] J. Heer, S. K. Card, and J. A. Landay. Prefuse: A Toolkit for Interactive Information Visualization. In Proceedings of CHI 2005, Portland, USA, April 2005.
[5] P. Heim, J. Ziegler, and S. Lohmann. gFacet: A Browser for the Web of Data. In Proceedings of IMC-SSW 2008, Koblenz, Germany, December 2008.
[6] A. Langegger, W. Wöß, and M. Blöchl. A Semantic Web Middleware for Virtual Data Integration on the Web. In Proceedings of ESWC 2008, Tenerife, Spain, June 2008. [7] N. Matloff. The Art of R Programming: A Tour of Statistical
Software Design. No Starch Press, 2011.
[8] S. McDaniel. Rapid Graphs with Tableau Software: Create Intuitive, Actionable Insights in Just 15 Days (Tableau 5). CreateSpace, 2009.
[9] P. Mutton and J. Golbeck. Visualization of Semantic Metadata and Ontologies. In Proceedings of IV 2003, London, UK, July 2003.
[10] C. Reas and B. Fry. Getting Started with Processing. Make, 2010.
[11] J. S. Yi, Y. a. Kang, J. Stasko, and J. Jacko. Toward a Deeper Understanding of the Role of Interaction in Information Visualization. IEEE Transactions on Visualization and Computer Graphics, 13(6), November 2007.