electrodeposited nickel at different length scales
L. Philippe,a)P. Schwaller, G. Bürki, and J. Michler
EMPA, Swiss Federal Laboratories for Materials Testing and Research, CH-3602 Thun, Switzerland
(Received 24 May 2007; accepted 5 February 2008)
A comparison of microcompression and microtensile methods to study mechanical properties of electrodeposited nanocrystalline (nc) nickel has been performed. Microtensile tests that probe a volume of more than 2 × 10⁶m3show reasonable
agreement with results from microcompression tests that probe much smaller volumes down to a few m3. Differences between the two uniaxial techniques are discussed in terms of measurements errors, probed volume and surface effects, strain rate, and influence of stress state. Uniaxial solicitation in compression mode revealed several advantages for studying stress–strain properties.
I. INTRODUCTION
In recent years, the LIGA process (combines x-ray lithography with electroplating and plastic molding) for developing structures from nano- to micrometer sizes has become a routine process.1,2The reasons for the success of the galvanoforming method in the microelectrome-chanical systems (MEMS) industry are numerous and include the fact that metallic pieces with a well-controlled microstructure, high aspect ratio, and excel-lent spatial resolution can be obtained. This opens new horizons in research and industry, with possibilities for changing mechanical properties by tailoring microstruc-ture and alloying elements. For a successful application of such microscopic devices, a detailed understanding of their mechanical properties (at small length scales) is indispensable.3Device design requires the knowledge of
the stress–strain behavior of a material over a wide range of strains.4 The accurate determination of complete stress–strain curves on the microscopic scale is therefore of vital interest.
Mechanical properties determined with standard, es-tablished materials testing procedures at the macroscale cannot be easily extrapolated to smaller length scales. In particular, the errors of the measuring technique are dif-ficult to evaluate if there is a convolution with the so-called extrinsic size effect of the samples.5 Along with nanoindentation measurements (which are, however, mainly used for the determination of hardness and Young’s modulus), other techniques to test materials at
micrometer scales are emerging, such as microtensile6,7 and microcompression tests.8,9Size effects in monocrys-talline materials were evidenced in the past using mainly nanoindentation and microcompression tests.9,10 Al-though size effects related to internal length scales of materials are widely observed and simulated11,12 and used for industrial applications (i.e., improvement of a metal yield strength by grain size refinement), there re-mains a fundamental challenge to systematically inves-tigate external length-scale effects related to the probed volume in the submillimeter to nanometer regime.
External length-scale effects may be observed at mul-tiple stages over this wide range of sizes, because the mechanisms associated with dislocation storage, multi-plication, motion, pinning, and nucleation are generally active over different length scales.5,9To further
compli-cate the size effect, except for instrumented indentation testing there is currently no technique able to probe me-chanical properties of the same material at all different sizes; this bring into consideration the volume probed by each different technique used and its potential influence on the measured stress–strain behavior of the material. To evaluate the effects of grain size or geometrical con-straints on measured mechanical properties, there is first of all the great need to understand the influence of the measurement technique (load distribution, stress state, etc.) on the measurement values.
One possibility for mechanical testing of small speci-mens is to scale down conventional testing techniques. Uniaxial tensile testing is in general the most important mechanical testing method. However, downscaling of tensile testing to the submillimeter regime needs to be done very carefully. Many scaling-related artifacts have to be avoided: Geometry measurements need to be done
a)
Address all correspondence to this author. e-mail: [email protected] DOI: 10.1557/JMR.2008.0162
with a higher absolute precision in the case of small-scale specimens, and handling of small specimens is more dif-ficult.6,13 Gripping devices as well as the alignment of the specimen in the direction of the tensile force are critical. In microcompression experiment, sample prepa-ration assisted by focused ion beam (FIB) is common to test the material at different scales. Surface contamina-tion originating from the preparacontamina-tion can, however, fur-ther complicate the interpretation of the measured mate-rial properties.14
The aim of this work is to make a systematic compari-son of uniaxial microtensile and microcompression methods on the same material to get a better understand-ing of the influence of the volume probed and the method on the mechanical response of the metal. For this task, we used electrodeposited nanocrystalline nickel specimens of the same batch to produce microtensile and microcom-pression samples. We used nanocrystalline material to minimize extrinsic, e.g., physical sample, effects. We revealed that there is a very good agreement between both uniaxial tests and discuss the errors of variations between both methods, showing a clear interest of com-pression method when studying highly isotropic materials.
II. EXPERIMENTAL
A. Sample fabrication and microstructure characterization
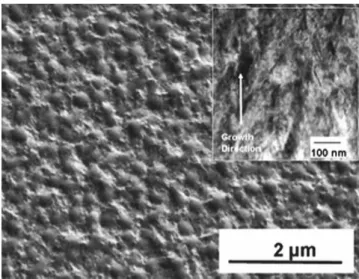
Nanocrystalline (nc) Ni samples have been manufac-tured by a LIGA process and were provided by Tecan Ltd., Theale, Dorset, UK. Glow-discharge optical emission spectrometry (GDOES) JY 5000 RF (Horiba Jobin Yvon GmbH, Longjumeau, France) was performed to analyze the elemental composition of the deposit by depth pro-filing with a resolution down to a few ppm depending on the element (Table I). Samples for tensile and indentation testing having a thickness of 148.75 ± 0.7m were pro-duced from the same batch directly in the shape of a conventional, miniaturized tensile test specimen. Rough-ness Ra of the as-deposited surface was measured by profilometry and was 0.6 ± 0.05m. By measuring the volume of the deposits and their mass, we could deduce that there was a free volume (pores) of up to 25% within the matrix. For topography imaging, the sample surface was observed by high-resolution scanning electron microscopy (HRSEM). Transmission electron micros-copy (TEM) to determine the grain size (average grain
size of 50 nm with very high aspect ratios, variation range lengths 30–200 nm, see Fig. 1), and x-ray diffrac-tion (XRD) measurements were performed to analyze the crystal structure. XRD using ⌰–2⌰ scans showed that the materials exhibited a cubic texture. For the micro-compression tests, two different types of pillars have been used. Pillars with a height of 30m and a diameter of 10 m have been directly produced by electro-deposition. FIB machining was used to fabricate smaller pillars, having an average base diameter of 2.47m and an average top diameter of 1.98m. The average height was 3.76 m.
B. Mechanical testing
In situ scanning electron microscope (SEM) microten-sile tests were conducted at room temperature with a tensile stage (Kammrath & Weiss GmbH, Dortmund, Germany) in a ZEISS DSM 962 SEM. The microtensile Ni specimens were placed into the gap of a gripping device. The test was conducted under displacement con-trol, and a linear variable differential transducer (LVDT) was used for the measurement of the crosshead displace-ment. Because of difficulties in gripping and misalign-ment of the specimen during the test, the strain in the sample was measured via image analysis from the SEM video to ensure a precise measurement. The setup has been adapted for loads up to 15 kN. The applied strain rate was 0.0002 s−1. For microcompression loading, we developed a novel method for in situ SEM microcom-pression testing.15
The in situ compression tests were carried out using a diamond flat punch of 15m diameter. Strain has been calculated from the displacement measurement of the instrumented stack piezo using an instrument compliance
TABLE I. Elemental composition (wt%) of the electrodeposited nickel by means of GDOES measurements. Depth profiling indicates a constant composition over the deposit thickness.
Ni N O Si C H S
99.57106 0.15798 0.12562 0.09135 0.03933 0.0198 0.01061
FIG. 1. HRSEM image of the nc Ni surface; roughness and grain size are easily identified on this picture. The inset of the right of the picture shows a TEM bright-field image of the specimen indicating the growth direction of the electrodeposition.
of 0.0038m/mN and corrected for pillar sink-in into the substrate (see Sec. IV. A). To assess the potential of the method, compression tests on the 10-m Ni pillars were performed inside the SEM. In the same way as for tensile measurements, a quantitative evaluation of the deforma-tion during compression was possible through the video frame records. Microcompression tests have the advan-tage over microbending tests that the sample dimensions can be more easily scaled down to below 1m diameter. The direct SEM observation during the instrumented compression testing allows very efficient positioning, as-sessment of the failure mechanisms, and automation of the test. The compression tests were performed using a custom-built instrumented microindentation device that can be used inside the SEM. The instrument, the details of which are described elsewhere,15
is based on a load cell fixed on a piezoactuated lateral positioning stage.
Microcompression tests on smaller Ni pillars (2 m diameter) have been performed in a commercial MTS Nano XP nanoindentation system (MTS System Corpo-ration, Eden Prairie, MN). A truncated tip of 8m diam-eter was used, and all tests were conducted at room tem-perature on FIB-prepared samples.
III. RESULTS
Chemical analysis reveals the high purity of the elec-trodeposited nickel used in the study (see Table I). The compositional depth profiling allows us to conclude that there was homogeneous composition on the entire depos-it section. The electrodeposdepos-ited nc nickel composdepos-ition is of importance if one wants to avoid impurity segregation (such as sulfur) at the grain boundaries that induces em-brittlement.
Figure 1 shows a HRSEM picture of the nc Ni surface; the presence of a rough surface as well as distinction of grains (of size up to 200 nm) are clearly visible. The inset in Fig. 1 displays a TEM cross section of the electrode-posited Ni films. The structure is nanocrystalline. The TEM analysis revealed the presence of a predominant columnar microstructure parallel to the deposition direc-tion. At higher magnification, the presence of twins was detected. XRD confirmed the face-centered cubic (fcc) crystal structure.
Figure 2 shows the average true stress–strain (–⑀) curve (i.e., measurements made prior to necking) ob-tained by microtensile measurements from four different measurements. The curve indicates a weak strain hard-ening leading to an increase of the required stress for further deformation of the tested specimen. Figure 2(a) shows a SEM image of the dogbone’s central section extracted from the video frames recorded at the very beginning of a measurement, and Fig. 2(b) represents the SEM video frame of the microtensile bars just before fracture, revealing necking in the central part. The inset
on the left part of the graph shows an optical picture of a typical dogbone used; it shows clearly large extremities of the dogbone to grip and fix the specimen inside a gripping system ensuring a good positioning of the ten-sile bar.
Figure 3 displays true–⑀ curves obtained on 10-m-diameter pillars (aspect ratio 3:1) with in situ compres-sion test compared with stress–strain curve obtained on 2-m-diameter pillars (aspect ratio 3:2). Few of the 2-m pillars exhibited small off-axis deformation that FIG. 2. Average tensile stress–strain curves obtained from four samples. (a) SEM image of the central part of the tensile bar shows video frames at time corresponding to the beginning and (b) the end before fracture of the test. The inset of the left part of the graph shows an optical picture of a typical dogbone specimen tested.
FIG. 3. Average microcompressive stress–strain obtained from five measurements for compression tests on 10-m pillars with in situ micro-compression test and on 2-m pillars for MTS compression tests. On the 2-m pillar curve, a reloading procedure at the beginning of the compression test to rectify the misalignment of the pillar with the tip is visible. In situ SEM image of the pillar made from video frames at time corresponding to (a) beginning and (b) end of the test. Ex situ SEM picture of the FIB pillars (c) before and (d) after microcompres-sion test. A preloading to avoid misalignment is visible on the graph.
did not influence significantly the measured stress–strain curve. Both curves represent mean true–⑀ curves based on five measurements. Figures 3(a) and 3(b) for the 10-m-diameter pillar tested represent the video frames ex-tracted at the beginning and at the end of a typical in situ compression test, respectively. Buckling or cracking for-mation was only rarely found in the video recording, and those were not used for analysis. SEM images Figs. 3(c) and 3(d) were taken ex situ, respectively, before and after the microcompression tests. The sink-in of the pillar into the substrate material is important in this case and has to be accounted for. The reason for this is that the base will always deform along the deformation axis, and this de-formation contributes to the system compliance, which is not accounted for when collecting the displacement data. In this work, this error was alleviated by accounting for the compliance through the calculation of the base com-pliance. By subtracting this base compliance from the total compliance, a corrected stiffness (and hence modu-lus) is obtained as proposed by Zhang et al.13,16
Table II lists the respective material properties inferred from–⑀ curves obtained with the different testing meth-ods. The yield stress values listed in Table II are equal to the 0.2% offset yield stress (i.e., a line shifted by a strain of 0.002 is drawn parallel to the linear elastic part; the intersection of this line with the stress–strain curve is taken as yield stress y) commonly used in materials technology, and the Young’s modulus is derived from the slope of the–⑀ curve in the elastic range.
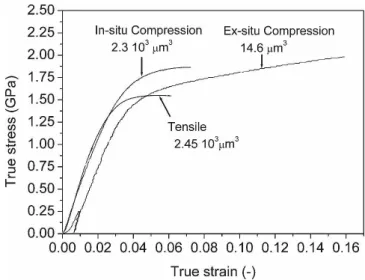
Figure 4 makes a comparison between the stress–strain curves obtained with microcompression and microtensile measurements. On each curve, the probed volume of the technique is indicated. From Table II, we note a slightly lower value of the Young’s modulus assessed in com-pression modes.
IV. DISCUSSION
The complete stress–strain curves determined by three different methods reveal that there is a rather fair agree-ment between the two compression and the tensile tests despite the fact that the probed volume differs by five orders of magnitude. In this section, we discuss these experimental result discrepancies in terms of measure-ment errors, probed volume and surface effects, strain rate, and influence on stress state.
A. Measurement errors
Measurement errors that are intrinsic to each technique are prone to give differences in –⑀ curves.
For tensile tests, the major source of uncertainty in the stress calculation being the measurement of the cross-sectional area of the specimen, 20 microtensile bars from the same batch as the ones tested were embedded in resin and polished to their cross section. The measured optical image area for each cross section and an average value of the tensile bars cross section were calculated. As all ten-sile bars tested are issued from the same plating batch, we assume that an average value of their cross sections gives sufficient accuracy.
For a compression test, the pillar shape is crucial. The 10-m pillar cross section was determined by measure-ments on pillars that were embedded in resin and pol-ished to their cross section. Pillars cross section were measured and then repolished again for another section measurement over its entire length until their basement, to make 10 consecutive measurements of the pillar cross section over its entire length. For 2-m pillars, 10 meas-urements of the cross section were made directly on the pillar SEM image and over its entire length for getting an average value of the pillar volume; i.e., the pillar shape being a source of error as the diameter is not constant over the length.
In both cases, for microcompression and microtensile tests, the pillar sizes (length L and surface area A) or tensile bar sizes (length L, and cross section A) can be measured with an accuracy of 5% for L, and L0 (displace-ment) and with an error of 15% for A. This induces for these statistical errors a scatter of 25% in the Young’s modulus estimation and of 15% fory. Such experimental errors on the measurements might explain by themselves TABLE II. Material properties (Young’s modulus, E; yield stress,y)
for Ni as determined from microtensile and compression testing. Com-parison of the strain rates values used for each method.
Method E (GPa) y(GPa) Strain rates (s−1)
Tensile 63 ± 16 1.2 ± 0.1 0.2 × 10⁻³
Compression (2-m pillar) 51 ± 13 1.3 ± 0.2 0.9 × 10⁻³ Compression (10-m pillar) 54 ± 14 1.4 ± 0.2 1.5 × 10⁻³
FIG. 4. Comparison of the stress–strain curves obtained for the dif-ferent mechanical testing methods on nc electrodeposited nickel: in situ microcompression, ex situ microcompression, and microtensile tests. For each experiment, the probed volume is labeled.
the discrepancies found between tensile and compression tests.
In the microcompression experiments, FIB samples of 2 m diameters and electrodeposited 10-m pillars are compared. In this way, probed volume and surface con-ditions are simultaneously changed, which leads to dif-ficulty in comparing the data. We estimate that roughness of the FIB pillar is the same as those of tensile and electrodeposited pillars samples as it was cut out of an electrodeposited nickel sample. However, surface condi-tions are clearly changing from the FIB processing, and recent results suggest that this cannot be neglected.14 Furthermore, pillar asymmetry and texture effect is a problem as there is not a compression test on the whole deposited volume.
This comparison between microcompression tests on different pillar sizes and using two different setups shows that it is possible to obtain mechanical properties of me-chanically isotropic materials to very good accuracy with microcompression experiments. However, for tests using conventional nanoindentation equipment with a flat-ended tip, special care has to be taken. First, the meas-ured displacement values have to be corrected by ac-counting for the sink-in of the pillar into the substrate, whereas this correction is not necessary when strain val-ues are determined from SEM images recorded during compression. Also, this correction has to take into ac-count the complex geometry of the postbase connection if one wants to avoid an overestimation of the Young’s modulus with a simple elastic contact model.16 Finally, without a continuous video control, a misalignment of the tip to the pillar can lead to a decrease of the measured elastic modulus or in excessive cases to the buckling of the pillars.
Overall, the difference found in the results between the three methods (Table II and Fig. 4) can be yet explained by the experimental errors described in this subsection. However, other contributing effects to the differences observed between the measurements are reviewed below. B. Probed volume and surface effects
The probed volume is different for each technique, as shown in Fig. 4. Even though the number of probed grains varies over several orders of magnitudes for the different experimental setups, compared with the grain size the deformed volumes are large in either case. Thus, the difference of probed volume in the different tests, i.e., external size effects, should not have a significant influ-ence on the –⑀ curves. However, the smaller the vol-ume, the more important the surface of an object gets, and one has to ensure that the surface region does not have significantly different properties than in the bulk. For instance, a thin native oxide layer (typically of around 50–300 Å for Ni17) or an ion implantation zone becomes more important at smaller samples sizes.
Young’s modulus values and yield stresses are some-what lower than already reported for fully densified nc electrodeposited nickel,5suggesting that the influence of textures, pre-existing voids, columnar grain structure, and hydrogen on the mechanical response cannot be ne-glected.4,18
For the uniaxial tests, (not true for the 2-m pillars because the entire electrodeposited volume is not tested) where measurements on the whole electrodeposited vol-ume are performed, there should be a moderated texture effect influence on the calculated Young’s modulus val-ues. Indeed, Table II shows that differences between ten-sion and compresten-sion Young’s modulus values obtained are little; differences are related to the grain orientation differences between the two methods and to the fact that free volume (pores and flaws) within the matrix tested are prone to play a bigger role on the mechanical re-sponse in tensile mode.
Finally, it is important to look not only at the average grain size (∼50 nm), but also the size of the longest grain (up to 200 nm) as observed by TEM and its shape (not circular but having a high aspect ratio). This is important because a few large grains can dominate the deformation behavior of the material and determine its perfor-mance.19,20 Again, this will not have the same conse-quence depending on the nature of the stress direction applied; in compression measurement the stress is ap-plied parallel to the grain length, whereas in tensile tests the stress is perpendicular to it. The mechanism of de-formation and the properties of the nc material not only depend on the average grain size, but are strongly influ-enced by the grain size distribution, the grain aspect ra-tios, and the grain boundary structure.4
C. Strain rate
The strain-rate sensitivity of fcc nc metals is already well reported in literature,4,21,22where it was found that nc pure nickel exhibits a positive strain-rate sensitivity in flow stress.21
In this study, variation between the strain rates values for the two methods is not significant (be-tween 0.2 × 10⁻³
s−1
and 1.5 × 10⁻³ s−1
), and load– displacement curves for the different strain values did not show a significant influence on the measurement (see Table II). Yield stress value is expected to increase with increasing strain rate4,21 that goes in the right direction to the present measurements (i.e., higher yield stresses values obtained in compressive mode). However, models have been developed for grain sizes smaller than 50 nm, but a mechanistic rationalization for the influence of strain rate sensitivity in nc fcc metals becomes less straightforward for large grain sizes.23Therefore, a complete picture that explains the more-or-less continuous decrease in strain-rate sensitivity, or alternatively the increase in activation volume with increasing grain size will require additional analysis that goes beyond this work.
D. Influence on stress state
Table II and Fig. 4 show, that tensile and compression tests give–⑀ curves and material properties that are in relatively good agreement to each other. Cheng et al. proposed a deformation mechanism map for fcc metals.21 The model predicts not only the strength as a function of grain size, but also the observed tension/microcompression asymmetry of the yield strength. It is predicted that a higher yield stress will be found in compression than in tension for fcc metals with grain sizes ranging from 2 up to 100 nm. The tension/compression asymmetry, which is explained by a pressure dependence of the dislocation self-energy during bow-out, may be responsible for the difference in yield stress values plotted in Table II for the tested fcc nc nickel.
V. CONCLUSION
We assessed the potential of microcompression and microtensile methods to characterize nanocrystalline metals and discussed extensively potential measurement errors. These measurement errors explain alone the slight variation in the mechanical properties assessed by the two methods. Because of the small grain, size effects were neglected, which revealed on one hand the impor-tance of load cases particular to each method, and on the other hand the influence of the probed volume and of the microstructure. The importance of surface effects, stress state, and strain rate could not be distinguished. We found that uniaxial tensile and uniaxial compression test-ing is able to provide accurate data and similar mechani-cal insights of the tested materials of five orders of mag-nitude of probed volume. Experimental validation of emerging strain-gradient based continuum theories of de-formation (models that incorporate a physical length scale into the constitutive relations for the mechanical response of materials) must carefully account for these experimental issues that extend beyond the gradient-induced storage of defects. Comparing the aforemen-tioned advantages and drawbacks of the different ap-proaches one may conclude that in this context micro-compression tests are very appropriate to study mechanical properties of isotropic nc metals.
REFERENCES
1. Y. Yang, B.I. Imasogie, S.M. Allameh, B. Boyce, K. Lian, J. Lou, and W.O. Soboyejo: Mechanisms of fatigue in LIGA Ni MEMS thin films. Mater. Sci. Eng., A 444, 39 (2007).
2. B. Li and Q. Chen: Solid micromechanical valves fabricated with in situ UV-LIGA assembled nickel. Sens. Actuators, A 126, 187 (2006).
3. N.R. Moody, J.M. Jungk, M.S. Kennedy, S.V. Prasad, D.F. Bahr, and W.W. Gerberich: Mechanical properties of wear tested LIGA nickel, in Fundamentals of Nanoindentation and Nanotribology
III, edited by K.J. Wahl, N. Huber, A.B. Mann, D.F. Bahr, and
Y-T. Cheng (Mater. Res. Soc. Symp. Proc. 841, Warrendale, PA, 2005), R7.8.
4. K.S. Kumar, H. Van Swygenhoven, and S. Suresh: Mechanical behaviour of nanocrystalline metals and alloys. Acta Mater. 51, 5743 (2003).
5. W.D. Nix, J.R. Greer, G. Feng, and E.T. Lilleodden: Deformation at the nanometer and micrometer length scales: Effects of strain gradients and dislocation starvation. Thin Solid Films 515, 3152 (2007).
6. E. Mazza, S. Abel, and J. Dual: Experimental determination of mechanical properties of Ni and Ni–Fe microbars. Microsyst.
Technol. 2, 197 (1996).
7. M.A. Haque and M.T.A. Saif: In-situ tensile testing of nanoscale specimens in SEM and TEM. Exp. Mech. 42(1), 123128 (2001). 8. B. Moser, R. Schwaiger, and M. Dao: Size effects on deformation and fracture on nanostructured materials, in Nanostructured
Coat-ing, edited by A. Cavaleiro and J.Th.M. De Hosson, Nanostructure
Science and Technology Series (Springer, New York, 2006). 9. J.R. Greer, W.C. Oliver, and W.D. Nix: Size dependence of
me-chanical properties of gold at the micron scale in the absence of strain gradients. Acta Mater. 53, 1821 (2005).
10. M.D. Uchic, D.M. Dimiduk, J.N. Florando, and W.D. Nix: Sample dimensions influence strength and crystal plasticity.
Sci-ence 305, 986 (2004).
11. H.D. Espinosa, M. Panico, S. Berbenni, and K.W. Schwartz: Dis-crete dislocation dynamics simulations to interpret plasticity size and surface effects in freestanding fcc thin films. Int. J. Plast. 22, 2091 (2006).
12. W.D. Nix and H. Gao: Indentation size effects in crystalline ma-terials: a law for strain gradient plasticity. J. Mech. Phys. Solids 46,411 (1998).
13. I.N. Sneddon: The relation between load and penetration in the axisymmetric Boussineq for a punch of arbitrary profile. Int. J.
Eng. Sci. 3, 47 (1965).
14. H. Bei, S. Shim, M.K. Miller, G.R. Pharr, and E.P. George: Ef-fects of focused-ion-beam milling on the nanomechanical behav-ior of a molybdenum-alloy single crystal. APL 91, 111915 (2007). 15. B. Moser, K. Wasmer, L. Barbieri, and J. Michler: Strength and fracture of Si micropillars: A new scanning electron microscopy-based micro-compression test. J. Mater. Res. 22(4), 1004 (2007). 16. H. Zhang, B.E. Schuster, Q. Wie, and K.T. Ramesh: The design of accurate micro-compression experiments. Scripta Mater. 54, 181 (2006).
17. W.F. Mohamad, A. Abou Ajar, and A.N. Saleh: Effects of oxide layers and metals on photoelectric and optical properties of Schottky barrier photodetector. Renew. Ener. 31, 1493 (2006). 18. R.J. Asaro and S. Suresh: Mechanistic models for the activation
volume and rate sensitivity in metals with nanocrystalline grains and nano-scale twins. Acta Mater. 53, 3369 (2005).
19. V.L. Tellkamp, A. Melmed, and E.J. Lavernia: Grain growth be-havior of a nanostructured 5083 Al–Mg alloy. Metal. Mater.
Trans. A 32, 2335 (2001).
20. T. Hanlon, Y-N. Kwon, and S. Suresh: Grain size effects on the fatigue response of nanocrystalline metals. Scripta Mater. 49, 675 (2003).
21. S. Cheng, J.A. Spencer, and W.W. Milligan: Strength and tension/ compression asymmetry in nanostructured and ultrafine-grain metals. Acta Mater. 51, 4505 (2003).
22. J.L. Loubet, M. Bauer, A. Tonck, S. Bec, and B. Gauthier-Manuel:
Mechanical Properties and Deformation Behaviour of Materials Having Ultra-fine Microstructures (Kluwer Academic Publishers,
The Netherlands, 1993), pp. 429–447.
23. T. Chudoba, P. Schwaller, R. Rabe, J-M. Breguet, and J. Michler: Comparison of nanoindentation results obtained with Berkovich and cube-corner indenters. Philos. Mag. 86(33–35), 5265 (2006).