HAL Id: hal-02337815
https://hal.archives-ouvertes.fr/hal-02337815v2
Submitted on 1 Sep 2020
HAL is a multi-disciplinary open access
archive for the deposit and dissemination of
sci-entific research documents, whether they are
pub-lished or not. The documents may come from
L’archive ouverte pluridisciplinaire HAL, est
destinée au dépôt et à la diffusion de documents
scientifiques de niveau recherche, publiés ou non,
émanant des établissements d’enseignement et de
Predicting the Progression of Mild Cognitive
Impairment Using Machine Learning: A Systematic,
Quantitative and Critical Review
Manon Ansart, Stéphane Epelbaum, Giulia Bassignana, Alexandre Bône,
Simona Bottani, Tiziana Cattai, Raphäel Couronné, Johann Faouzi, Igor
Koval, Maxime Louis, et al.
To cite this version:
Manon Ansart, Stéphane Epelbaum, Giulia Bassignana, Alexandre Bône, Simona Bottani, et al..
Predicting the Progression of Mild Cognitive Impairment Using Machine Learning: A
System-atic, Quantitative and Critical Review.
Medical Image Analysis, Elsevier, 2021, 67, pp.101848.
Predicting the Progression of Mild Cognitive Impairment
Using Machine Learning: A Systematic, Quantitative and
Critical Review
Manon Ansarta,b,c,d,e,∗, Stéphane Epelbauma,b,c,d,e,f, Giulia Bassignanaa,b,c,d,e,
Alexandre Bônea,b,c,d,e, Simona Bottania,b,c,d,e, Tiziana Cattaia,b,c,d,e,1, Raphaël
Couronnéa,b,c,d,e, Johann Faouzia,b,c,d,e, Igor Kovala,b,c,d,e, Maxime Louisa,b,c,d,e, Elina
Thibeau-Sutrea,b,c,d,e, Junhao Wena,b,c,d,e, Adam Wilda,b,c,d,e, Ninon Burgosa,b,c,d,e,
Didier Dormonta,b,c,d,e,g, Olivier Colliota,b,c,d,e,f,g, Stanley Durrlemane,a,b,c,d
aInstitut du Cerveau et de la Moelle épinière, ICM, F-75013, Paris, France bInserm, U 1127, F-75013, Paris, France
cCNRS, UMR 7225, F-75013, Paris, France dSorbonne Université, F-75013, Paris, France eInria, Aramis project-team, F-75013, Paris, France
fInstitute of Memory and Alzheimer’s Disease (IM2A), Centre of excellence of neurodegenerative disease
(CoEN),National Reference Center for Rare or Early Dementias, Department of Neurology, Pitié-Salpêtrière Hospital, AP-HP, Boulevard de l’hôpital, F-75013, Paris, France
gAP-HP, Pitié-Salpêtrière hospital, Department of Neuroradiology, Paris, France
hDept. of Information Engineering, Electronics and Telecommunication, Sapienza University of Rome, Italy
Abstract
We performed a systematic review of studies focusing on the automatic prediction of the progression of mild cognitive impairment to Alzheimer’s disease (AD) dementia, and a quantitative analysis of the methodological choices impacting performance. This review included 172 articles, from which 234 experiments were extracted. For each of them, we reported the used data set, the feature types, the algorithm type, perfor-mance and potential methodological issues. The impact of these characteristics on the performance was evaluated using a multivariate mixed effect linear regressions. We found that using cognitive, fluorodeoxyglucose-positron emission tomography or po-tentially electroencephalography and magnetoencephalography variables significantly improved predictive performance compared to not including them, whereas including other modalities, in particular T1 magnetic resonance imaging, did not show a signif-icant effect. The good performance of cognitive assessments questions the wide use of imaging for predicting the progression to AD and advocates for exploring further fine domain-specific cognitive assessments. We also identified several methodological issues, including the absence of a test set, or its use for feature selection or parameter tuning in nearly a fourth of the papers. Other issues, found in 15% of the studies, cast doubts on the relevance of the method to clinical practice. We also highlight that short-term predictions are likely not to be better than predicting that subjects stay stable over
∗Corresponding author
time. These issues highlight the importance of adhering to good practices for the use of machine learning as a decision support system for the clinical practice.
Keywords: quantitative review, Alzheimer’s disease, Mild Cognitive Impairment, progression, automatic prediction, cognition
1. Introduction
The early diagnosis of Alzheimer’s disease (AD) is crucial for patient care and treatment. Machine learning algorithms have been used to perform automatic diagnosis and predict the current clinical status at an individual level, mainly in research cohorts. Individuals suffering from mild cognitive impairment (MCI) are however likely to have 5
a change of clinical status in the coming years, and to be diagnosed with AD or another form of dementia. Distinguishing between the MCI individuals that will remain MCI (MCI stable, or sMCI) from those who will progress to AD (pMCI) is an important task, that can allow for the early care and treatment of pMCI patients. In this article, we will review methods that have been proposed to automatically predict if an MCI 10
patient will develop AD dementia in the future by performing a careful reading of published articles, and compare them through a quantitative analysis.
The application of machine learning to precision medicine is an emerging field, at the cross roads of different disciplines, such as computer science, radiology or neurol-ogy. Researchers working on the topic usually come from one field or the other, and 15
therefore do not have all the skills that are necessary to design methods that would be efficient and following machine learning best practices, while being understandable and useful to clinicians.
Reviews of the automatic prediction of the patient’s current diagnosis from clinical or imaging variables acquired at the same time in the context of AD have already been 20
published, but none specifically target the prediction of progression from MCI to AD dementia. They focus on the use of magnetic resonance imaging (MRI) (Falahati et al., 2014; Leandrou et al., 2018), or of neuroimaging data more broadly (Rathore et al., 2017; Arbabshirani et al., 2017; Haller et al., 2011; Sarica et al., 2017). Several of them are systematic reviews such as Arbabshirani et al. (2017) with 112 studies on 25
AD, Rathore et al. (2017) with 81 studies, Falahati et al. (2014) with 50 studies and Sarica et al. (2017) with 12 studies. They often gather the findings of each individual article and compare them, but no quantitative analysis of performance is proposed.
We propose here to perform a systematic and quantitative review of studies predict-ing the evolution of clinical diagnosis in individuals with MCI. We will report different 30
quantitative and qualitative characteristics of the proposed method such as the sam-ple size, type of algorithm, reported accuracy, identification of possible issues. We will then analyze this data to identify the characteristics which impact performance the most, and list several recommendations to ensure that the performance is well es-timated, and that the algorithm would have the best chance to be useful in clinical 35
2. Materials and Method 2.1. Selection process
The query used to find the relevant articles was composed of 4 parts:
1. As we study the progression from MCI to AD, the words MCI and AD should 40
be present in the abstract ;
2. We removed the articles predicting only the patient’s current diagnosis using variables acquired at the same time point by ensuring the words “prediction” and “progression” or associated terms are present in the abstract ;
3. A performance measure should be mentioned ; 45
4. A machine learning algorithm or classification related key-word should be in the abstract. This fourth part ensures the selected articles make individual predic-tions and reduces the presence of group analyses.
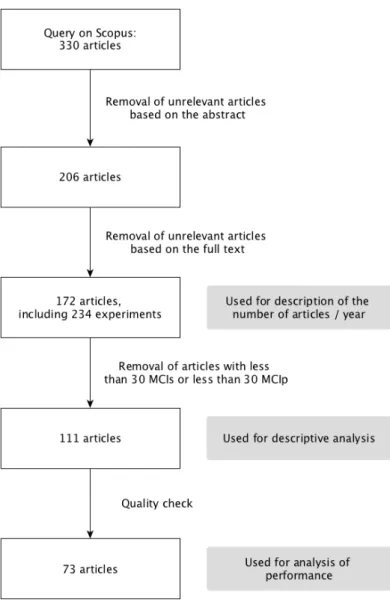
The full query can be found in Appendix A.1. Running it on Scopus on the 13th of
December 2018 resulted in 330 articles. The abstracts were read to remove irrelevant 50
articles, including studies of the progression of cognitively normal individuals to MCI, automatic diagnosis methods, review articles and group analyses. After this selection 206 articles were identified. As this first selection was quite conservative, 34 additional articles were removed from the selection for similar reasons during the reading process, leaving 172 studied articles which are listed in Appendix B. The selection process is 55
described in Figure S1 in Appendix A.2. 2.2. Reading process
For each study, the number of individuals was first assessed and noted. Only studies including more than 30 sMCI and 30 pMCI (111 articles) were then fully read, as we considered that experience using fewer than 30 individuals cannot provide robust esti-60
mates of performance. Articles with fewer than 30 individuals in each category were still considered when studying the evolution of the number of articles with time, and of the number of individuals per article with time. The studies including enough individ-uals were then analyzed by one of the 19 readers participating in this review, and a final curation was performed by one of the authors (MA) to ensure homogeneity. 36 items, 65
of which a list is available in Appendix A.3, were reported for each study, including the used features, the cohort, the method (time to prediction, algorithm, feature selec-tion, feature processing), the evaluation framework and the performance measures, as well as identified biases in the method. When several experiments were available in an article, they were all reported in the table. A total of 234 experiments was thus studied. 70
A table containing the articles included in the review and the reported values can be found on https://gitlab.com/icm-institute/aramislab/mci-progression-review. The issues identified in each article were removed from this open-access ta-ble, to avoid negatively pointing at studies. They can be made available if requested to the corresponding author.
2.3. Quality check
Several methodological issues were identified during the reading process. This list of issues was not previously defined, it has been established as issues were encountered in the various studies. We identified the following list of issues:
• Lack of a test data set: use of the same data set for training and testing the algo-80
rithm, without splitting the data set or using any kind of cross-validation method. The performance computed this way is the training performance, whereas a test performance, computed on a different set of individuals, is necessary to measure the performance that could be obtained on another data set (i.e. generalizability of the method) .
85
• Automatic feature selection performed on the whole data set. When a large num-ber of features is available, automatic feature selection can be performed in order to identify the most relevant features and use them as input. A variety of auto-matic algorithms exist to do this. Some studies performed this autoauto-matic feature selection on the whole data set, before splitting it into a training and a test set 90
or performing cross-validation. An example of this issue is, first, using t-tests to identify features that best separate pMCI from sMCI, using the whole data set, then splitting the data set into a training and a test set, to respectively train the classification algorithm and evaluate its performance. In this example, the individuals from the test set have been used to perform the automatic feature se-95
lection and choose the most relevant features. This is an issue, as individuals in the test set should be used for performance evaluation only.
• Other data-leakage. More broadly, data leakage is the use of data from the test set outside of performance evaluation. Using the test data set for parameter tuning, or for choosing the best data set out of a large number of experiments, are two 100
common examples of data leakage.
• Feature embedding performed on the whole data set. Feature embedding (for ex-ample principal components analysis) transforms the input features into a lower-dimension feature space. It is often used to reduce the input lower-dimension when many features are available, but it does not use the individual labels (sMCI/pMCI) 105
to do so, as feature selection often does. This issue is therefore similar to per-forming feature selection on the whole data set, except that only the features of the test individuals are used, and not their labels.
• Use of the date of AD diagnosis to select the input visit of pMCI individuals. An example of this issue is using the visit 3 years before progression to AD for pMCI 110
subjects, and the first available visit for sMCI subjects, to predict the progression to AD at 3 years, even for testing the method. In this case, the date of progression to AD of the individuals of the test set was used to select the input visit, which is not possible in clinical practice, as the date of progression is not known. Such experimental designs are also likely to introduce biases between pMCI and sMCI 115
subjects in age or in total observation periods for instance, which may lead to a better performance than what could be achieved in a real-life scenario.
Other methodological issues, not belonging to these categories, were also reported, such as incompatibility between different reported measures. The articles in which at least one of these issues was identified were not used when analyzing the performance 120
of the methods. Only articles with no reported issues were used, however it is possible that some issues could not be detected from the elements given in the articles, and that some issues were not identified during reading.
2.4. Statistical analysis 2.4.1. General model 125
We studied the impact of various method characteristics (such as input feature and algorithm) on the performance of the classification task, separating sMCI from pMCI individuals. Several experiments were reported for each article, so we had to account for the dependency between experiments coming from the same article. In order to do so, we used linear mixed-effects models with a random intercept on the article. 130
For the model to have enough power, we grouped the characteristics in a hierar-chical manner, creating broad categories that can be expanded into finer ones several times. The categories were created as such :
• linear models: linear regression, orthogonal partial least square (OPLS), linear discriminant analysis (LDA), manual threshold
135
• generalized linear models: linear support vector machine(SVM), logistic regres-sion, survival analysis
• non-linear models: random forest, multi-kernel learning, non-linear SVM, bayesian methods, neural networks, others
• imaging features 140
– T1 MRI
∗ region-based features on selected regions of interest (T1-ROI) ∗ region-based features on the whole brain
∗ voxel-based features
– positron emission tomography (PET) 145
∗ fluorodeoxyglucose (FDG) PET
∗ Amyloid PET
– white matter hyper-intensities
– electroencephalography (EEG) or magnetoencephalography (MEG) – diffusion tensor imaging (DTI)
150
– fMRI
• cerebrospinal fluid (CSF) biomarkers • cognitive features
– domain-targeted cognitive features 155
– new, home-made cognitive features • socio-demographic and genetic features
– socio-demographic features ∗ age ∗ gender 160 – Apolipoprotein E (APOE) • other features • longitudinal approach
• use of the Alzheimer’s Disease Neuroimaging Initiative (ADNI) data set • number of subjects
165
A first model was created with the broadest categories, and we used a two-sided t-test on the regression coefficients to identify the categories of characteristics which had a significant impact on performance. The next model was then created by expanding only the significant categories and keeping the non-significant one at a coarse level. The expansion and the creation of new models was repeated until we reached a model 170
for which all significant coefficients belonged to categories that could not be expanded further. We report the results of the final model in 4. The intermediate models leading to the final one are reported in section Appendix A.4.1 of Supplementary Materials.
For each model, we only used the characteristics which were found in more than one article with an associated performance measure and with no identified issue. The 175
performance measure used for these models was the area under the receiver operating characteristic (ROC) curve (AUC), experiments with no reported AUC were therefore not taken into account.
Only the experiments with no identified methodological issues were included in the model. This process was performed twice: once using all experiments without issues, 180
and once using only the experiments performed on the ADNI database.
The p-values corrected for multiple comparisons were obtained by using the Benjamini-Hochberg procedure.
2.4.2. Individual feature models
We wanted to test whether T1 MRI, cognitive or FDG PET features are predictors of better performance if used alone or in combination with other features. To this purpose, for a given feature type F, we selected the experiments using this feature type and that had a reported AUC and no methodological issue. We then used a linear mixed-effect model, defined as:
AUCi= α ∗ ηi+ β + βarticlei
where i is the experiment, articlei is the article to which the experiment belongs (as
185
uses only the studied feature type Fand 1 when it uses other feature types as well. We used a two-sided t-test on α to determine if including other feature types significantly changed the performance compared to using F alone.
This analysis was performed for F being: (a) T1 MRI features, (b) cognitive fea-190
tures, (c) FDG PET features. These were the features selected for the final general model as explained in 2.4.1, that have been used alone in at least 2 reported ments, and that have been used in combination with other features in at least 2 experi-ments as well. Cognitive features were not divided into subsets so as to study the effect of cognitive assessments as a whole.
195
3. Descriptive analysis
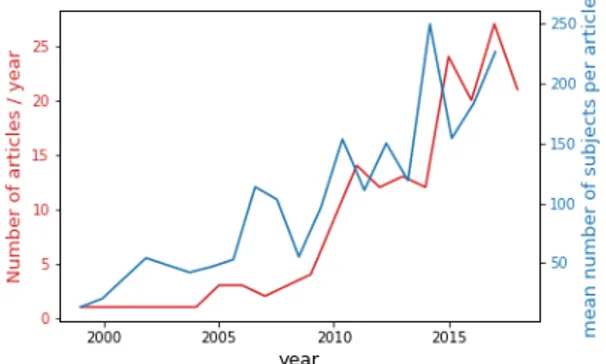
(a) Evolution of number of article per year and of the number of individuals per article
(b) Evolution of the AUC with time
Figure 1: Recent trends. (a) Evolution of number of article per year (in red) and of the number of individuals per article with time (in blue). (b) Evolution of the area under the ROC (receiver operating characteristic) curve (AUC) with time. The AUC of each article is represented by a dot. The AUC of articles published the same year is represented as box-plots. The plain line corresponds to the regression of the AUC against time
3.1. A recent trend
Figure 1a shows that the number of articles published each year on the prediction of the progression of MCI to AD dementia has been steadily increasing since 2010.
Figure 1a also shows that the number of individuals used for the experiments is 200
increasing over time (p= 10−5, slope of 12.15 subjects per year, R2=0.10). 84.6% of
articles used data of the Alzheimer’s Disease Neuroimaging Initiative (ADNI) study. Starting in 2004, this multicenter longitudinal study provides multiple modalities for the early detection of AD. As the recruitment of this largely used cohort is still ongoing, it is not surprising to see the number of included individuals increasing over the years. 205
Studies often select individuals with a minimal follow-up time, of 3 years for example, and over the years more and more MCI individuals from the ADNI cohort fulfill these criteria, so more individuals can be included.
As shown in Figure 1b, the reported AUC are also increasing over time (p= 0.045, slope of 1.15 points of AUC per year), which can have multiple explanations. First, as 210
new studies often compare their performance with those of previous methods, they tend to be published only when the obtained results seem competitive compared to previous ones. A more optimistic interpretation would be that algorithms tend to improve, and that newly available features might have a better predictive power. It has also been shown (Ansart et al., 2019; Domingos, 2012) that having a larger data set leads to a 215
higher performance, so there may be a link between the increase in data set size and the increase in performance.
3.2. Features
T1 MRI, cognition and socio-demographic features are used in respectively 69.2%, 43.2% and 33.8% of experiments. On the other hand, FDG PET, APOE and CSF 220
AD biomarkers are used in 15 to 20% of experiments, and the other studied features (white matter hyper-intensities, EEG, MEG, PET amyloid, amyloid binary status with-out considering the PET or CSF value, DTI and PET Tau) are used in fewer than 10% of experiments. No study using functional MRI has been identified.
Studies using T1 MRI mainly use selected regions of interest (46.8%), whereas 225
34.7% use the whole brain, separated into regions of interest, and 18.5% use voxel features. Studies using neuro-psychological tests mainly use aggregated tests evalu-ating multiple domains of cognition (51.2% of them), and 37.4% of them combine aggregated tests with domain-specific ones. Seven experiments use new or home-made cognitive tests. 35.7% of experiments use only T1 MRI (apart from socio-demographic 230
features), and 15% use cognition only.
The prevalence of T1 MRI does not seem surprising, as researchers working on automatic diagnosis often come from the medical imaging community, and T1 MRI is the most widely available modality. The prevalence of the imaging community can also explain the choice of cognitive features, and why more detailed and targeted cognitive 235
tests are not used as much as more general and more well-known ones. 3.3. Algorithm
Support vector machines (SVM) and logistic regressions are the most used algo-rithms, being used in respectively 32.6% and 15.0% of experiments. Among the ex-periments using an SVM, 63.2% use a non-linear kernel, 30.3% use a linear kernel and 240
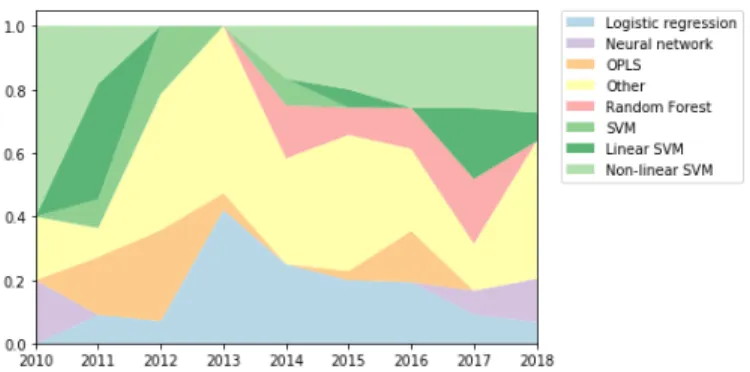
Figure 2: Evolution of the use of various algorithms with time. SVM with unknown kernel are simply noted as "SVM". OPLS: orthogonal partial least square; SVM: support vector machine
6.6% do not mention the used kernel. Other algorithms are used in fewer than 10% of cases. Figure 2 shows the evolution of the algorithm use over time.
The high proportion of methods using an SVM has already been shown for the prediction of the current diagnosis in Falahati et al. (2014) and Rathore et al. (2017), it is therefore not surprising that this algorithm is also commonly used for the prediction 245
of future diagnosis. We see that random forests started being used around 2014, but the proportion of methods using this algorithm, even recently, stays low compared to the proportion of methods using an SVM. Neural networks started being used during the last two years, as it can be seen in Figure 2, and we can assume the phenomenon has been too recent to be visible just yet in the field. Overall, even if the proportion 250
of SVM has been decreasing until 2013, the field has not been so prompt to use new algorithms as one could have expected. A possible explanation is that the choice of algorithm does not significantly impact performance.
3.4. Validation method
For evaluating their performance, 29.1 % of experiments use a 10-fold, and 12.8% 255
use a k-fold with k different from 10. Leave-one individual out is also quite popular, being used in 17.5% of cases. We noted that 7.3% of experiments were trained and tested on the same individuals, and 7.3% train the method on a first cohort and test it on a different one.
It should be kept in mind when comparing the performance of different studies that 260
the cross-validation methods can impact the performance. Using a larger training set and smaller test set is more favorable, hence the same method might result in a better performance when evaluated using a leave-one out validation than using a 10-fold val-idation, as shown in Lin et al. (2018). Bias and variance also vary across validation methods (Efron, 1983). Varoquaux et al. (2017) also studied the impact of the cross-265
validation strategy on a range of classification tasks performed on fMRI and MEG data sets, and showed that differences in performance tend to be smaller than the variance of the estimated performance using a cross-validation method, mitigating the impor-tance of the choice of cross-validation strategy. This study still warns against the use of leave-one-out validation, leading to less stable estimates.
Reporting variance or confidence intervals is an important best practice to compare results from different studies and experiments. We did not collect this information, and further work regarding the adoption of this practice could complete this study. 4. Performance analyses
Characteristic coeff. p-value correctedp-value numberof exp.
intercept 78 0 0 NA
linear model -0.47 0.79 0.94 23
generalized linear model 0.19 0.89 0.96 28
non linear model 0.83 0.55 0.79 50
T1 features 0.92 0.26 0.76 77
amyloid PET 1.3 0.35 0.79 5
FDG PET 2.6 0.023 0.13 24
white matter hyper-intensities -0.58 0.49 0.79 3
EEG/MEG 3.4 2.9∗10−03 0.029 5
general cognitive features -0.14 0.91 0.96 49
domain targeted cognitive features 2.6 0.026 0.13 25
new or specific cognitive features 0.89 0.52 0.79 2
socio-demographic features 1.2 0.43 0.79 43 APOE 2.27 0.049 0.19 26 biomarkers 0.75 0.39 0.79 19 other features 0.53 0.54 0.79 12 longitudinal 0.25 0.80 0.95 13 ADNI 0.011 0.99 0.99 106 number of subjects -0.39 0.76 0.94 NA individual intercept NA 0.072 0.24 NA
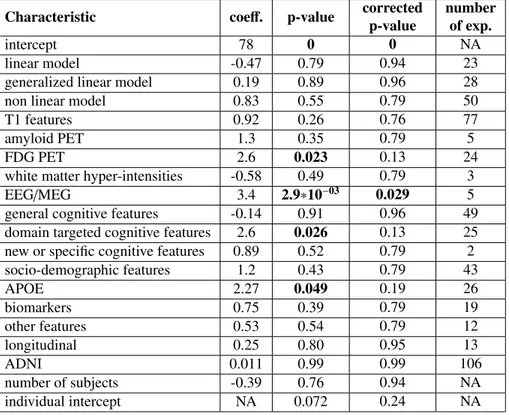
Table 1: Impact of method characteristics. This table shows the coefficients obtained using the linear mixed-effect model described in section 2.4.1 on all experiments, the associated p-values and corrected p-values. The last columns shows the number of experiments using the given characteristic, out of the 120 experi-ments included in the model. Benjamini-Hochberg procedure was applied to get corrected p-values. co-eff.:coefficient of the characteristics in the mixed effect model; FDG: fluorodeoxyglucose; PET: positron emission tomography; EEG: electroencephalography; MEG: magnetoencephalography; APOE: Apolipopro-tein E; ADNI: Alzheimer’s Disease Neuroimaging Initiative; NA: not applicable
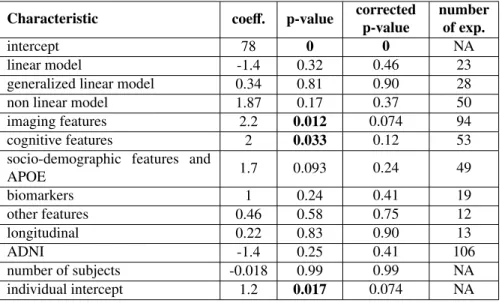
The results of the linear mixed-effect model used to model the AUC based on the 275
method characteristics are shown in Table 1, and the details of the intermediate models can be found in section Appendix A.4.1 of Supplementary Materials. The performance is significantly better when using EEG and MEG (coefficient=3.4, p=3∗10−3),
domain-targeted cognitive features (coefficient=2.6, p = 0.026), FDG PET (coefficient=2.2, p=0.023) or APOE (coefficient=2.3, p=0.049). The use of the ADNI cohort and of 280
longitudinal data are not shown to be significant. The impact of the algorithm type and of the number of subjects are not shown to be significant either.
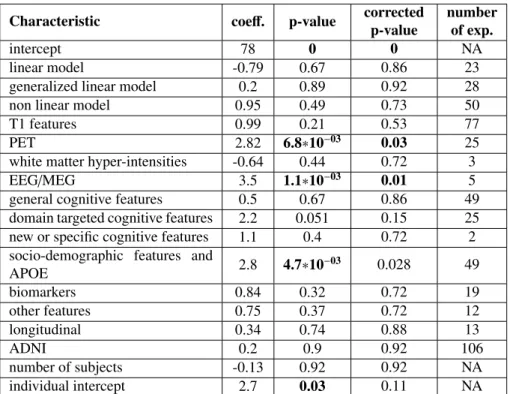
We also run the performance analysis using only the experiments performed on the ADNI cohort. The only characteristics with a significant impact on the AUC are the use of T1-ROI features (coefficient = 1.7, p=0.014) (and not the other T1-based features 285
which are regions based features on the whole brain and voxel-based features), FDG PET features (coefficient = 4.4, p < 1 ∗ 10−7) and domain-targeted cognitive features
(coefficient=2.4, p = 9∗10−3). The complete results can be found in section Appendix
A.4.2 of Supplementary Materials.
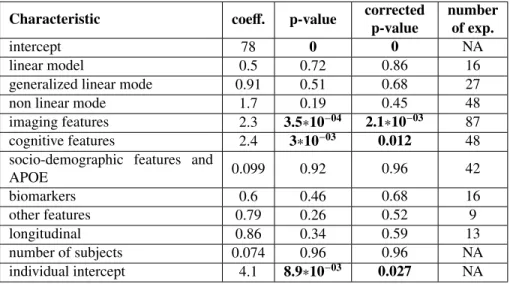
We considered the impact of using each feature alone compared to a combination 290
of them. It is significantly better to combine T1 MRI with other features than to use it solely (coefficient = 5.5, p = 9∗10−3). The effect is not significant for cognition
(coefficient=3.0, p=0.19) and FDG PET (coefficient = -6.1, p=0.38). 4.1. Cognition
Cognitive variables can be easily collected in clinical routine, at a low cost, and 295
they are proven to increase the performance of the methods, so their use should be encouraged. This finding is consistent with comparisons performed in several studies. Minhas et al. (2018); Kauppi et al. (2018); Ardekani et al. (2017); Tong et al. (2017); Gavidia-Bovadilla et al. (2017); Moradi et al. (2015); Hall et al. (2015); Fleisher et al. (2008) showed that using cognition and T1 MRI performed better than using T1 MRI 300
only. Dukart et al. (2015); Cui et al. (2011); Thung et al. (2018); Li et al. (2018) showed that adding cognition to other modalities also improved the results.
More surprisingly, we showed that using other modalities does not significantly improve the results compared to using cognition only. Although Fleisher et al. (2008) shows that using T1 MRI in addition to cognition does not improve the performance 305
compared to using cognition only, several studies show the opposite on various modali-ties (Samper-Gonzalez et al., 2019; Moradi et al., 2015; Ardekani et al., 2017; Li et al., 2018; Kauppi et al., 2018). However, when taking all studies into account, it appears that the improvement one gains by including other modalities along with cognitive variables is not significant. As the cost of collecting cognitive variables compared to 310
performing an MRI or a FDG PET is quite low, the non-significant improvement in performance might not be worth the cost, logistics and patient inconvenience arising from the collection of other modalities. Methods focusing on cognition only, such as proposed by Johnson et al. (2014), should therefore be further explored. Such meth-ods should include domain-specific cognitive scores, which have shown to increase the 315
performance.
4.2. Medical imaging and biomarkers
Imaging modalities are not as widely available as cognitive features, but they can represent a good opportunity to better understand the disease process by showing the changes that appear before the individuals progress to AD dementia.
320
Among the used imaging modalities, we showed that using FDG PET leads to a better performance. Using T1-ROI features also leads to a better performance on the ADNI experiments, but this effect is not significant when considering all experiments. All the experiments using T1 MRI are performed on the ADNI database, so one can assume the effect on performance is small and is diluted when considering all exper-325
experiments, the effect of using T1-ROI features is 2.6 times smaller than the effect of using FDG PET, and 1.45 times smaller than the effect of using cognitive features. We also showed that using T1 MRI features alone performs significantly worse than using other features as well. Over all, T1 MRI features should not be used alone and PET 330
images could represent a better alternative for the imaging community. Similar obser-vations have been made by Samper-Gonzalez et al. (2018). FDG PET was included as a supportive feature in AD diagnosis criteria in 2007 (Dubois et al., 2007), and al-though it was removed - along with structural MRI - from IWG-2 diagnostic criteria in 2014, Dubois et al. (2014) stressed that FDG PET can be useful to differentiate be-335
tween AD and other types of dementia and to measure disease progression. According to the model hypothesized in (Jack et al., 2010a) changes in FDG PET appear earlier in the AD process than changes in structural MRI, which has been corroborated by different quantitative studies (Chetelat et al., 2007; Reiman et al., 1998; Jagust et al., 2006). These changes might already be visible in MCI individuals several years before 340
their progression to AD, which can explain why FDG PET is more predictive of this progression.
Only one method using Tau PET has been identified in this review so we could not evaluate the impact on performance. This new modality should also be affected early in the disease process, and could therefore represent great hopes for the imaging com-345
munity. However, surprisingly, Amyloid PET or CSF value, which is also one of the earliest markers, did not have a significant impact on the prediction performance. Al-though amyloid load saturates several years before symptom onset (Jack et al., 2010b; Yau et al., 2015), several studies show that MCI individuals who are amyloid posi-tive are more likely to convert to dementia in the next 2 to 4 years than those who are 350
amyloid negative (Landau et al., 2012; Jack et al., 2010b; Okello et al., 2009). The use of EEG or MEG has a significant impact on the performance. However, only 5 experiments using these features were included in the model, it is therefore difficult to conclude if this effect is real, and if it is not due to methodological issues that have not been identified during the quality check.
355
4.3. Longitudinal data
Longitudinal data could give a better view of the evolution of the patient, and hence be more predictive of the progression to AD than cross-sectional data. Nonetheless, we did not find the use of longitudinal data to have a significant effect on the perfor-mance. Similar findings are reported in Aksman (2017) for the classification of AD 360
and in Schuster et al. (2015) for progressive diseases in general. Longitudinal analyses are more difficult to design in age-related diseases since there is no temporal marker of disease progression especially before diagnosis. Patients are also seen at different time-points and not all features are acquired at each visit, leading to many missing values. Methodologies for such designs are more exploratory than for cross-sectional 365
approaches (Schiratti et al., 2015; Venkatraghavan et al., 2019) 4.4. Algorithm
Table 1 shows that the choice of algorithm has no significant impact on perfor-mance. Even if non-linear models seem to be associated to a higher coefficient (0.83)
Characteristic coeff. p-value correctedp-value numberof exp.
intercept 78 0 0 NA
linear model -8.1 1∗10−03 5.5∗10−03 23
generalized linear model -3.7 0.12 0.25 28
non linear model -0.13 0.96 0.96 50
imaging features -1.6 0.42 0.52 94
cognitive features 2 0.028 0.073 53
socio-demographic features and
APOE 2.4 0.012 0.04 49 biomarkers 0.92 0.28 0.45 19 other features 0.87 0.31 0.45 12 longitudinal 0.35 0.72 0.82 13 ADNI -1.42 0.26 0.45 106 number of subjects -0.066 0.96 0.96 NA
interaction: linear model and
imaging features 7.85 5.8∗10−04 4.6∗10−03 19
interaction: generalized linear
model and imaging features 4.41 0.036 0.083 21
interaction: non linear model and
imaging features 2.13 0.41 0.52 38
individual intercept 2.27 8.6∗10−03 0.034 NA
Table 2: Impact of method characteristics, taking into account the interaction between the model type and the use of imaging features. This table shows the coefficients obtained using the linear mixed-effect model de-scribed in section 2.4.1 on all experiments, the associated p-values and corrected p-values. The last columns shows the number of experiments using the given characteristic, out of the 120 experiments included in the model. Benjamini-Hochberg procedure was applied to get corrected p-values. coeff.:coefficient of the char-acteristics in the mixed effect model; APOE: Apolipoprotein E; ADNI: Alzheimer’s Disease Neuroimaging Initiative; NA: not applicable
than linear and generalized linear models (-0.47 and 0.19 respectively), these coeffi-370
cients are far from significant.
The model displayed in Table 2 takes into account the interaction between the model choice and the usage of imaging features. These results show that linear models perform significantly worse than other models (coefficient=-8.11, p=0.001), however the interaction between linear models and imaging features is significantly positive 375
(coefficient = 7.85, p=0.0006); using imaging features therefore leads to a significant increase in performance when using a linear model. Similar conclusions can be drawn from the interaction between generalized linear model and imaging features (coeffi-cient = 4.41, p=0.04), whereas this effect is not significant for non-linear models (co-efficient=2.13, p=0.4). By combining the different coefficients, one can see that the 380
best results are obtained using non-linear models. In this case, the use of imaging feature does not significantly impact performance. A possible explanation is that linear models are more powerful and better leverage the information contained in non-imaging data, whereas linear and generalized-linear models have a lower performance on non-imaging data. They therefore benefit from the addition of imaging data, leading 385
to a performance similar to the one obtained using non-linear models. 4.5. Other methodological characteristics
One could expect the performance to increase when the data set size increases, however we find that the effect of the number of subjects is not significant (coefficient=-0.39, p=0.76). The impact of data set size is further investigated in 5.1.2.
390
The impact of using the ADNI data set is not significant (coefficient=0.011, p=0.995). This finding is mitigated by the fact that our results slightly vary when using all exper-iments or only the ADNI experiment. As only 14 included experexper-iments do not use the ADNI database it is difficult to estimate the impact of its usage independently from the other characteristics.
395
Although we used a hierarchical grouping of the variables in order to have more statistical power, few p-values and fewer corrected p-values are significant. This small number of significant effects means that the variance of the reported performance mea-sures is high compared to the effect sizes.
5. Design of the decision support system and methodological issues 400
5.1. Identified issues
5.1.1. Lack or misuse of test data
The lack of a test data set is observed in 7.3% of experiments. In 16% of articles using feature selection, it is performed on the whole data set, and 8% of articles do not describe this step well enough to draw conclusions. Other data leakage (use of the test 405
set for decision making) is identified in 8% of experiments, and is unclear for 4%. Overall, 26.5% of articles use the test set in the training process, to train the algo-rithm, choose the features or tune the parameters. This issue, and in particular perform-ing feature selection on the whole data set, has also been pointed out by Arbabshirani et al. (2017) in the context of brain disorder prediction.
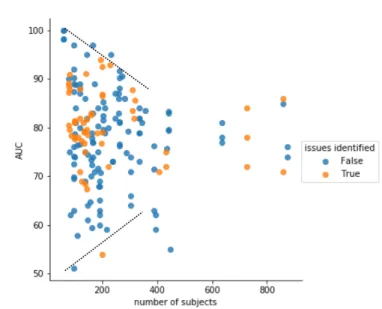
Figure 3: Relationship between the AUC (area under the ROC curve) and the number of individuals. The black dotted lines represent the upper and lower limits.
5.1.2. Performance as a function of data set size
We plotted the AUC against the number of individuals for each experiment in Fig-ure 3, with the colored dots representing experiments with identified issues. The col-ored dots show that there is a higher prevalence of studies with identified issues among high-performance studies: a methodological issue has been identified in 18.5% of ex-415
periments with an AUC below 75%, whereas this proportion rises to 36.4% for experi-ments with an AUC of 75% or higher (significant difference, with p = 0.006).
We can observe an upper-limit (shown in dashed line) decreasing when the num-ber of individuals increases, suggesting that high-performance achieved with a small number of subjects might be due to overfitting. This phenomenon has already been 420
identified by Arbabshirani et al. (2017) and Varoquaux (2018) regarding the use of neuroimaging for brain disorders.
A lower limit is also visible, with the AUC increasing with the number of individu-als. This may reflect the fact that, on average, methods generalize better when correctly trained on larger data sets. But it might also suggest that it is harder to publish a method 425
with a relatively low performance if it has been trained on a large number of subjects, such a paper being then considered as reporting a negative result. Within papers also, authors tend to focus on their best performing method, and rarely explain what they learned to achieve this. The machine learning field has the chance to have simple met-rics, such as AUC or accuracy, to compare different methods on an objective basis. 430
However, we believe that one should use such metrics wisely not to discourage the publication of innovative methodological works even if it does not yield immediately better prediction performance, and not to overshadow the need to better understand why some methods work better than others.
Figure 4: Evolution of the performance with respect to the time to prediction. Box plots represent the accuracy reported in the articles using ADNI included in this review. The straight line represents the accuracy that we computed by predicting that all MCI subjects remain MCI, that is the proportion of MCI subjects in ADNI who remain MCI at the follow-up visit. The shaded area corresponds to the 90% confidence interval. Although some papers in the literature use a sub-set of ADNI and not all ADNI, this plot still shows that results reported in the literature do not out-perform the naive constant prediction for time-to-predictions smaller than 3 years. This comparison is rarely done in the articles.
As the number of subjects increases, the two lines seem to converge to an AUC 435
of about 75%, which might represent the true performance for current state-of-the-art methods.
5.1.3. Use of features of test subjects
Feature embedding is performed on the whole data set in 6.8% of experiments, meaning that the features of the test individuals are used for feature embedding during 440
the training phase. As the diagnosis of the test individuals is often not used for feature embedding, as it is for feature selection, performing it on test individual can be consid-ered a less serious issue than for feature selection. It however requires to re-train the algorithm each time the prediction has to be made on a new individual, which is not suited for a use in clinical practice.
445
5.1.4. Use of the diagnosis date
In 5.6% of the experiments, the date of AD diagnosis is used to select the input visit of pMCI individuals, for training and testing. As explained in section 2.3, this practice can prevent the generalization of the method to the clinical practice, as the progression date of test individuals is by definition unknown.
450
This type of experiments answers the question "may one detect some characteristics in the data of a MCI patient 3 years before the diagnosis which, at the same time, is rarely present in stable MCI subjects?". Which should not be confused with: "can such characteristics predict that a MCI patient will progress to AD within the next 3 years". What misses to conclude about the predictive ability is to consider the MCI 455
subjects who have the found characteristics and count the proportion of them who will not develop AD within 3 years.
This confusion typically occurred after the publication of Ding et al. (2018). The paper attracted a great attention from general media, including a post on Fox News (Wooller,
2018), stating “Artificial intelligence can predict Alzheimer’s 6 years earlier than medics”. 460
However, the authors state in the paper that “final clinical diagnosis after all follow-up examinations was used as the ground truth label”, thus without any control of the follow-up periods that vary across subjects. Therefore, a patient may be considered as a true negative in this study, namely as a true stable MCI subject, whereas this subject may have been followed for less than 6 years. There is no guarantee that this subject is 465
not in fact a false negative for the prediction of diagnosis at 6 years. 5.1.5. Choice of time-to-prediction
We found that 22.6% of experiments work on separating pMCI from sMCI, regard-less of their time to progression to dementia. We advise against this practice, as the temporal horizon at which the individuals are likely to progress is an important infor-470
mation in clinical practice. Methods predicting the exact progression dates, such as what is asked in the Tadpole challenge (Marinescu et al., 2018), should be favored over methods predicting the diagnosis at a given date.
The other experiments have set a specific time to prediction, often between 1 and 3 years, meaning that they intend to predict the diagnosis of the individual at the end of 475
this time interval. Figure 4 shows the evolution of the accuracy of these methods tested on ADNI with respect to the time to prediction. The time to prediction did not have a significant effect on AUC, accuracy, balanced accuracy, specificity nor sensitivity. Figure 4 also shows the accuracy that one would get on ADNI when using a constant prediction, that is predicting that all individuals stay MCI at future time points. The 480
accuracy of this constant prediction has been computed using the proportion of MCI remaining stable at each visit. We show that most methods predicting the progression to AD within a short-term period smaller than 3 years do not perform better than this constant prediction. This finding is consistent with results from the Tadpole challenge (Marinescu et al., 2020), in which no participants significantly outperformed the con-485
stant prediction, to which a random noise was added, on prediction of cognitive scores within a 18 month period. We therefore advise to use a time to prediction of at least 3 years. For shorter time intervals the proportion of MCI individuals progressing to AD is so small that predicting that all individuals remain stable gives a better accuracy than most proposed methods.
490
This fact also shows that the accuracy may be arbitrarily increased by using a cohort with a large proportion of stable subjects. The algorithm may then yield high accuracy by mimicking a constant predictor. This effect may be alleviated by optimizing the balanced accuracy instead of the accuracy.
5.1.6. Problem formulation and data set choice 495
A common theme that arises from the previous issues is that the methods are not always designed to be the most useful in clinical practice. It is for example true of methods that do not use a specific time-to-prediction, or that use the date of AD diag-nosis to select the included visits.
More generally, we think the most useful decision support system should not only 500
focus on Alzheimer’s disease but perform differential diagnosis. Clinicians do not usually need to distinguish between individuals who will develop AD and individuals
who will not develop any neurological disorder. They most likely need help to deter-mine which disorder an MCI individual is likely to develop. Unfortunately, no widely available data set allows the development methods for differential diagnosis to date. 505
Methods focusing on AD should therefore target individuals who have already been identified as at risk of developing AD, by providing insight on the date at which this conversion is likely to happen. Such methods could be trained on MCI subjects that are at risk to develop Alzheimer’s disease, defined for instance as the ones who have a MMSE of 27 or smaller and are amyloid positive. In addition to being closer to what 510
can be expected in clinical practice, such data sets of at risk subjects should include a larger proportion of pMCI, leading to a better performance compared to the constant prediction. For example in ADNI, 71.6% of MCI subjects stay stable 2 years after inclusion, whereas this proportion drops to 53.7% for MCI subjects who are amyloid positive and have a MMSE of 27 or lower. Similarly, one should think carefully of 515
the possible other biases introduced by the selection of sMCI or pMCI sub-sets, for instance bias in age, gender or cognitive state. One choice is to match the two sub-sets for these factors. This choice is justified for the detection of the features that are spe-cific to the progressers and to the stable MCI. However, to analyze the performance of a decision support system, one should better reproduce the biases within the population 520
that will be tested by the system in a real case scenario.
The diagnosis of Alzheimer’s disease highly depends on the clinical practice, and varies greatly across sites and countries (Beach et al., 2012). Therefore, the short-term prediction of progression to Alzheimer’s disease is unlikely to generalize well outside the well controlled environment of a research study. Studies on clinical data sets, such 525
as performed in Archetti et al. (2019) regarding the prediction of current diagnosis, could assess how these methods would perform in clinical settings. An interesting alternative may be to predict the changes in the imaging or clinical biomarkers in time rather than the change in diagnosis, such as in Koval et al. (2020), Iddi et al. (2019) and Marinescu et al. (2020).
530
5.2. Need to adhere to best practice guidelines
Given the number of methodological issues that we found in the preparation of this review and that we have discussed above, we feel the need to list here several best practices recommendations.
We first list general guidelines to ensure best generalization of the method and limit 535
the risk for overfitting, following Hastie et al. (2009); Bishop (2006); Géron (2019); Poldrack et al. (2019):
• Separate train and test data sets by using independent cohorts or, if not available, cross-validation. Following Hastie et al. (2009); Varoquaux et al. (2017); Borra and Di Ciaccio (2010); Davison and Hinkley (1997); Kohavi (1995), guidelines 540
for best practices recommend to favor k-fold, repeated k-fold and repeated hold-out over leave-one-hold-out method.
• No element of the test data set, both labels and features, should be used except for performance evaluation. In particular, parameter tuning should not be performed on test data, therefore nested cross-validation or train, validation and test splits 545
• Use a large data set or pool different cohorts to obtain a large data set. Figure 3 shows that overfitting is reduced for more than 300 subjects, at which point the maximum AUC seems to stabilize. This is concordant with results from Arbab-shirani et al. (2017), showing a similar point around 200 subjects. Similarly, 550
Poldrack et al. (2019) recommends using data sets of at least several hundred subjects.
We also compile a list of guidelines to carefully design the experiments so that they could support the conclusion about the predictive performance of the method which, in this particular context, includes:
555
• pre-registration of the time window within which one aims to predict conversion to AD, as we show that performance may greatly vary depending on the time-window and that no conclusion could be drawn regarding the ability to predict the future without it,
• definition of data sets that best reflect the use of the method in the clinical prac-560
tice, for instance by selecting subjects that would be considered at risk of devel-oping the disease rather than all possible subjects in ADNI, or by using sex ratio, distribution of age, cognitive state and other similar factors that best mimic the population characteristics that will be tested by the system.
• systematic benchmark of the method against the prediction that the subjects will 565
remain stable over time, as we show that this naive method often outperforms proposed method with a time-to-prediction smaller than 3 years.
6. Conclusion
We conducted a systematic and quantitative review on the automatic prediction of the evolution of clinical status of MCI individuals. We reported results from 234 exper-570
iments coming from 111 articles. We showed that studies using cognitive variables or FDG PET reported significantly better results than studies that did not, and that includ-ing other feature types does not significantly improve performance compared to usinclud-ing cognition or FDG PET alone. These modalities should be further explored, cognition because it can be easily collected in clinical routine, and FDG PET for the interest it 575
might represent for the imaging community and for increasing our understanding of the disease. On the other hand, we showed that using solely T1 MRI yields a significantly lower performance, despite the great number of methods developed for this imaging modality. These findings call into question the role of imaging, and more particularly of MRI, for the prediction of the progression of MCI individuals to dementia. In light of 580
this review, we believe that one should give higher priority to other modalities. More specific cognitive tests could be created, and the impact of using digitized tests, that can be frequently used at home by the patients themselves, should be studied. The creation of digitized tests for clinical routine, such as proposed by Souillard-Mandar et al. (2016); Müller et al. (2017); Schinle et al. (2018) is a first step in this direction. 585
We identified several key points that should be checked when creating a method which aims at being used as a clinical decision support. When possible, an indepen-dent test set should be used to evaluate the performance of the method, otherwise a test
set can be separated by carefully splitting the cohort. In any case, the test individuals should not be used to make decisions regarding the method, such as the selection of 590
the features or parameter tuning. The time window in which one aims at predicting the progression to AD should be pre-registered, as the temporal horizon at which an indi-vidual is likely to progress to AD is a useful information for clinicians. Alzheimer’s disease being a very slowly progressive disease, algorithm performance should be sys-tematically compared with the prediction that no change will occur in the future. We 595
have shown indeed that the constant prediction may yield very high performance de-pending on the time frame of the prediction and the composition of the cohort. Finally, the cohort on which the method is tested should be carefully chosen and defined, so as to reflect the future use in clinical practice as best as possible. We noticed that there is often a confusion between two different objectives : understanding the specificities 600
of subjects who will or will not convert to dementia on the one hand, and predicting the progression to dementia on the other hand. Experiments are often designed to ad-dress the first objective, but results are then misinterpreted in relation with the second objective. Addressing each objective requires indeed a rather different experimental design.
605
Following the guidelines will help to design better systems that would eventually lead to similar results in real life. In any case, the final evaluation of such systems will be done in a prospective manner, either in the framework of a challenge like the TAD-POLE challenge (Marinescu et al., 2018, 2019, 2020), or even better in a prospective clinical trial (Bruun et al., 2019).
610
This review focused on the prediction of progression to dementia, as this problem has, by far, attracted most attention from the scientific community. Nevertheless, pre-dicting the future values of the biomarkers or the images may be of greater interest for such clinical decision support systems to be adopted in practice (Marinescu et al., 2020; Koval et al., 2020; Ansart, 2019).
615
Acknowledgements
Federica Cacciamani, Baptiste Couvy-Duchesne, Pascal Lu and Wen Wei partici-pated in reading articles to conduct this review.
We thank the reviewers for their insightful comments that helped us to improve the manuscript, including Gaël Varoquaux who purposely disclosed his name.
620
The research leading to these results has received funding from the program “In-vestissements d’avenir” ANR-10-IAIHU-06 (Agence Nationale de la Recherche-10-IA Institut Hospitalo-Universitaire-6) from the European Union H2020 program (project EuroPOND, grant number 666992, project HBP SGA1 grant number 720270), from the ICM Big Brain Theory Program (project DYNAMO, project PredictICD), from 625
the Inria Project Lab Program (project Neuromarkers), from the European Research Council (to Dr Durrleman project LEASP, grant number 678304), from the Abeona Foundation (project Brain@Scale). OC is supported by a "contrat d’interface local" from AP-HP. China Scholarship Council supports J.W’s work on this topic.
Data used in preparation of this article were obtained from the Alzheimer’s Dis-630
ease Neuroimaging Initiative (ADNI) database (adni.loni.usc.edu). As such, the in-vestigators within the ADNI contributed to the design and implementation of ADNI
and/or provided data but did not participate in analysis or writing of this report. A complete listing of ADNI investigators can be found at: http://adni.loni.usc.edu/wp-content/uploads/how_to_apply/ADNI_Acknowledgement_List.pdf
635
References
Aksman, L.M., 2017. Longitudinal neuroimaging features for discriminating early neurodegeneration. Ph.D. thesis. King’s College London.
Ansart, M., 2019. Design of data driven decision support systems for the early detection of subjects at risk to develop Alzheimer’s disease. phdthesis. Sorbonne Université. 640
URL: https://tel.archives-ouvertes.fr/tel-02425735.
Ansart, M., Epelbaum, S., Gagliardi, G., Colliot, O., Dormont, D., Dubois, B., Ham-pel, H., Durrleman, S., for the Alzheimer’s Disease Neuroimaging Initiative* and the INSIGHT-preAD study, 2019. Reduction of recruitment costs in preclinical AD trials: validation of automatic pre-screening algorithm for brain amyloido-645
sis. Statistical Methods in Medical Research , 0962280218823036doi:10.1177/ 0962280218823036.
Arbabshirani, M.R., Plis, S., Sui, J., Calhoun, V.D., 2017. Single subject prediction of brain disorders in neuroimaging: Promises and pitfalls. NeuroImage 145, 137–165. doi:10.1016/j.neuroimage.2016.02.079.
650
Archetti, D., Ingala, S., Venkatraghavan, V., Wottschel, V., Young, A.L., Bellio, M., Bron, E.E., Klein, S., Barkhof, F., Alexander, D.C., Oxtoby, N.P., Frisoni, G.B., Redolfi, A., 2019. Multi-study validation of data-driven disease progression models to characterize evolution of biomarkers in Alzheimer’s disease. NeuroImage: Clin-ical 24, 101954. URL: http://www.sciencedirect.com/science/article/ 655
pii/S2213158219303043, doi:10.1016/j.nicl.2019.101954.
Ardekani, B.A., Bermudez, E., Mubeen, A.M., Bachman, A.H., 2017. Prediction of In-cipient Alzheimer’s Disease Dementia in Patients with Mild Cognitive Impairment. Journal of Alzheimer’s Disease 55, 269–281. doi:10.3233/JAD-160594.
Beach, T.G., Monsell, S.E., Phillips, L.E., Kukull, W., 2012. Accuracy of the Clin-660
ical Diagnosis of Alzheimer Disease at National Institute on Aging Alzheimer’s Disease Centers, 2005–2010. Journal of Neuropathology and Experimental Neu-rology 71, 266–273. URL: https://www.ncbi.nlm.nih.gov/pmc/articles/ PMC3331862/, doi:10.1097/NEN.0b013e31824b211b.
Bishop, C.M., 2006. Pattern recognition and machine learning. Information science 665
and statistics, Springer, New York.
Borra, S., Di Ciaccio, A., 2010. Measuring the prediction error. A
com-parison of cross-validation, bootstrap and covariance penalty methods.
Computational Statistics & Data Analysis 54, 2976–2989. URL: http:
//www.sciencedirect.com/science/article/pii/S0167947310001064, 670
Bruun, M., Frederiksen, K.S., Rhodius-Meester, H.F.M., Baroni, M., Gjerum, L., Koikkalainen, J., Urhemaa, T., Tolonen, A., van Gils, M., Rueckert, D., Dyremose, N., Andersen, B.B., Lemstra, A.W., Hallikainen, M., Kurl, S., Herukka, S.K., Remes, A.M., Waldemar, G., Soininen, H., Mecocci, P., 675
van der Flier, W.M., Lötjönen, J., Hasselbalch, S.G., 2019. Impact of a
clinical decision support tool on prediction of progression in early-stage de-mentia: a prospective validation study. Alzheimer’s Research & Therapy
11, 25. URL: https://alzres.biomedcentral.com/articles/10.1186/
s13195-019-0482-3, doi:10.1186/s13195-019-0482-3. 680
Chetelat, G., Desgranges, B., Landeau, B., Mezenge, F., Poline, J.B., de la Sayette, V., Viader, F., Eustache, F., Baron, J.C., 2007. Direct voxel-based comparison be-tween grey matter hypometabolism and atrophy in Alzheimer’s disease. Brain 131, 60–71. URL: https://academic.oup.com/brain/article-lookup/doi/10. 1093/brain/awm288, doi:10.1093/brain/awm288.
685
Cui, Y., Liu, B., Luo, S., Zhen, X., Fan, M., Liu, T., Zhu, W., Park, M., Jiang, T., Jin, J.S., Initiative, t.A.D.N., 2011. Identification of Conversion from Mild Cognitive Impairment to Alzheimer’s Disease Using Multivariate Predictors. PLOS ONE 6, e21896. doi:10.1371/journal.pone.0021896.
Davison, A.C., Hinkley, D.V., 1997. Bootstrap methods and their application. vol-690
ume 1. Cambridge university press.
Ding, Y., Sohn, J.H., Kawczynski, M.G., Trivedi, H., Harnish, R., Jenkins, N.W., Li-tuiev, D., Copeland, T.P., Aboian, M.S., Mari Aparici, C., Behr, S.C., Flavell, R.R., Huang, S.Y., Zalocusky, K.A., Nardo, L., Seo, Y., Hawkins, R.A., Hernandez Pam-paloni, M., Hadley, D., Franc, B.L., 2018. A Deep Learning Model to Predict a Di-695
agnosis of Alzheimer Disease by Using 18f-FDG PET of the Brain. Radiology 290, 456–464. URL: https://pubs.rsna.org/doi/10.1148/radiol.2018180958, doi:10.1148/radiol.2018180958.
Domingos, P., 2012. A few useful things to know about machine learning. Communi-cations of the ACM 55, 78. doi:10.1145/2347736.2347755.
700
Dubois, B., Feldman, H.H., Jacova, C., Dekosky, S.T., Barberger-Gateau, P., Cum-mings, J., Delacourte, A., Galasko, D., Gauthier, S., Jicha, G., Meguro, K., O’brien, J., Pasquier, F., Robert, P., Rossor, M., Salloway, S., Stern, Y., Visser, P.J., Scheltens, P., 2007. Research criteria for the diagnosis of Alzheimer’s dis-ease: revising the NINCDS-ADRDA criteria. The Lancet. Neurology 6, 734–746. 705
doi:10.1016/S1474-4422(07)70178-3.
Dubois, B., Feldman, H.H., Jacova, C., Hampel, H., Molinuevo, J.L., Blennow, K., DeKosky, S.T., Gauthier, S., Selkoe, D., Bateman, R., Cappa, S., Crutch, S., En-gelborghs, S., Frisoni, G.B., Fox, N.C., Galasko, D., Habert, M.O., Jicha, G.A., Nordberg, A., Pasquier, F., Rabinovici, G., Robert, P., Rowe, C., Salloway, S., 710
Sarazin, M., Epelbaum, S., Souza, L.C.d., Vellas, B., Visser, P.J., Schneider, L., Stern, Y., Scheltens, P., Cummings, J.L., 2014. Advancing research diagnostic crite-ria for Alzheimer’s disease: the IWG-2 critecrite-ria. The Lancet Neurology 13, 614–629.
URL: http://www.thelancet.com/journals/laneur/article/PIIS1474-4422(14)70090-0/abstract, doi:10.1016/S1474-4422(14)70090-0. 715
Dukart, J., Sambataro, F., Bertolino, A., 2015. Accurate prediction of conversion to Alzheimer’s disease using imaging, genetic, and neuropsychological biomarkers. Journal of Alzheimer’s Disease 49, 1143–1159. doi:10.3233/JAD-150570. 00022. Efron, B., 1983. Estimating the Error Rate of a Prediction Rule: Improvement on Cross-Validation. Journal of the American Statistical Association 78, 316–331. 720
doi:10.1080/01621459.1983.10477973.
Falahati, F., Westman, E., Simmons, A., 2014. Multivariate Data Analysis and Machine Learning in Alzheimer’s Disease with a Focus on Structural Magnetic Resonance Imaging. Journal of Alzheimer’s Disease 41, 685–708. doi:10.3233/JAD-131928. Fleisher, A., Sun, S., Taylor, C., Ward, C., Gamst, A., Petersen, R., Jack, C., Aisen, 725
P., Thal, L., 2008. Volumetric MRI vs clinical predictors of Alzheimer disease in mild cognitive impairment. Neurology 70, 191–199. doi:10.1212/01.wnl. 0000287091.57376.65. 00178.
Gavidia-Bovadilla, G., Kanaan-Izquierdo, S., Mataroa-Serrat, M., Perera-Lluna, A., 2017. Early prediction of Alzheimer’s disease using null longitudinal model-based 730
classifiers. PLoS ONE 12. doi:10.1371/journal.pone.0168011.
Géron, A., 2019. Hands-On Machine Learning with Scikit-Learn and TensorFlow: Concepts, Tools, and Techniques to Build Intelligent Systems. O’reilly media ed. Hall, A., Mattila, J., Koikkalainen, J., Lötjonen, J., Wolz, R., Scheltens, P., Frisoni,
G., Tsolaki, M., Nobili, F., Freund-Levi, Y., Minthon, L., Frölich, L., Hampel, H., 735
Visser, P., Soininen, H., 2015. Predicting progression from cognitive impairment to alzheimer’s disease with the disease state index. Current Alzheimer Research 12, 69–79. doi:10.2174/1567205012666141218123829.
Haller, S., Lovblad, K.O., Giannakopoulos, P., 2011. Principles of Classification Analyses in Mild Cognitive Impairment (MCI) and Alzheimer Disease. Journal of 740
Alzheimer’s Disease 26, 389–394. doi:10.3233/JAD-2011-0014.
Hastie, T., Tibshirani, R., Friedman, J., 2009. The Elements of Statistical Learning: Data Mining, Inference, and Prediction, Second Edition. Springer Series in Statis-tics. 2 ed., Springer-Verlag, New York. URL: https://www.springer.com/gp/ book/9780387848570, doi:10.1007/978-0-387-84858-7.
745
Iddi, S., Li, D., Aisen, P.S., Rafii, M.S., Thompson, W.K., Donohue, M.C., for the Alzheimer’s Disease Neuroimaging Initiative, 2019. Predicting the course of Alzheimer’s progression. Brain Informatics 6, 6. URL: https://doi.org/10. 1186/s40708-019-0099-0, doi:10.1186/s40708-019-0099-0.
Jack, C.R., Knopman, D.S., Jagust, W.J., Shaw, L.M., Aisen, P.S., Weiner, M.W., Pe-750
tersen, R.C., Trojanowski, J.Q., 2010a. Hypothetical model of dynamic biomarkers of the Alzheimer’s pathological cascade. Lancet neurology 9, 119. doi:10.1016/ S1474-4422(09)70299-6.
Jack, C.R., Wiste, H.J., Vemuri, P., Weigand, S.D., Senjem, M.L., Zeng, G., Bern-stein, M.A., Gunter, J.L., Pankratz, V.S., Aisen, P.S., Weiner, M.W., Petersen, 755
R.C., Shaw, L.M., Trojanowski, J.Q., Knopman, D.S., Alzheimer’s Disease Neu-roimaging Initiative, 2010b. Brain beta-amyloid measures and magnetic reso-nance imaging atrophy both predict time-to-progression from mild cognitive im-pairment to Alzheimer’s disease. Brain: A Journal of Neurology 133, 3336–3348. doi:10.1093/brain/awq277.
760
Jagust, W., Gitcho, A., Sun, F., Kuczynski, B., Mungas, D., Haan, M., 2006. Brain imaging evidence of preclinical Alzheimer’s disease in normal aging. Annals of Neurology 59, 673–681. URL: http://doi.wiley.com/10.1002/ana.20799, doi:10.1002/ana.20799.
Johnson, P., Vandewater, L., Wilson, W., Maruff, P., Savage, G., Graham, P., Macaulay, 765
L., Ellis, K., Szoeke, C., Martins, R., Rowe, C., Masters, C., Ames, D., Zhang, P., 2014. Genetic algorithm with logistic regression for prediction of progression to Alzheimer’s disease. BMC Bioinformatics 15. doi:10.1186/1471-2105-15-S16-S11. 00027.
Kauppi, K., Fan, C., McEvoy, L., Holland, D., Tan, C., Chen, C.H., Andreassen, O., 770
Desikan, R., Dale, A., 2018. Combining polygenic hazard score with volumetric MRI and cognitive measures improves prediction of progression from mild cognitive impairment to Alzheimer’s disease. Frontiers in Neuroscience 12. doi:10.3389/ fnins.2018.00260.
Kohavi, R., 1995. A Study of Cross-validation and Bootstrap for Accuracy Estimation 775
and Model Selection, in: Proceedings of the 14th International Joint Conference on Artificial Intelligence - Volume 2, Morgan Kaufmann Publishers Inc., San Fran-cisco, CA, USA. pp. 1137–1143. URL: http://dl.acm.org/citation.cfm? id=1643031.1643047.
Koval, I., Bône, A., Louis, M., Bottani, S., Marcoux, A., Samper-Gonzalez, J., Bur-780
gos, N., CHARLIER, B., Bertrand, A., Epelbaum, S., Colliot, O., Allassonnière, S., Durrleman, S., 2020. Simulating Alzheimer’s disease progression with personalised digital brain models. URL: https://hal.inria.fr/hal-01964821.
Landau, S.M., Mintun, M.A., Joshi, A.D., Koeppe, R.A., Petersen, R.C., Aisen, P.S., Weiner, M.W., Jagust, W.J., 2012. Amyloid deposition, hypometabolism, 785
and longitudinal cognitive decline. Annals of Neurology 72, 578–586. URL: http://onlinelibrary.wiley.com/doi/abs/10.1002/ana.23650, doi:10. 1002/ana.23650.
Leandrou, S., Petroudi, S., Kyriacou, P., Reyes-Aldasoro, C., Pattichis, C., 2018. Quan-titative MRI Brain Studies in Mild Cognitive Impairment and Alzheimer’s Disease: 790
A Methodological Review. IEEE Reviews in Biomedical Engineering 11, 97–111. doi:10.1109/RBME.2018.2796598.
Li, Y., Yao, Z., Zhang, H., Hu, B., for, t.A.D.N.I., 2018. Indirect relation based indi-vidual metabolic network for identification of mild cognitive impairment. Journal of Neuroscience Methods 309, 188–198. doi:10.1016/j.jneumeth.2018.09.007. 795
Lin, W., Tong, T., Gao, Q., Guo, D., Du, X., Yang, Y., Guo, G., Xiao, M., Du, M., Qu, X., 2018. Convolutional neural networks-based MRI image analysis for the Alzheimer’s disease prediction from mild cognitive impairment. Frontiers in Neu-roscience 12. doi:10.3389/fnins.2018.00777.
Marinescu, R.V., Oxtoby, N.P., Young, A.L., Bron, E.E., Toga, A.W., Weiner, M.W., 800
Barkhof, F., Fox, N.C., Eshaghi, A., Toni, T., Salaterski, M., Lunina, V., Ansart, M., Durrleman, S., Lu, P., Iddi, S., Li, D., Thompson, W.K., Donohue, M.C., Nahon, A., Levy, Y., Halbersberg, D., Cohen, M., Liao, H., Li, T., Yu, K., Zhu, H., Tamez-Pena, J.G., Ismail, A., Wood, T., Bravo, H.C., Nguyen, M., Sun, N., Feng, J., Yeo, B.T.T., Chen, G., Qi, K., Chen, S., Qiu, D., Buciuman, I., Kelner, A., Pop, R., Rimocea, 805
D., Ghazi, M.M., Nielsen, M., Ourselin, S., Sorensen, L., Venkatraghavan, V., Liu, K., Rabe, C., Manser, P., Hill, S.M., Howlett, J., Huang, Z., Kiddle, S., Mukherjee, S., Rouanet, A., Taschler, B., Tom, B.D.M., White, S.R., Faux, N., Sedai, S., Oriol, J.d.V., Clemente, E.E.V., Estrada, K., Aksman, L., Altmann, A., Stonnington, C.M., Wang, Y., Wu, J., Devadas, V., Fourrier, C., Raket, L.L., Sotiras, A., Erus, G., Doshi, 810
J., Davatzikos, C., Vogel, J., Doyle, A., Tam, A., Diaz-Papkovich, A., Jammeh, E., Koval, I., Moore, P., Lyons, T.J., Gallacher, J., Tohka, J., Ciszek, R., Jedynak, B., Pandya, K., Bilgel, M., Engels, W., Cole, J., Golland, P., Klein, S., Alexander, D.C., 2020. The Alzheimer’s Disease Prediction Of Longitudinal Evolution (TADPOLE) Challenge: Results after 1 Year Follow-up. arXiv:2002.03419 [q-bio, stat] URL: 815
http://arxiv.org/abs/2002.03419. arXiv: 2002.03419.
Marinescu, R.V., Oxtoby, N.P., Young, A.L., Bron, E.E., Toga, A.W., Weiner, M.W., Barkhof, F., Fox, N.C., Golland, P., Klein, S., Alexander, D.C., 2019. TAD-POLE Challenge: Accurate Alzheimer’s Disease Prediction Through Crowdsourced Forecasting of Future Data, in: Rekik, I., Adeli, E., Park, S.H. (Eds.), Predic-820
tive Intelligence in Medicine, Springer International Publishing, Cham. pp. 1–10. doi:10.1007/978-3-030-32281-6_1.
Marinescu, R.V., Oxtoby, N.P., Young, A.L., Bron, E.E., Toga, A.W., Weiner, M.W., Barkhof, F., Fox, N.C., Klein, S., Alexander, D.C., Consortium, t.E., Initiative, f.t.A.D.N., 2018. TADPOLE Challenge: Prediction of Longitudinal Evolution in 825
Alzheimer’s Disease. arXiv preprint arXiv:1805.03909 .
Minhas, S., Khanum, A., Riaz, F., Khan, S., Alvi, A., 2018. Predicting progression from mild cognitive impairment to Alzheimer’s disease using autoregressive mod-elling of longitudinal and multimodal biomarkers. IEEE Journal of Biomedical and Health Informatics 22, 818–825. doi:10.1109/JBHI.2017.2703918.
830
Moradi, E., Pepe, A., Gaser, C., Huttunen, H., Tohka, J., 2015. Machine learning framework for early MRI-based Alzheimer’s conversion prediction in MCI subjects. NeuroImage 104, 398–412. doi:10.1016/j.neuroimage.2014.10.002.
Müller, S., Preische, O., Heymann, P., Elbing, U., Laske, C., 2017.
In-creased Diagnostic Accuracy of Digital vs. Conventional Clock Drawing Test 835
for Discrimination of Patients in the Early Course of Alzheimer’s Disease