A COMPARATIVE ANALYSIS OF NAVAL HYDROFOIL AND DISPLACEMENT SHIP DESIGN
by
JOHN LARSEN GROSTICK B.S., U.S. Naval Academy
(1966)
Submitted in Partial Fulfillment of the Requirement for the Degree of
NAVAL ARCHITECT and the Degree of
MASTER OF SCIENCE IN NAVAL ARCHITECTURE AND MARINE ENGINEERING at the
MASSACHUSETTS INSTITUTE OF TECHNOLOGY June, 1975
Signature of Author
J'5 Department of Ocean Engineering
May 9, 1975
Certified by
C/
bThesis
Supervisor
An ,
Accepted by , , _.
(C
Chairman, Departmental Committee on Graduate Students ARCHIVESA COMPARATIVE ANALYSIS OF NAVAL HYDROFOIL AND DISPLACEMENT SHIP DESIGN
by
JOHN LARSEN GROSTICK
Submitted to the Department of Ocean Engineering on 9 May 1975 in partial fulfillment of the requirements for the degree of Naval Architect and the degree of Master of Science in Naval Architecture and Marine Engineering.
ABSTRACT
The current generation of naval hydrofoils have higher speeds, superior seakeeping performance and the same payload carrying capability as naval displacement ships of the same
size. This performance is the result of significant differences in areas other than the foil system. By comparing a hydrofoil and a displacement ship, differences in design criteria,
standards and practices can be identified. Having identified the major differences, the displacement ship can be redesigned to hydrofoil standards. With both a hydrofoil and a
dis-placement ship designed to the same standards, the impact of the hydrofoil's design standards on a displacement ship can be assessed, and the costs and benefits of a hydrofoil when compared to a displacement ship designed to the same standards can be evaluated.
Thesis Supervisor: Clark Graham
ACKNOWLEDGEMENTS
I wish to express my thanks to Professor Clark Graham who provided the impetus to pursue this topic and acted as a sounding board for the work as it proceeded to completion. A note of thanks also goes to the many kind individuals at the Naval Ship Engineering Center, and Naval Ship Research and Development Center who made time in their schedules to provide me with the insight they have gained through the design of the current generation of hydrofoils. To my unflinching typist, Mrs. Sandy Margeson, goes my special thanks for her patience in translating this into a legible manuscript.
To my wife and sons goes the greatest measure of thanks for the understanding and patience they have had during these three years when they have had to compete with my studies for time and attention.
TABLE OF CONTENTS ABSTRACT . . . 2
ACKNOWLEDGEMENTS
...
TABLE: OF CONTENTS . . . 4 LIST OF FIGURES. ... . 6... 6 LIST OF TABLES ... 8 CHAPTER 1 INTRODUCTION . . . 9CHAPTER 2 CHARACTERISTICS OF HIGH PERFORMANCE
SHIPS . . . ... 13
Section 2.1 Hydrodyanmic Aspects of High
Speed Ships . . . ... 13
Section 2.2 The Impact of Weight and Volume . 15 Section 2.3 Hydrofoil Design Criteria and
Standards .. . . . 25
CHAPTER 3 A COMPARATIVE ANALYSIS OF NAVAL
HYDROFOILS AND DISPLACEMENT SHIPS . . 28
Section 3.1 Selection of Ships . . . 28
Section 3.2 Method of Analysis . . . 31
Section 3.3 Computer Model . . . 39
3.3.1 Objective of the Computer
Model . . . 41
3.3.2 Description of the Computer
Model . . . 41
3.3.2.1 Weight Algorithm . 42 3.3.2.2 Volume Algorithm . 47 3.3.3 Limitations of the Model . 49 Section 3.4 A Comparative Analysis of a Small
Hydrofoil and A Planning Craft . 50 3.4.1 Analysis of PHM and PG-84 . 50 3.4.2 Comparison of PHM and
PG-84 . . . ... 55
3.4.3 Redesign of PG-84 to PHM
Standards . . . ... 59
3.4.4 Sensitivity Analysis of the
Redesigned PG-84 . . . 66
3.4.5 Summary of the Analysis of
Section 3.5 A Comparative Analysis of A Large Hydrofoil and A Displacement Ship 3.5.1 Analysis of DEH and FFG-7 3.5.2 Comparison of DEH and
FFG-7 . . . .
3.5.3 Redesign of a High Speed Displacement Hull Form to DEH Standards ...
3.5.4 Sensitivity Analysis of the High Speed Displacement Hull Form ...
3.5.5 Summary of the Analysis of DEH and FFG-7 CHAPTER 4 CHAPTER 5 REFERENCES . APPENDICES CONCLUSIONS . . . . RECOMMENDATIONS . . . .
APPENDIX A SHIP DATA . . . .
APPENDIX B POWERING ESTIMATES ....
APPENDIX C COMPUTER PROGRAM LISTING .
. . . 104 . . . . ... .1 11 71 71 80 88 89 92 94 95 97 71
LIST OF FIGURES
FIGURE TITLE PAGE
1 The Sustention Triangle . . . .. 11
2 Speed Capabilities in Head Seas for Various
Types of Ships ... 16 3 Weight Trend For Hydrofoil Lift Systems ... 18 4 Ship Structural Weight Relationships . . . 20 5 Machinery Weight Fraction Relationship to
Propulsion Plant Specific Weight . . . ... 24
6 Brequet Range Correction Based on Fuel Fraction . 46
7 Computer Model Flow Chart .. . . . .. 48
8 PG-84 - PHM Comparative Weight Fraction Analysis. 51
9 PG-84 - PHM Comparative Volume Fraction Analysis. 52
10-11 PG-84 - PHM Specific Parameters . . . .. 53
12 Comparative Weight Fractions for Upgraded PG-84 . 63 13 Comparative Volume Fractions for Upgraded PG-84 . 64 14 Sensitivity Analysis of Upgraded PG-84 to
Single Parameter Changes . . . ... 67
15 Sensitivity Analysis of Upgraded PG-84 to
Multiple Parameter Changes . . . ... 69
16 DEH - FFG-7 Comparative Weight Fraction Analysis. 72 17 DEH - FFG-7 Comparative Volume Fraction Analysis. 73 18-19 DEH - FFG-7 Specific Parameters. .. .... 74
20 Upgraded FFG-7 Comparisons . . . ... 82
21 Comparative Weight Fractions for Series 64
and DEH . . . 86
22 Comparative Volume Fractions for Series 64
23 Sensitivity Analysis of Series 64 Hull Form . . . 90 B-1 FFG-7 Shaft Horsepower Estimate at High Speeds . 110
LIST OF TABLES TITLE Ship's Characteristics . . . . Weight Classification . . . . Volume Classification . . . . Specific Parameters . . . .
Performance Requirements and Parameters for
Upgraded PG-84 . . . .
Upgraded PG-84 Weight and Volume Estimate Performance Requirements and Parameters for
Upgraded FFG-7 . . . .
Performance Requirements and Parameters for
Series 64 Hull Form . . . .
Series 64 Weight and Volume Estimate . . . .
PG-84 Weight and Volume Data . . . .
PHM Weight and Volume Data . . . .
DEH Weight and Volume Data . . . .
FFG-7 Weight and Volume Data . . . .
PAGE * . . 32 . . . 35 . . . 38 . . . 40 . . . 60 . . . 62 . . . 81 . . . 84 . . . 85 · . . 98 . . .100 . . .101 . . .102 TABLE 1 2 3 4 5 6 7 8 9 A-1 A-2 A-3 A-4
CHAPTER 1 INTRODUCTION
The technological advances of the past two decades have brought the hydrofoil from its infancy to full development as a naval combatant. The hydrofoil is the first of the class of high performance ships to reach this stage of development. The trend toward larger and slower naval
combatants, which has been observed in the area of displace-ment ships, has been reversed by the hydrofoil. The speed
capabilities of the hydrofoil place it in the class of high performance ships while its small size reverses the size trend offering with it the economies inherent with reduced size.
The objective of this analysis is to determine the design criteria and standards which have made the hydrofoil a feasible ship and to make an estimate of the characteristics of a displacement hull form of similar size with the hydro-foil's design criteria and standards. With the hydrofoil and displacement ship having the same design criteria and standards, imposing the same performance requirements in areas such as speed and endurance allows the evaluation of the positive and negative aspects of the hydrofoil and the displacement ship on an equal basis.
Classifying hydrofoils as a high performance ship requires identifying the relationships between different types of ships or vehicles. Jewel in reference 1 presented
a method of categorizing vehicles by the identification of the supporting force or sustention. This method is conven-ient for it characterizes all vehicles operating at the air-water interface by some combination of three forms of
sustension.
Unpowered Static Lift Powered Dynamic Lift Powered Static Lift
This can be presented in the form of an equilateral triangle with the three forms of sustention at the vertices as shown
in Figure 1. This figure provides an insight into the nature of the current generation of high performance vehicles, for
they rely upon powered lift for their primary means of
sustention. Hydrofoils are an example of the powered dynamic lift type vehicle and hovercraft are an example of the
powered static lift type vehicle. Unpowered static lift is characteristic of large displacement type ships. However,
small displacement ships such as planning craft generate dynamic lift forces at high speeds and are not solely static lift vehicles at these speeds.
For this analysis two basic types of vehicles will be examined. In the high performance ship category, the hydro-foil will be used. High performance in this context will mean a vehicle with its primary support at its operating
speed provided by powered lift. Hydrofoils fall in this category as shown in Figure 1. To provide a "conventional" ship for comparison implies that it be a displacement hull
UNPOWERED LIFT STATIC
DESTROYER
VV
/\\\/PLANNING
CRAFT
HYDROFOIL
STATIC LIFT POWERED LIFT DYNAMIC LIFT
form. However, as the size decreases and speed increases, ships with displacement hull forms have increasing sustension by powered dynamic lift as they enter the planning regime. Various types of planning craft are examples of this effect
as sown in Figure 1. To ease the confusion over the relative fraction of sustention and if the vehicle should be termed high performance or not, hydrofoils will be categorized as high performance ships and other vehicles operating with a lesser fraction of powered lift will be classed as displacement ships.
The selection of the destroyer hull form for use as the displacement ship model is both traditional and based on the evaluation of the destroyer hull form by Mandel in his investigation of novelship types [2]. In Mandel's
investigation, he postulated that a 2,000 ton destroyer with a machinery plant specific weight of 5 lb/SHP could attain a speed of about 65 knots. This shows the impact of a
single area of improvement to hydrofoil standards demonstra-ting that a destroyer can compete with a hydrofoil on the basis of speed. Based on Mandel's assessment of the
destroyer as the "best" of the displacement hull forms, it was chosen as the vehicle to use in the comparison. However, at high speeds and at relatively small sizes, the destroyer
is surpassed in performance by the planning craft. Thus for a small ship for use in the comparison a planning craft was chosen.
CHAPTER 2
CHARACTERISTICS OF HIGH PERFORMANCE SHIPS
High performance ships have characteristics which are significantly different from a displacement ship operating at a lower speed. These characteristics are both inherent in the ship type and a result of design effort. They are major factors in the suitability of a high performance ship
to fill a mission requirement, and conversely the possible range of the performance variables; speed, range, and
pay-load carrying capacity.
The purpose of this section is to identify the areas in which there are significant differences between high perfor-mance ships and their displacement counterparts. These
differences are due to the hydrodynamic aspects of the high performance vehicle, the mission requirements which it must meet, and the differences in design criteria, practices and
standards which are employed to make the high performance ship feasible.
2.1 Hydrodynamic Aspects of High Speed Ships
The hydrodynamic forces which result from moving at high speed at the air-water interface have a significant effect on the viability of the ship as a useful platform. The link between hydrodynamic performance and ship impact is the
required shaft horsepower for a fixed speed and displacement. A relative measure of the hydrodynamic forces and the hydro-dynamic performance is the lift-drag ratio (). In
estimating propulsive power requirements the lift-drag ratio provides the influence of hydrodynamic performance.
SHP 6.87 x V
A n xL
where
V = speed in knots
= overall propulsive coefficient L = lift or displacement
D = drag or resistance
A = displacement
SHP = shaft horsepower
For the same size ship at 45 knots, comparative lift-drag ratios are shown below:
Comparative Lift-Drag Ratios[20] Destroyer Hydrofoil Planning
Craft Displacement
(tons) L/D L/D L/D
200 --- 15.0 8.8
2000 12.3 12.2
---The relative hydrodynamic efficiency of the hydrofoil at the small displacements is apparent; however, this advantage is reversed by the time the displacement reaches 2000 tons. The
impact of the lift-drag ratio will be apparent in other areas when the effects of hydrodynamic performance on ship design requirements are examined.
The other major area of hydrodynamic performance, which is the strong point of the hydrofoil, is the seakeeping
performance. From a qualitative point of view, the ability to maintain speed in a sea state reflects a good measure of this performance. The general superiority of a hydrofoil in increasing sea states is shown in Figure 2. This is the significant advantage which the hydrofoil has gained by isolating itself from environmental excitations. The cost of this isolation in terms of foil weight and volume will be examined in further detail in Chapter 3.
2.2 The Impact of Weight and Volume
For a large displacement ship operating at relatively low speeds, the impact of weight addition is either a slight reduction in speed or a slight increase in size to accommo-date the extra propulsion machinery and fuel to maintain the desired speed. Whichever choice is made the effect does not jeopardize the feasibility of the platform. The effect of a weight addition on a hydrofoil can have a more signifi-cant effect. Due to the nature of the dynamic forces which provide lift, both speed and displacement are constrained to a band of operating profiles. If the increase in displace-ment exceeds the hydrofoil's maximum take-off weight, the
U) 0 ord 0 U) a) rd
w w
-H . W -- --U) CO 3 Ho
d
o
033dS 31VM VIVD -S 3AVM NI 33dS 16 (0
Cvfuel must be sacrificed. The alternative is an overall increase in size. Unlike the displacement ship where only the containment portion must increase to provide the
necessary volume and bouyancy to support the weight addition and its effects, the hydrofoil must also increase foil size and weight to provide the support for an increase in total weight in excess of the maximum take-off weight.
Both ship types have the spiraling effect of the weight addition, resistance increase, propulsive power increase, fuel increase, and ship volume increase. The hydrofoil has the additional impact of the growing foil system and an upper limit on foil size.
The foil system represents an "overhead" which the ship must absorb in other areas if it is to be a useful platform. The weight of the foil system is significant and its impact increases with size as predicted by Hoerner [4] and reflected in recent hydrofoil designs as shown in Figure 3.1 The
overhead increases with increasing displacement and foil size grows until the feasibility limits for foil size are
reached. As a result hydrofoils are highly integrated
designs where weight and space are at a premium. The design, 'Hoerner's prediction of foil weight as a fraction of full load displacement is
Wf -2 1/3
= 6.5 + 1.3 x 10 W 1/3 Where Wf is foil weight
z
Qf uw
-_ LJz
0o u,LU -L C)O
u_-j
FULL LOAD (LONG TONS)
as a result of this high degree of integration, does not evolve but rather bursts into existance when the platform becomes feasible and integrated in all aspects of the design. To be able to absorb the overhead which the foils have
imposed, hydrofoils have relied heavily upon the application of technology somewhat foreign to displacement ship design.
The technology and the weight consciousness is more akin to the aircraft industry than the marine industry.
The impact of weight consciousness is significant if one looks at the relationship between foil weight and payload weight. For a wide range of displacement ships the average
payload weight fraction is about 12 percent.2 By contrast the average foil system weight is in that range also. A
hydrofoil designed by conventional displacement ship standards would have little if any payload carrying capability. The result of weight consciousness is that the hydrofoil also has a payload weight fraction of about 12 percent.
The advances in lightweight structures are one major area of improvement. The impact of aluminum structures is shown in Figure 4. Structural weight fraction and structural density both show the impact of lightweight hull structures.
2Payload is defined as weight groups 4 and 7, Amunition,
Aircraft and Aircraft related fuel and stores. The payload weight fraction is the ratio of payload weight to full load displacement.
0
0
0
(L D1810
0
0
AlISN3]C
3131H3A Ln I-z U1 LL. 0 rl 4J -I ix U LLJ 13
0, z
a:: F--J-I
mE 0 H: H 20Structural Structural
Weight Density
Fraction
Hydrofoil Ships -20% 2-3 lb/ft3
(Aluminum Hull Structures)
Naval Displacement Type -30% 5-7 lb/ft3 Ships
(Steel Hull Structures)
The differences are not restricted only to small ships.
Structural estimates for a variety of ships indicate that an aluminum hull structure is on the average 55 percent of the weight of a steel hull structure [6].3 The use of aluminum as a hull structural material is not without its complications. It has a definite fatigue life and also requires specific
measures to protect it from the effects of fire. The advan-tages are significant and the payload carrying capacity of hydrofoils would be severely limited if aluminum structures were not feasible.
Speed, hydrodyanmic efficiency (lift-drag ratio) and power plant size and weight are all closely related. The relationship between power requirements and speed reflects
the hydrodynamic influences,
SHP V
A L
D
3An aluminum hull structure for DDG-2 (Figure 4) would result in a structural density of 3.5 lb/ft3 and a structural weight fraction of 15.6 percent.
and the relationship between propulsion plant specific weight and machinery weight fraction reflect the influence of the power plant type.
Wm (SHP)
(-;
(wm)
where
SHP = required shaft horsepower A = displacement
V = speed L = lift
D = drag or resistance
= propulsive efficiency Wm = machinery plant weight
wm = propulsion plant specific weight =
propulsion plant weight installed shaft horsepower therefore
Wm V m
a L
D
As Mandel observed the gains in speed have been due to the reduction in specific machinery weight rather than
improvements in the lift to drag ratio [2]. The inference is that to keep the ratio of machinery weight to displacement within bounds the specific machinery weight must decrease with increasing speed and rapidly decreasing lift-drag ratio.
An indication of this effect is shown in Figure 5 for a range of effective lift-drag ratios and speeds of 45 and 30 knots. Restricting the available weight fraction for machinery establishes the limits for the specific machinery weight. Conversely the range of available machinery plants sets the limits on the machinery weight fraction. Examining the specific machinery weight of conventional prime movers
for both displacement ships and hydrofoils shows the impact of the high horsepower density of the current generation hydrofoils.
Power Plant Type Specific Machinery Fraction for Machinery Weight V = 45 kts. Weight rnL/D=10 nL/D = 5 Steam (Destroyer) 26 lb/SHP 0.355 0.71 [7] Gas Turbine (Destroyer) [7] 15 lb/SHP 0.21 0.42 Gas Turbine (Hydrofoil) 5 lb/SHP 0.07 0.14
The impact of the power plant specific weight in the small
L
ship range (-=5) shows the necessity for lightweight power plants. Along with the increase in the power to weight ratio is an accompanying reduction in volume.
30 2E ,0
I-0
r-u
LL U ,,, 5 0nIMACHINERY WEIGHT FRACTION
FIGURE 5 Machinery Weight Fraction Relationship to Propulsion Plant Specific Weight
ft 3/SHP Steam (Destroyer) [7] 2.5 Gas Turbine (Destroyer) [7] 1.5 Gas Turbine (Hydrofoil) 0.75
Since volume represents containment weight, hull structure, auxiliary systems, and outfit and furnishings, the reduction in volume is in fact also a reduction in weight.
The impact of volume is apparent not only in the
machinery area but throughout the ship for hydrofoils. The weight to support a cubic foot of volume based on current
hydrofoil standards is about 4.3 pounds.4 This is the
penalty for enclosing in structure and providing outfitting and services to a cubic foot of unused volume. Thus the emphasis is on volume as well as weight.
2.3 Hydrofoil Design Criteria and Standards
The hydrofoil designer's motivation for weight consci-ousness was discussed in the previous section and the impact of weight in some major areas was investigated. However,
there are some areas where an effort to save weight or volume may be quite subtle or have an unanticipated impact. Several of these areas are intact and damage stability; system
redundancy; reliability, maintainability and availability; habitability; operating profile and margins.
4Based on current hydrofoil standards of 2.5 lb/ft3 for
hull structure, 0.94 lb/ft3 for auxiliary systems and, 0.86 lb/ft3 for outfit and furnishings.
Damage and intact stability are an area in which the designer may be tempted to encroach in an effort to save
weight. In the current designs this has not occurred for the same stability standards apply equally to hydrofoils and
displacement ships. In the same manner the customary redundancy in areas such as power generation; propulsion
systems and other systems affecting mobility have not been compromised to save weight.
The requirements for reliability, maintainability, and availability are much harder to assess. The operating profile and the ship's maintenance concept all impact these areas. The complexity of the foil system must be acknowledged as a factor in the overall availability of the ship. The
trend to make the ship compact as a whole indicates that access and thus,in some degree, maintainability has to be compromised.
The area of habitability offers one of the best inroads to the reduction of volume and weight. Hydrofoils are by current standards austere but reflect habitability standards which are by no means unacceptable. The hydrofoil designer has in this area attempted to do more with less.
The general area of margins has hidden within it many
pitfalls. Margins in weight, propulsion power, accommodations, and generator capacity can have a significant impact on the design particularly in a small ship. The impact of the
storage capacity is significant. The variation in shaft horsepower margin by ship type, although in some cases
apparently small, can be significant. The values presented by Wilson and Lombardi [8] were used in this analysis in an effort to be consistent with current practice. Margins in other areas were not addressed since for comparative purposes
ships were redesigned to a common set of standards and criteria at the level of detail investigated.
CHAPTER 3
A COMPARATIVE ANALYSIS OF NAVAL HYDROFOILS AND DISPLACEMENT SHIPS
The differences in design and construction between hydrofoils and displacement ships in areas other than the means of sustension prevent a logical comparison of the advantages and disadvantages inherent in these ship types. To alow a comparison to be made, the differences in the
ships are analyzed as they are presently constructed and the differences in design criteria and standards are reduced to allow a side-by-side comparison.
The rationale for the ships selected for the study is contained in Section 3.1, followed by the method of analysis and computer model in Sections 3.2 and 3.3 respectively. The comparative analysis of a small hydrofoil and a similar
size planning craft is contained in Section 3.4. A similar analysis for a large hydrofoil and a displacement ship is contained in Section 3.5.
3.1 Selection of Ships
The desire to examine on an equal basis a hydrofoil and its non-hydrofoil counterpart directly affected the ships available for the study. The first criteria was that the ships should be designed as combatants as opposed to test beds for research and development purposes. This limited the hydrofoil population significantly. This restriction had two effects. The first was the imposition of the same
warfare related standards required of a naval combatant to the hydrofoil. The second was the elimination of a wide diversity in apparent design criteria which appeared in the examination of the hydrofoils whose initial purpose had been as a proving ground for the technology.
Having limited the available number of hydrofoils
significantly, it was determined that a side-by-side compar-ison of a hydrofoil and its displacement counterpart would yield the most useful information. The hydrofoil designs selected were then chosen for their diversity in size, performance, and mission capabilities.
At the small ship end of the spectrum, the 230 ton
NATO HYDROFOIL (PHM), a joint U.S.-NATO project, was chosen. It is a small, single mission area, gas turbine powered ship with a small crew and limited endurance. For a larger ship, the Deepwater Escort Hydrofoil (DEH), a product of design studies by the Boeing Corporation and the U.S. Navy was used. A 1200 ton multimission ship with an endurance sufficient
for ocean crossings, it represents the conceptual design of a large hydrofoil.
Having selected the hydrofoils to be examined, the candidates for a displacement ship to use as a yardstick for comparison were examined. To attempt to provide a one-to-one comparison of the current state-of-the-art in
displacement ship design with hydrofoil design the following selection criteria were used:
*Similar Size
*Similar Mission Area Capabilities *Recent Design
Based on these criteria the PG-84 class of patrol boats was selected for comparison with the PHM. A 240 ton hard-chine planning hull capable of calm water speeds of 40 knots, it provided a close match to PHM in both size and speed. It has the same mission capability as PHM and a similar
endurance. Built in the period 1966 to 1970, the ships were the first U.S. Naval combatants with gas turbine propulsion and aluminum hull construction. Other than a 10 year
difference in technology, the ships are very similar Selection of the counterpart for the DEH was not as straightforward. There are no recent designs in the 1200 ton range by the U.S. Navy. The result was the selection of a current design with a gas turbine propulsion plant for the comparison of current displacement ship design standards and criteria with those of DEH. To provide a side-by-side comparison, a 1200 ton high speed displacement ship was developed from a standard series estimate and PG-84 design standards.
The smallest current gas turbine design, other than PG-84, is the new Patrol Frigate Class (FFG-7).5 A current
5The Patrol Frigate Class was originally designated the
PF-109 class but was subsequently changed to the FFG-7 class.
design with multimission capabilities, it displaces
approximately 3500 tons. It has a large crew by hydrofoil standards, three times the size of DEH, and a maximum speed of about 28 knots. The differences in size and speed led to the selection of a 1200 ton series 64 hull form for the side-by-side comparison. This disparity in size and performance for the same general mission capability provides a very visible indication of the impact of hydrofoil technology.
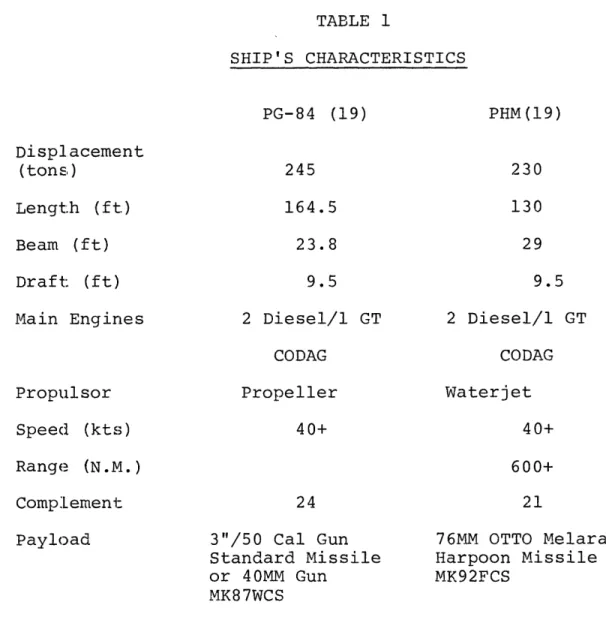
The principle characteristics of PHM, PG-84, DEH and FFG-7 are presented in Table 1.
The choice of ships permits not only a basis for
evaluating the features which are characteristic of a range of ship sizes. It also provides the basis for assessing the impact of gaining the hydrofoil's superior speed both in calm water and in a sea state.
3.2 Method of Analysis
To provide a basis for evaluating those areas in which there is an apparent difference in the standards, criteria or design philosophy between a hydrofoil and its displacement counterpart, an analysis of the weight and volume utilization of the two ship types was made. As a derivative of the
weight and volume analysis, a collection of specific parameters was developed. The specific parameters are ratios of weight., volume or other characteristics such as crew size or shaft horsepower which give a quantitative measure of the ship's characteristics and design criteria.
TABLE 1 SHIP'S CHARACTERISTICS PG-84 (19) Displacement (tons,) Length (ft.) Beam (ft) Draft: (ft) 245 164.5 23.8 9.5 Main Engines 2 Diesel/ GT
CODAG Propulsor Propeller 2 Diesel/ GT CODAG Waterjet Speed (kts) Range (N.M.) Comp:lement 3"/50 Cal Gun Standard Missile or 40MM Gun MK87WCS
76MM OTTO Melara Gun Harpoon Missile MK92FCS PHM (19) 230 130 29 9.5 40+ Payload 24 40+ 600+ 21
TABLE 1 (continued) SHIP'S CHARACTERISTICS Displacement (tons) Length (ft) Beam (ft) Draft (ft) DEH (15) 1200 200 FFG-7 (19) 3450 445 40 45 36 24.5 Main Engines 2 GT/2 GT COGOG
Propulsor Propeller Propeller
Speed (kts)
Range (nim) ~2600 at 40+ kts 4500 at 20 kts Complement
Missile Launcher Torpedo Tubes
76MM OTTO Melara Gun Towed Sonar, Foil
Mounted Sonar MK92FCS
20MM CIWS
1-76MM OTTO Melara Gun 1-Tartar Missile
Launcher
2-SH2D Lamps Helo
2-Triple Torpedo Tubes 1-20MM CIWS SQS-56 Sonar MK92FCS 2 GT 40+ Payload 28+ 82 185
The specific parameters provide a better indication of the magnitude of the difference in a selected area than weight or volume alone. They also provide the input for conceptually upgrading the displacement hull to hydrofoil design standards. The weight analysis was based on the weight groupings of the Ship Work Breakdown Structure System Classification [9]. The weight groups and their definitions as used in this
analysis are contained in Table 2. Payload weight was used as the figure of merit in evaluating the respective platforms. The definition of payload is therefore significant if
consistent conclusions are to be drawn. For hydrofoils and other high performance ships, such as surface effect ships and air cushion vehicles, payload is often defined as the variable load (fuel, personnel, stores, water, ammunition and aircraft), Armament (Weight Group 7) and Command and
Surveilance (Weight Group 4). This may be a valid concept when comparing similar high performance vehicles. However, when comparing these high performance ships with ships out-side that category, a more restrictive definition of payload gives a better indication of the platforms capability.
Payload in the context to be used in this analysis is the portion of the ship's displacement attributable to its
primary military mission, excluding mobility factors. This is normally used in the evaluation of displacement ships and is defined as the weight groups for command and surveil-ance (Weight Group 4) and armament (Weight Group 7), and those items in the variable load directly related to the military
TABLE 2
WEIGHT CLASSIFICATIONS [9] Group 1 Hull Structure
Framing, Shell Plating, Bulkheads, Decks, Deck House Structure, Masts, Foundations Group 2 Propulsion Plant
Prime Movers, Transmission Systems, Propulsors, Propulsion Support Systems (Fuel Oil & Lube Oil) Group 3 Electric Plant
Power Generation Systems, Power Distribution Systems, Lighting System, Power Generation Support Systems
Group 4 Command and Surveilance
Command & Control Systems, Navigation Systems, Exterior Communications, Surface & Subsurface Sensors, Countermeasures, Fire Control Systems Group 5 Auxiliary Systems
Heating, Ventilation & Air Conditioning Systems, Seawater Systems, Freshwater Systems, Anchor, Mooring & Boat Handing Systems, Foil Systems &
Controls
Group 6 Outfit and Furnishings
Non-Structural Compartmentation, Painting, Insulation, Deck Covering, Messing, Berthing & Sanitary Facilities, Furnishings and Fixtures, Commisary Equipment, Office Furnishings,
Storeroom Fixtures Group 7 Armament
Gun Systems, Missile Launching Systems,
Torpedo Launching Systems, Ammunition Stowage and Handling Systems
Loads Personnel - Crew and Crew's Effects
Stores - Fresh, Frozen and Dry Foodstuffs General Stores
-Fuel Oil - For Main Propulsion, Power Generation Lubricating Oil
Potable Water
TABLE 2 (continued)
Aircraft - Aircraft Weight Only
Aviation Stores - Repair Parts and Tools for Aircraft Maintenance
-mission; ammunition, aircraft, and aircraft related stores and fuel. The impact of this definition will not be overly apparent in the data presented since the items excluded from the high performance ship definition are derived from the
same set of requirements for the side-by-side comparison. The variation in these components of the variable load is a reflection of the platform's characteristics in response to the requirement. An excellent example of this is fuel
weight. With displacement, speed, range and prime mover fixed, the fuel weight is a direct reflection of the plat-form's hydrodynamic efficiency. For a side-by-side comparison with equivalency in as many areas as possible, payload weight is a good quantitative measure of the platform's merit.
Since the scope of the designs examined ranged from completed ships with returned weight statements (PG-84) to feasibility studies (DEH), the margin provided in the weight statements varied significantly. To place all the designs on a similar basis, the weight margin was distributed
equally among the seven major weight groups.
A volume analysis was conducted to assess the volumetric impact of hydrofoil technology. The volume categories
presented in Table 3 are derived from the proposed Navy Space Classification System [10] and give an indication of the major functions requiring an allocation of space.
Volume fractions were used as an indication of a ship impact in areas where there was no corresponding weight impact. This occurs in the areas of access, voids, storerooms and other
TABLE 3
VOLUME CLASSIFICATION [10] Military Mission Performance (Payload Volume)
Communications Detection and Evaluation Spaces Weapons Systems Spaces
Aviation Spaces Ship Control
Ship's Personnel (Personnel Volume)
Living Spaces - Berthing, Messing, and Sanitary
Supporting Functions - Administrative, Food Preparation, Medical and Personnel Services Stowage - Stores and Provisions Storerooms and Potable
Water Tankage Ship Operation
Main Propulsion Machinery Spaces - (Machinery Box Volume) Main Propulsion Machinery and Auxiliaries, Electrical Power Generators
Auxiliary Systems and Equipment - External to the Machinery Box (Auxiliary Systems Volume)
Steering Systems, Ventilation Systems, Deck Auxiliaries
Stowage
Endurance Fuel Oil (Fuel Volume) Stores and Supplies (Stores Volume) Tankage
Ballast Tanks, Voids
service type spaces such as steering gear rooms, fan rooms, and deck machinery spaces.
To provide an indication of relative performance in a selected area, a set of specific parameters was developed. These parameters serve a twofold purpose. They are a more directly applicable quantitative measure of performance than weight, volume, weight fraction or volume fraction. They provide the basis for changing the design standards and criteria in a conceptual redesign. The selection of the parameters was in many cases based on the weight estimating correlations from Section 6 of Weight Control of Naval Ships, Volume 1 [11]. The selection of the volume parameters was based on a logical correlation between the volume requirement and the prime utilization of the space. The parameters
selected and the definition of the parameters and terms used are contained in Table 4.
3.3 Computer Model
The computer model was developed to permit an investiga-tion of the impact of hydrofoil design criteria and standards on a displacement hull form and to give an indication of the
sensitivity of the figure of merit to the variation in design criteria and standards. The model was developed to be a tool to provide comparisons between ships with known parameters such as size, speed, shaft horsepower, and crew size. Therefore, it is not a synthesis model and does not check for feasibility in areas other than weight and volume.
TABLE 4
SPECIFIC PARAMETERS
Parameter Definition
Full Load Weight/Total Enclosed Volume Structural Density Propulsion Plant Specific Weight Specific Machinery Volume Payload Density Electrical System Specific Weight Specific Personnel Volume Arrangement Volume Fraction Auxiliary Systems Volume Fraction Stores Volume Fraction Outfit & Furnishing Density Auxiliary System Density
Hull Structural Weight (GP1)/ Total Enclosed Volume
Propulsion Plant Weight (GP2)/ Propulsion Shaft Horsepower
Machinery Box Volume/Installed Propulsion Horsepower
Payload Weight/Payload Volume Electrical Plant Weight (GP-3)/
Installed KW of Generator Capacity
Total Personnel Volume/Crew Size
Arrangement Volume/Total Enclosed Volume
Auxiliary System Volume/Total Enclosed Volume
Stores Volume/Total Enclosed Volume
Outfit & Furnishing Weight (GP-6)/ Total Enclosed Volume
Auxiliary System Weight (GP-5)/ Total Enclosed Volume
Vehicle Density Units lb/ft3 lb/ft3 lb/SHP ft3/SHP lb/ft3 lb/KW ft 3/MAN lb/ft3 lb/ft3
3.3.1 Objective of the Computer Model
The objective of the computer model was to reduce the differences in design criteria and standards that exist between hydrofoils and displacement ships. The intent was to enable a comparison of ships with similar characteristics in all areas except the hull type.
Since the sensitivity of the hydrofoil to design changes prohibited the redesign of the hydrofoil down to displacement ship standards. The more logical alternative of designing the displacement ship up to hydrofoil standards was undertaken. With this approach the impact of the hydro-foil's design criteria would be reflected in a change in the figure of merit.
A secondary objective of the computer model was to test the sensitivity of the figure of merit to changes in the design parameters both individually and collectively. This provides an indication of the relative importance of the design parameters. It also provides an indication of the range of parameters for which the conclusions are valid.
3.3.2 Description of the Computer Model
The model was designed for analysis rather than
synthesis. It therefore utilizes a fixed ship size and type and balances weight and volume to produce a balanced ship in these two areas. The model is an itterative series of
weight and volume calculations based on a fixed displacement. The input to the model is the performance parameters of the
hydrofoil with which the comparison is to be made. These are maximum speed in calm water, range at maximum speed in calm water, crew size, stores endurance period, and installed electrical generation capacity. After providing the weight and volume necessary to support the functions required to meet these performance requirements, the difference between the weight utilized and the initial displacement is payload, the figure of merit. The sizing of the weights and volumes is based on the specific parameters from the analysis of the hydrofoil used in the comparison. This results in the up-grading of the displacement hull's standards.
The significant difference between the hull forms other than the foil system is the speed-power relationship. Since the displacement and speed are known, the required shaft horsepower for the maximum speed is also known from a
characteristic speed-power curve for the displacement hull form. This is used as an input to the program. The
characteristics of the prime mover also have an impact on the model. For the hydrofoils involved, the prime mover was the General Electric LM2500. The assumption was made that the upgraded displacement ship would have the same prime mover and thus the same specific fuel comsumption rate characteristics.
3.3.2.1 Weight Algorithm
The weight algorithm balances the specified dis-placement with the categories of weight utilization other than payload. The weight which remains after all the
containment, mobility, personnel and other miscellaneous weight demands are met is the weight available for payload.
The weight algorithm has three sections which are
effectively independent of each other relying solely on the performance parameters and specific parameters for the
respective area. The weights associated with containment, Group 1 (Hull Weight), Group 5 (Auxiliary Weight) and Group 6
(Outfit and Furnishings) are the only groups which are volume dependent and as such are affected by the volume
algorithm. The prediction of these three weight groups is based on an assumed volume and the respective specific
parameter for the weight group. For the initial itteration, the volume is estimated from the displacement and vehicle density. On later itterations it is estimated from the volume algorithm.
The propulsion machinery weight, Group 2, and Fuel
Weight are computed from the inputs of required shaft-horse-power at maximum speed, shaft horseshaft-horse-power margin, the maximum
speed, and the range at the maximum speed. Closely associated with these weights is the electrical system
weight, Group 3, and the required fuel for its prime movers. The propulsion machinery weight is estimated from the
propulsion machinery specific density (lb/SHP). Similarly the electrical system weight is estimated from its specific density (lb/KW). The fuel weight, however, is a function of
several variables, shaft horsepower, range, speed, electrical plant size, and specific fuel consumption rates. The weight
of fuel is estimated in two parts. The fuel weight for the electrical plant is estimated from the installed electrical generator capacity, the prime mover's assumed specific fuel consumption rate, and the estimated length of operation based on time at full speed.6
KW HP R
Wf = [E- x 1.34 H- x SFCA x ( )]/2240
f EFF KW V
where
Wf = electrical plant fuel weight
SFCA = electric plant prime mover specific fuel consumption rate
KW = installed generator capacity EFF = assumed generator efficiency R = range at maximum speed
V = maximum speed
The fuel estimate is conservative since it is based on installed generator capacity rather than the actual electrical loads.
The propulsion plant fuel weight is predicted in a slightly different manner. In ships which have relatively
6Although this is the "best case" for the electric plant
fuel, it is the worst case for the total fuel load. The electric plant fuel load would be a greater fraction of the total fuel load at a lower speed, e.g., the hullborne endurance speed for a hydrofoil. Due to the large fuel fraction required for the high speed endurance, the
available hullborne endurance normally exceeds the required endurance even with the longer period of generator operation.
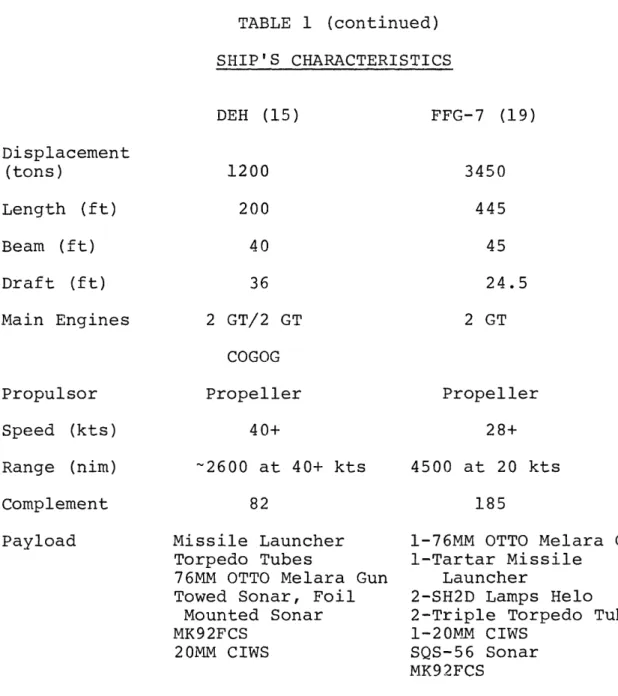
large fuel fractions the Brequet range equation is used. It accounts for the reduction in displacement and attendant reduction in required shaft horsepower as fuel is consumed. This reduction is presented as an increase in range since a lower power requirement also implies a lower rate of fuel
consumption. The Brequet range equation reflects these facts.
2240 AV A
RB SFC (-<H) n ( ) SFC THP A-Wf
Where
RB = Brequet Range
SFC = Propulsion Prime Mover Specific Fuel Consumption Rate
A = Displacement Full Load V = Maximum Speed
SHP = Required Shaft Horsepower at Maximum Speed With SHP Margin
Wf = Propulsion Fuel Weight
The difference between the range predicted by the Brequet equation and the standard range prediction without accounting for fuel burnoff is significant. As shown in Figure 6, at a fuel fraction of 25% the Brequet range is 15% greater. This has a definite effect on the predictions of the model. The total fuel weight is then the sum of the propulsion and electrical plant fuel weights with an appropriate tailpipe allowance.
1.4 1 i.3 I 1.2 C9 w
z
t. I .0 1.0FUEL WEIGHT FRACTION
FIGURE 6 Brequel Range Correction Based on Fuel Fraction i
The weight of the crew and stores are again determined by the specific ratios based on crew size and the stores endurance period. The difference between the estimated weights in the areas of containment, mobility and personnel
and the assumed displacement is the payload weight. The weight algorith is shown in flow chart form in Figure 7.
3.3.2.2 Volume Algorithm
The volume algorithm is very similar to the weight algorithm since it requires a volume balance between assumed volume and required volume. An initial input to the weight
algorithm is an estimated volume based on the required dis-placement and an assumed vehicle density. Since portions of the weight estimate are based on the volume estimate,
there is a coupling between the weight and volume algorithms. The volume algorithm allocates the estimated volume to the respective volume requirements. Some volume requirements are based solely on a required volume fraction. Arrangements volume, stores volue, and auxiliary volume are determined in this manner. However, machinery box volume, fuel volume and personnel volume are based on their respective specific
parameters. The difference between the estimated volume and the volume utilized by these functions is the volume available for payload. To ensure a sufficient volume is available to contain the payload a required payload density range is specified. If the payload density falls outside the range,
4-) ro U 0 r-i H 0 0 U H 48
the estimated volume is incremented and another itteration is made with a new estimated volume until the requisite payload density range is met.
A flow chart for the volume algorith is contained in Figure 7 and the program listing is contained in Appendix C.
3.3.3 Limitations of the Model
The model has definite limitations since it is not a true synthesis model and does not check for feasibility in areas such as stability, large object spaces, and deck area. The model does permit the examination of the effect of a change of design parameters on a ship which is already feasible. Since the changes are in most cases distributed throughout the ship or quite flexible in their location, such as fuel, for small changes the resultant ship should have a reasonable certainty of being feasible.
The model makes the assumptions that the specific
parameters applicable to a hydrofoil of a specific size are transferable to a displacement ship. To keep this assumption valid, the ships to be upgraded are of the same approximate size. Similar assumptions are made in prime mover and
propulsor for main propulsion and in other areas.
The ship impact of increasing payload is accounted for in part by the parameters which are sensitive to the change in total volume required to support the payload; hull weight, outfit and furnishings weight and auxiliary systems weight.
The impact of the added payload on the electrical generation capacity is not considered. A portion of the payload weight and volume addition may be necessary to support the payload's additional electrical power requirements.
3.4 A Comparative Analysis of a Small Hydrofoil and a Planning Craft
The objective of this section is the analysis and
evaluation of PHM4 and PG-84 as they were originally designed. From this analysis the design differences will be evaluated and then applied to redesign PG-84 to PHM design standards and performance requirements.
3.4.1 Analysis of PHM and PG-84
The PHM and PG-84, being similar in size, mission, crew size, and payload, provide a good basis for the evaluation of the ship impact of hydrofoil design standards, criteria, and philosophy. Comparing the designs as they currently exist and again with PG-84 upgraded to hydrofoil standards and requirements provides an indication of the "cost" as measured in terms of payload carrying capability for having
the foil system's advantages.
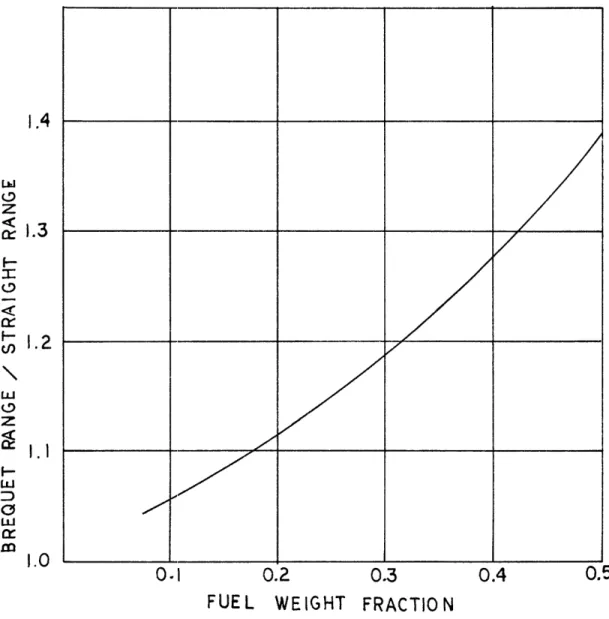
The hydrofoil system's impact is quite apparent on a ship as small as PHM. The analysis procedure described in Section 3.2 was carried out for these two ships. The
results of this analysis are contained in Figures 8 to 11. These figures show both the impact of the foil system and more significantly hydrofoil design standards.
FOIL SYSTEM
AUXILLARY SYSTEMS
OUTFIT & FURNISHINGS
ELECTRICAL SYSTEM PROPULSION MACHINERY HULL STRUCTIRE PERSONNEL FUEL PAYLOAD PHM
FIGURE 8 PG-84 - PHM Comparative Weight Fraction Analysis
100 80 60 WEIGHT FRACTION (%) ho 40 20 0 PG-84 3 10.0%
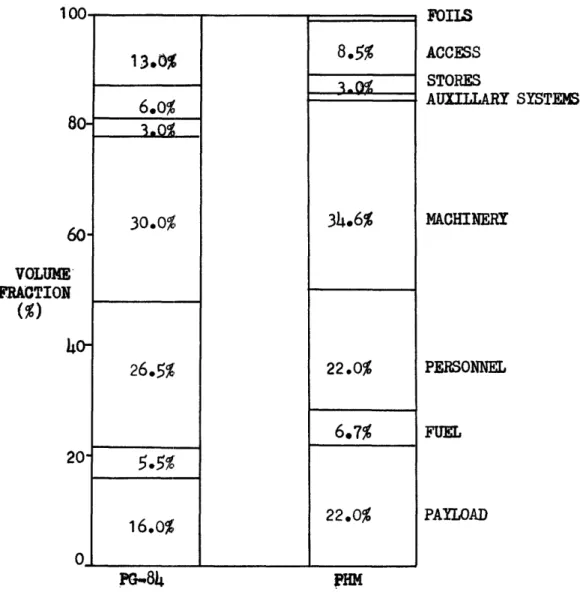
7.7%
6.9% h.o0% 19.5% 19.9% 14.9% 13.6%-8.3%
13.2% 17.9% 12.2%100 8C 60 VOLUME' FRACTION (%) 4a 20 I. )-). 0 13,0% 6.0%_ 30.0% 26.5%,
5.5¢
16.0% PG84 8.5% 34.6% 22.0% 6.7% 22.0% FOILS ACCESS STORES AUXILLARY SYSTEMS MACHINERY PERSONNEL FUEL PAYLOAD PHMFIGURE 9 PG-84 - PHM Comparative Volume Fraction Analysis
52
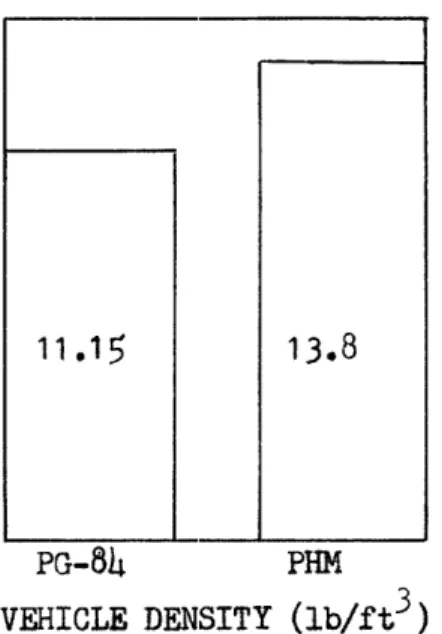
11.15
PG-84 PHM
VEHICLE DENSITY (lb/ft 3)
PGo84) PHM
PROPULSION PLANT SPECIFIC
WEIGHT (lb/SHP)
HULL STRUCTURAL DENSITY
(lb/ft
3)
PG-84 PHM
MACHINERY BOX SPECIFIC
VOLUME (ft 3/SHP)
FIGURE 10 PG-84 - PHM Specific Parameters
3.07 PG-84 PHM o.64 0.92 -13.8
2.5
0.95
PG-84 PHM
OUTFIT &. FURISHING DENSITY
(l/ft
3
)
PG-84 PHK
SPECIFIC PERSONNEL VOLUME
(ft3/man)
PG-84 PHM
AUXILLARY SYSTEM DENSITY
(lb/ft
3)
PG-84 PHM
ELECTRICAL SYSTEM SPECIFIC WEIGHT (lb/KW)
FIGURE 11 PG-84 - PHM Specific Parameters
384 487 97.4 I ) -I
i o.94
1.2 o.963.4.2 Comparison of PHM and PG-84
A comparison of the weight and volume utilization provides an indication of the areas in which there are differences in design criteria or standards. It is very significant that the figure of merit, payload weight, and also payload volume is larger in PHM than in PG-84 as shown in Figures 8 and 9. This infers that the hydrofoil
system was not added at the expense payload carrying capacity. The fuel fraction or PHM is greater than PG-84. This is a reflection of both a higher speed and a longer range at high speed. A comparison on the basis of the ratio of fuel weight to a transport momentum factor (Displacement x Speed x Range) is presented below.
lb fuel ton-kt-NM
PG-84 1.66 x 10²
PHM 1.16 x 10²
Based on this figure of merit, PHM reflects the improvement in gas turbine technology resulting in a lower fuel consumption rate and the advantage in hydrodynamic efficiency of the
hydrofoil over the planning hull at high speeds.
A more apparent difference is the smaller structural weight fraction in PHM. Even though both ships are of light-weight construction, PHM is all aluminum construction and PG-84 has an aluminum hull and fiberglass deckhouse, PHM
has significantly less weight. In both structural weight fraction and structural density PHM is less.
Structural Structural
Weight Density
Fraction
PHM 19.9% 2.5 lb/ft3
PG-84 27.5% 3.07 lb/ft3
The difference in structural density compared to the difference in structural weight fraction points up a second factor in the total structural weight picture. This is the impact of
volume. For PG-84 the application of PHM's structural
standards would reduce the hull weight by approximately 12.4 tons or 18%. Reduction of PG-84's hull volume to PHM's
without changing PG-84's structural density would result in a 14.7 ton or 22% decrease. A combination of the two effects would result in the 20 ton decrease in hull weight observed
between PG-84 and PHM. Thus both structural density and enclosed volume are of importance in providing the efficient use of structural weight observed in the hydrofoil.
The propulsion systems in PHM and PG-84 are significantly different even though the prime movers in both cases are
diesels for low speeds and gas turbines for high speeds. PHM is waterjet propulsion and PG-84 is a subcavitating propeller. Since there are sizeable differences in the installed horsepower and type of propulsor, the specific
indices give a better picture of the weight and volume impact of the two propulsion plants.
Machinery Plant Machinery Box Specific Weight Specific Volume PG-84 7.0 lb/SHP 0.92 ft3/SHP
PHM 4.7 lb/SHP 0.64 ft3/SHP
The electrical system is one of the best examples of the application of weight consciousness to high performance ship design. Although both PHM and PG-84 both appear to have the same electrical system weight, PHM has twice the power generation capacity. The reduction in weight is the result of a gas turbine prime mover and 400 hertz power generation in PHM in contrast with a 60 hertz system with diesel prime movers in PG-84. The difference in the
electrical system specific weight is very apparent.
Electrical System Specific Weight
PG-84 97.4 lb/KW
PHM 51.5 lb/KW
The specific densities in the area of outfit and furnishings and auxiliary systems are not significantly different from PHM to PG-84 as shown in Figure 11. The difference in weight is a result primarily from the smaller enclosed volume in PHM.
The impact of volume is very significant in the area of personnel volumes.
Specific Personnel Volume PG-84 487 ft3/man
PHM 384 ft3/man
The net decrease in displacement for the reduction of
personnel volume per man on PG-84 to PHM standards, a change of approximately 100 cubic feet, would be about 5.6 tons based on PG-84 standards for structural density, outfit and furnishing density and auxiliary systems density.
The best indication of efficient volume utilization is the vehicle density. PHM with a higher vehicle density has a larger fraction of its displacement available for productive purposes since less enclosed volume implies less weight is necessary for enclosing and outfitting the hull envelope.
Vehicle Density PG-84 11.15 lb/ft3 PHM 13.8 lb/ft3
The gains to be realized from efficient volume utilization is apparent in the smaller volume fractions alloted to
arrangements, access and stores on PHM. The smaller stores volume gives an indication of several areas which do not appear in the simple analysis of weight and volume. The
first is the store's endurance period. In PHM it is half of PG-84's. Although this has only a small effect on the
weight utilization the volume impact is slightly larger. The second area is repair parts storerooms. PHM has no allowance for storage of spare parts in areas removed from the
equipment itself. This is an indication of a basic difference in maintenance philosophy and operating profile. It carries with it a resultant effect in the overall reliability,
maintainability and availability aspects of the ship. The net result of the designers efforts is allowing PHM to absorb the weight of the foil system, representing 13.2% of the ship's displacement without impacting the payload carrying capability when compared to PG-84. The
hydrofoil system allows PHM to have an edge on PG-84 in speed, endurance, and seakeeping capability. The design criteria and standards present in PHM are not unique to hydrofoils and could be equally as well applied to PG-84. In doing this the true cost, in terms of payload, of gaining the hydrofoils superior performance can be more accurately assessed. The following section examines a conceptual redesign of PG-84 to PHM standards for this purpose.
3.4.3 Redesign of PG-84 to PHM Standards
To provide the basis for a side-by-side comparison, PG-84 was conceptually redesigned to PHM standards using PHM's performance requirements and standards summarized in Table 5. These parameters were developed from the analysis
TABLE 5
PERFORMANCE REQUIREMENTS AND PARAMETERS FOR UPGRADED PG-84
PG-84 PHM Redesigned
PG-84 Displacement (tons)
Maximum Speed (kts) Range at Max. Speed SHP at Max. Speed Assumed Propulsion SFC Generator Capacity (KIW) Assumed Generator SFC Crew Size Store's Endurance (days) Vehicle Density Structural Density Auxiliary System Density
Outfit & Furnish Density Propulsion Plant Specific Weight SHP Margin Electrical System Specific Weight Machinery Box Specific Volume Specific Personnel Volume Arrangements Vol. Fraction Auxiliary Systems Vol. Fraction Stores Volume Fraction Payload Density 242 40 (est) 500 (est) 13,000(est) 0.48[12] 200 0.5 24 14 11.15 3.07 0.95 1.2 7.0 unknown 97.4 0.92 487 0.13 0.02 0.06 9.3 230 45 (est) 750 15,000(est) 0.43 [13] 400 0.5 21 7 13.8 2.5 0.94 0.86 4.7 unknown 51.5 0.64 384 0.085 0.015 0.03 8.75 230 45 750 17,000* 0.43[13] 400 0.5 21 7 (not an in-put) 2.5 0.94 0.86 4.7 1.125[8] 51.5 0.64 400 0.09 0.02 0.03 9.0
of PG-84 and PHM in Section 3.4.1. The one input parameter which could not be made identical is the shaft horsepower required at high speed since this is the influence of the hull type and means of sustension. The shaft horsepower required was developed from a standard series of hard chine planning craft as explained in Appendix B.
Utilizing the computer model, the weights and volumes of the redesigned PG-84 were computed. Since the performance
requirements and standards were the same as PHM, the figure of merit, payload, gives the indication of the cost of the
foil system in terms of payload. The results of the
computer model contained in Table 6 show that the redesigned PG-84 has 13.3 tons more payload than PHM and 15.3 tons
more payload than the original PG-84. To provide a comparison of the three platforms weight and volume fractions are
presented in Figures 12 and 13. The only notable difference in an examination of the comparative weight and volume
fractions is the fuel weight. This difference is the result of two effects. The first is the lower relative hydrodynamic efficiency of the planning hull form at this
size and speed range, as discussed in Section 2.2. The
second is the effect of a slightly different shaft horsepower margin which directly affects the endurance fuel requirement. The cost of the foil system is reflected in the payload difference between the redesigned PG-84 and PHM.
TABLE 6
UPGRADED PG-84 WEIGHT AND VOLUME ESTIMATE
Weight (tons) Weight Fraction
Group 1. 45.28 0.197 Group 2 35.67 0.155 Group 3 9.20 0.040 Group 5 17.02 0.074 Group 6 15.57 0.068 Payload 44.81 0.195 Personnel 2.81 0.012 Stores 0.75 0.003 Fuel 58.98 0.256 Total 230
Volume (Cubic Ft) Volume Fraction Machinery Box Volume 12240 0.302 Auxiliary System Volume 811 0.020
Access Volume 3651 0.090 Payload Volume 11250 0.277 Personnel Volume 8400 0.207 Stores Volume 1217 0.030 Fuel Volume 2998 0.074 Total Volume 40567
FOIL SYSTEM
AUXILLARY SYSTEMS
OUTFIT & FURNISHING
ELECTRICAL SYSTEM PROPULSION MACHINERY HULL STRUCTURE PERSONNEL FUEL PAYLOAD
FIGURE 12 Comparative Weight Fractions for Upgraded PG-848
FIGURE 12 Comparative Weight Fractions
for Upgraded PG-84
63 100 80 60 WEIGHT FRACTION (%) 20 0
4 /'%r I UV 80. 60. VOLUME FRACTION (%) 4ho 20. 0-13.0% 6.0% _ 26.5% 9.0% 3.0%
7
22.0% 27.7% 16.0% 7.4% 30.2% 30.0% 5.5% PG-84 REDESIGNED PG-84 22.0% 6.7% 34.6% FOILS ACCESS AUXILLARY SYSTEMS STORES PERSONNEL PAYLOAD FUEL MACHINERY PHMFIGURE 13 Comparative Volume Fractions for Upgraded PG-84
g
Payload Weight Payload Payload Fraction Weight Weight
Tons Difference
PG-84 12.2% 29.5 -15.3
Redesigned
PG-84 19.5% 44.8
--PHM 13.6% 31.5 -13.3
In return for this cost is the ability to maintain speed in a sea state.
To evaluate the advantage of this sea state capability, the redesigned PG-84's seakeeping capability at high speed was estimated from the data presented by Savitsky in
Reference 14. PG-84 at 45 knots is operating at a speed
length ratio where the added resistance due to waves is almost a constant twenty percent greater than the calm water
resistance. This increase in resistance does not provide the limiting speed in a sea state but rather the acceleration forces. For a sea state 5, significant wave height of 5.5 feet, accelerations of the center of gravity on the order of lg could be expected at a speed of 45 knots. To reduce the acceleration levels to a tolerable level, 0.5 g [3], requires slowing to about 20 knots. However, in sea state 3,
significant wave height of 2.5 feet, there is only a slight increase in added resistance, on the order of 10% and the accelerations are on the order of 0.2 g.
From an operational point of view the planning hull form would have to slow below its maximum speed more than 50% of the time in the North Atlantic based on its year around sea state profile [15]. The hydrofoil could operate in excess of 90% of the time with no appreciable speed
loss.
3.4.4 Sensitivity Analysis of Redesigned PG-84
During the analysis of the redesigned PG-84 it became apparent that the figure of merit was very sensitive to certain parameters. To explore this more completely, the computer model was used to test the sensitivity of the pay-load to changes in individual parameters and to the change of several parameters at once.
The change in payload fraction for a variation of a single parameter holding all other parameters constant was computed for a change in required shaft horsepower, shaft horsepower margin, propulsion plant specific weight, specific fuel consumption rate, structural density, specific personnel volume, and payload density. The composite results are
shown in Figure 14. The impact of the mobility related parameters is pronounced and shows the impact hydrodynamic efficiency has on the ability to carry payload.
To investigate the effect of the variation of more than one parameter, shaft horsepower required, specific fuel
7Based on Figure 2 for sea state 6 which occurs less than
.30 z.2 5
0
u 0: 20 c3>-a.
-20
-10 0 +10 + 20PERCENTAGE VARIATION OF PARAMETER
FROM BASELINE VALUE
FIGURE 14 Sensitivity Analysis of Upgraded PG-84 to Single Parameter Changes
67
~1 PA YLORD Dsiry
2 sPec¢FC/c ?UIom$J6L Vounv
3 STeuc raeAL D6cvstr
4 peoPuLsa o PZAr £Pc,rc
W|E/M t
5 S Peea/lc Fx' COA4S6J PTA
*4r6 -6 S iJ'mcr jDIEPDWAA IRRnErR I In I Ii J I I
consumption rate, structural density, propulsion plant specific weight, specific personnel volume and payload density were all varied in one percent increments of the original value. All the parameters except those six selected were held constant at the original value. The results of this analysis are shown in Figure 15. This analysis indicates that a 5% variation in these six major parameters still results in a payload fraction greater than PHM. Thus with a 5% error in the estimates for these parameters the redesigned PG-84 would still have a larger payload.
3.4.5 Summary of the Analysis of PG-84 and PHM
The comparison of PG-84 and PHM point out differences in several design areas. The areas of greatest apparent difference are propulsion plant weight and volume, personnel volume, and arrangements and access volume. In all these areas PHM showed a marked advantage. There was a lesser
but yet significant difference in the areas of hull structural weight and electrical system weight. The net result was the accommodation of the foil system without an adverse effect on payload carrying capability.
To determine the "cost" of the foil system in terms of payload carrying capability, the PG-84 was conceptually redesigned to the same performance requirements, criteria and standards as PHM. The only significant difference between the two is the hull form and foil system and thus
..20
.15 PAYLOAD WEIGHT FRACTION .10.05
0EQUAL PERCENTAGE CHANGE OF SIX MAJOR PARAMETERS
FROM THE BASELINE UPGRADED PG-84 VALUES (%)
FIGURE 15 Sensitivity Analysis of Upgraded PG-84 to Multiple Parameter Changes
the propulsive power requirement. The comparison was then made based on the weight of payload carried as the figure of merit. The results of the comparison of PHM and the redesigned
PG-84 are summarized below.
*PG-84 (redesigned) is capable of carrying 42 percent or 13.5 tons more payload than PHM. However, a
fraction of the additional payload weight may be required to provide additional payload support such as electrical power or air-conditioning.
,The redesigned PG-84 is required to reduce speed from its maximum speed at approximately sea state 3 to avoid excessive accelerations. PHM can maintain its maximum speed through sea state 5 and probably into sea state 6.
-The redeiscned PG-84 requires more fuel to cover the same endurance range at high speed due to its poor hydrodynamic efficiency compared to the hydrofoil. This demonstrates the tradeoff between seakeeping ability as manifested by the ability to maintain speed in the higher
sea states and the ability to carry payload. For the small ship case there is no obvious best. The selection must be predicted on the ship's operating profile and area of

![FIGURE 1 The Sustention Triangle [1]](https://thumb-eu.123doks.com/thumbv2/123doknet/14401176.510045/11.918.159.827.260.761/figure-the-sustention-triangle.webp)
![FIGURE 3 Weight Trend for Hydrofoil Lift Systems [5]](https://thumb-eu.123doks.com/thumbv2/123doknet/14401176.510045/18.918.158.797.285.783/figure-weight-trend-hydrofoil-lift-systems.webp)