Calibrating genomic and allelic
coverage bias in single-cell sequencing
The MIT Faculty has made this article openly available. Please share
how this access benefits you. Your story matters.
Citation Zhang, Cheng-Zhong et al. “Calibrating Genomic and Allelic
Coverage Bias in Single-Cell Sequencing.” Nature Communications 6 (April 2015): 6822 © 2015 Macmillan Publishers Limited
As Published http://dx.doi.org/10.1038/ncomms7822
Publisher Nature Publishing Group
Version Author's final manuscript
Citable link http://hdl.handle.net/1721.1/111665
Terms of Use Article is made available in accordance with the publisher's policy and may be subject to US copyright law. Please refer to the publisher's site for terms of use.
Calibrating genomic and allelic coverage bias in single-cell sequencing
Cheng-Zhong Zhang1,2,12, Viktor A. Adalsteinsson2,3,4,12, Joshua Francis1,2, Hauke Cornils5,6, Joonil Jung2, Cecile Maire1, Keith L. Ligon1,7,8,9,10,
Matthew Meyerson1,2,7,11, J. Christopher Love2,3,4
1Department of Medical Oncology, Dana-Farber Cancer Institute, Boston, Massachusetts USA; 2Broad Institute of Harvard and MIT, Cambridge, Massachusetts USA;
3Department of Chemical Engineering Cambridge, Massachusetts Institute of Technology, Massachusetts USA; 4Koch Institute for Integrative Cancer Research, Massachusetts Institute of Technology, Massachusetts USA; 5Department of Pediatric Oncology, Dana-Farber Cancer Institute, Boston, Massachusetts USA;
6Department of Cell Biology, Harvard Medical School, Boston, Massachusetts USA; 7Department of Pathology, Harvard Medical School, Boston, Massachusetts USA; 8Department of Pathology, Brigham and Women’s Hospital, Boston, Massachusetts USA; 9Department of Pathology, Boston Children’s Hospital, Boston, Massachusetts USA;
10Center for Molecular Oncologic Pathology, Dana Farber Cancer Institute, Boston, Massachusetts USA; 11Center for Cancer Genome Discovery, Dana Farber Cancer Institute, Boston, Massachusetts USA; 12These authors contributed equally to this work.
Abstract
Artifacts introduced in whole-genome amplification (WGA) make it difficult to derive 1
accurate genomic information from single-cell genomes and require different analytical 2
strategies from bulk genome analysis. Here we describe statistical methods to quantitatively 3
assess the amplification bias resulting from whole-genome amplification of single-cell genomic 4
DNA. Analysis of single-cell DNA libraries generated by different technologies revealed 5
universal features of the genome coverage bias predominantly generated at the amplicon level 6
(1-10 kb). The magnitude of coverage bias can be accurately calibrated from low-pass 7
sequencing (~ 0.1x) to predict the depth-of-coverage yield of single-cell DNA libraries 8
sequenced at arbitrary depths. We further provide a benchmark comparison of single-cell 9
libraries generated by multi-strand displacement amplification (MDA) and multiple annealing 10
and looping-based amplification cycles (MALBAC). Finally we develop statistical models to 11
calibrate allelic bias in single-cell whole-genome amplification and demonstrate a census-based 12
strategy for efficient and accurate variant detection from low-input biopsy samples. 13
Introduction
14Single-cell sequencing has provided unique insights into the genetic diversity of living 15
organisms and among different cells within the same individual1-3. Recent single-cell analyses 16
have uncovered different clonal populations within a single tumor4,5, revealed genomic diversity 17
in gametes6,7 and neurons8,9, and resolved historical cellular lineages during development10,11. 18
Single-cell sequencing also has many potential clinical applications, such as characterization of 19
circulating tumor cells12,13 or fine-needle aspirates for clinical diagnostics. 20
A major drawback of single-cell sequencing, however, is the need to amplify genomic 21
DNA prior to genomic characterizations14-17. Due to the limited processivity (<100 kb) and 22
strand extension rate (<100 nt/second) of DNA polymerases, the amplification of large genomes 23
requires priming and extension at millions of loci, each amplified 10,000 to 1,000,000 fold. Such 24
a large number of polymerase reactions inevitably generate amplification errors that confound 25
the detection of genetic variants (Supplementary Fig. 1). Furthermore, differential priming 26
efficiencies and extension rates result in uneven amplifications across the genome18,19 and 27
skewed representations of homologous chromosomes. These variations both compromise variant 28
detection sensitivity and may lead to incorrect genotypes5,12. Although technological innovations 29
may improve the fidelity of whole-genome amplification (WGA) 15-17,20-23, statistical fluctuations 30
in the amplifications of millions of different DNA templates will persist. 31
As genetic variants are detected by the relative abundance of variant-containing DNA 32
templates in the library, non-uniformity in genome coverage directly impacts the sensitivity to 33
detect variants. For example, grossly non-uniform libraries emphasize only over-represented 34
regions of the genome, and contain little information on other regions. Current methods to assess 35
the uniformity of WGA rely on either direct visual inspection or various statistical measures of 36
the sequencing coverage at the base-level18,22 or the allele-level5,12. These empirical methods and 37
metrics generally require substantial sequencing (10x or greater) and only gauge the deviation of 38
amplified DNA from the "uniform” bulk DNA at a particular sequencing depth. They fail, 39
however, to characterize the intrinsic non-uniformity resulting from WGA that is independent of 40
sequencing depth (Fig. 1a,b). Moreover, the nature of the main sources of bias remains poorly 41
characterized (Fig. 1c). 42
Here we report a systematic analysis of the coverage bias in single-cell whole-genome 43
amplification. We show that the structure of individual WGA amplicons imparts a dominant 44
amplification bias on length scales longer than the average size of sequencing fragments. 45
Sequencing at low depths (0.1-1x) can effectively reveal this variation in the amplicon-level 46
coverage, and enable accurate predictions of the depth-of-coverage yield when sequencing 47
single-cell libraries to arbitrary depths. We further characterized the amplification bias between 48
homologous chromosomes using analytically solvable models and validated these model 49
predictions of allelic coverage by experimentally observed coverage at heterozygous sites. These 50
results provide a framework for quality assurance of single-cell libraries and for estimating the 51
sensitivity to detect local variants—such as single-nucleotide variants or chromosomal 52
translocations—present in an individual cell at a given sequencing depth. Finally we demonstrate 53
that the amplification bias in multi-strand displacement amplification (MDA) is more random 54
than recurrent. Although such random bias cannot be corrected systematically, it suggests an 55
efficient census-based strategy to accurately determine somatic genetic variants in small biopsy 56
samples by sequencing multiple single cells from the same sample at modest depths. 57
Results
58Information yield from bulk and single-cell sequencing
59
In bulk DNA libraries, each sequencing fragment represents genomic information from 60
an individual cell; therefore, the information content increases with the sequencing depth until 61
fragments are sequenced to exhaustion. The information content of a DNA library (“library 62
complexity”) is thus measured by the total number of distinct molecules (sequencing fragments) 63
in the library24-26. This measure is essentially determined by the total number of cells (or the total 64
amount of genomic DNA) used to prepare the library (Fig. 1a, left panel). In single-cell DNA 65
sequencing, whole-genome amplification (WGA) precedes the construction of a DNA library 66
and introduces non-uniformity across the genome: As sequencing depth increases, more genomic 67
regions are uncovered (Fig. 1a, right panel). Hence the fraction of the single-cell’s genome 68
uncovered at a given sequencing depth determines the information content of single-cell 69
sequencing. This measure ultimately depends on the uniformity of genome coverage, or the 70
magnitude and spread of whole-genome amplification bias, and is conceptually equivalent to a 71
“single-cell DNA library complexity.” 72
Amplicon-level bias dominates coverage variation
73
Visual inspection of single-cell sequencing coverage suggests that the genome coverage 74
varies at many different length scales (Fig. 1b). To systematically evaluate the amplification bias 75
in single-cell libraries, we sequenced multi-strand displacement amplified (MDA) DNA libraries 76
of diploid RPE-1 cells (5-10x) and compared the sequencing coverage to a matched, unamplified 77
bulk DNA library (~12x). To eliminate the effects of sequencing depths, we computationally 78
down sampled the bulk and single-cell DNA libraries and calculated the auto-correlation of base-79
level coverage in diploid chromosome 1 at various depths to examine coverage correlations at all 80
length scales (Fig. 2a, Supplementary Fig. 2). Both bulk and MDA libraries exhibited a 81
correlation at length scale lc ≈ 100 bp, reflecting the sequencing read length (101 bp). Looking
82
more closely we also identified a correlation at lc ≈ 250 bp, corresponding to the average size of
83
the paired-end fragments (Supplementary Fig. 2). As expected, the magnitude of such 84
correlations at the fragment scale decays with increasing sequencing depth. 85
Besides the fragment-level correlations, the bulk DNA sequencing coverage showed 86
minimal correlation between loci separated by more than 1 kb. In contrast, single-cell libraries 87
exhibited a prominent correlation in 1-100 kb that is independent of the sequencing depth. 88
Independent sequencing of the same single-cell library to 0.1x on the Illumina MiSeq platform 89
and to 9x on the HiSeq platform revealed the same correlation with a characteristic length lc ≈ 33
90
kb (Fig. 2a). The sequencing-depth-independent correlation reflects the intrinsic non-uniformity 91
in the DNA library and suggests a characteristic length scale of amplification bias. 92
The predominant correlation at lc suggests adjacent loci within this distance have
93
comparable coverage. This observation implies the primary source of coverage variation (or 94
amplification bias) is at or above the distance lc. Therefore, statistical variation of coverage at the
95
single-base level should reflect coverage variation at the amplicon level. To test this hypothesis, 96
we computed the cumulative distribution of bin-level coverage (bin size ≈ 17Kb, half of lc).
97
Normalizing the bin-level coverage by the mean depth-of-coverage, we found the cumulative 98
distribution of bin-level coverage to be nearly identical between independent sequencing at 9x or 99
at 0.1x (Fig. 2b), confirming that the amplicon-level coverage variation is intrinsic to the 100
amplified DNA but independent of the sequencing depth. Furthermore, the cumulative 101
distribution of single-base coverage at 9x sequencing depth aligned with the bin-level coverage 102
(Fig. 2b, Supplementary Fig. 2), suggesting that the amplicon-level variation was indeed the 103
dominant source of non-uniformity in single-cell libraries. 104
To further validate this conclusion, we computed the depth-of-coverage (DoC) curves 105
and the Lorenz curves for the bulk RPE-1 library and a single RPE-1 library by MDA at different 106
bin sizes (Supplementary Fig. 3). For the bulk library, the distribution of single-base level 107
coverage is indistinguishable from that evaluated at the bin level when the bin size is smaller 108
than the fragment size (~ 300 bp); above this scale the bin-level distribution is more uniform than 109
the single-base level distribution, reflecting smoothing of coverage non-uniformity. 110
By contrast, for the MDA generated library, the distribution of single-base level coverage 111
remains constant until the bin size exceeds the amplicon size ~ 10 kb. Characterization of 112
coverage non-uniformity by Lorenz curves22 also confirmed that the same bias was observed for 113
bin sizes less than or comparable to the amplicon size and was independent of the sequencing 114
depth. In particular, at sequencing depths ≪ 1x, the majority of the genome is uncovered and 115
shows no variation in the single-base-level coverage; amplification bias, however, is manifested 116
in the correlation between covered loci and can be evaluated by low-pass sequencing. For typical 117
MDA-generated libraries, the amplicon size (~ lc) is on the order of 10 kb, hence at 0.1x
118
sequencing depth there are 0.1 × 10⁴ /100 ≈ 10 reads (assuming 100 bp single-end reads) on 119
average for each amplicon. As long as the number of reads per amplicon is much larger than the 120
statistical variation due to random selection in sequencing (e.g., assuming poisson distribution, 121
the standard deviation of the observable is given by the square root of the expectation), the 122
percentage of such amplicons can be accurately calculated. At 0.1x sequencing, the amplicon-123
level coverage can accurately predict the fractional genome coverage down to 0.1x mean depth, 124
when there is approximately one read for each of these under-represented amplicons; below this 125
depth, low-pass sequencing at 0.1x cannot distinguish between regions that are severely under-126
amplified (< 0.1x mean depth) and those that dropped out of amplification. 127
Magnitude of amplicon-level variation determines coverage
128
We tested the validity of the correlation analysis by analyzing DNA libraries generated 129
from different types of cells and by different amplification technologies. For this purpose, we 130
analyzed single-cell sequencing data of additional RPE-1 samples (Supplementary Fig. 2) and 131
data from multiple published studies, including frozen glioblastoma nuclei27 (Supplementary 132
Fig. 4), single diploid lymphoblastoid cells5 (Supplementary Fig. 5), frozen single neuron
nuclei8 (Supplementary Fig. 6), single sperms6 (Supplementary Fig. 7), and SW480 tumor 134
cells22 (Supplementary Fig. 8); all samples were amplified by MDA. SW480 cells were also 135
amplified by quasi-linear multiple annealing and looping-based amplification cycles 136
(MALBAC). The amplicon size in MDA-generated libraries ranged from 5 to 50 kb, with the 137
sperm libraries having the lowest lc ≈ 5 kb (Supplementary Fig. 7). Interestingly, MDA of
138
hundreds or thousands of neurons exhibited similar amplicon sizes between 10-20 kb 139
(Supplementary Fig. 6), consistent with estimates by standard and alkaline gel electrophoresis8. 140
In contrast, MALBAC showed a much shorter correlation length ~ 600 bp (Supplementary Fig. 141
8), consistent with the reported average amplicon size (500-1500 bp)22. We also found
142
significant correlations at the fragment-size level in one single-cell library and the reference bulk 143
library5 that persisted at high sequencing depths (Supplementary Fig. 5); these correlations 144
reflected substantial GC bias at the fragment level absent in the other bulk libraries and likely 145
arose during library preparation due to PCR. Despite the vastly different correlation lengths 146
evident in MDA and MALBAC amplifications, our analysis accurately predicted the cumulative 147
coverage distribution in all libraries sequenced to above 10x from computationally down-148
sampled sequencing data at 1x or less (Supplementary Fig. 2, 4-8). 149
To benchmark the performance of different single-cell libraries, we compared the fraction 150
of covered genome (≥ 1x) when each library was sequenced to 1x. This percentage was either 151
computed directly from down-sampled data (when the original data had higher depths) or 152
inferred from the depth-of-coverage curve when the original data had lower depths. The 153
coverage benchmark was plotted against the magnitude of amplicon-level variation as measured 154
by the plateau correlation strength at the amplicon scale (Methods) (Fig. 2c). As expected, 155
smaller amplification bias results in a larger fraction of covered genome. Out of the five 156
published single-cell DNA sequencing studies analyzed here, the single-neuron libraries had the 157
best overall uniformity, followed by the two single YH1 libraries; the MALBAC libraries overall 158
had less amplification bias than MDA, although optimized MDA libraries performed equally 159
well. The frozen glioblastoma libraries (59 total) exhibited a range of variations that can be fitted 160
by an empirical relationship 161
(1)
162
where y is the percentage of covered genome and x is the (dimensionless) correlation magnitude. 163
Except for the single-sperm libraries that exhibited substantial bias, all other analyzed data 164
closely followed this relationship. This result suggested that the uniformity of genome coverage 165
is solely determined by the amplicon-level variation but not the amplicon size. Therefore, one 166
can directly employ this empirical relationship to benchmark the uniformity of single-cell 167
libraries by the correlation magnitude that can be accurately computed from low-pass sequencing 168
~ 0.1x. 169
We further selected the best single-cell libraries from each study and compared the 170
fraction of genome covered at different depths as observed in the original high-depth sequencing 171
(Fig. 2d). Due to the different sequencing depths applied to these libraries, we plotted all 172
cumulative genome coverage against the normalized depth (by the mean depth). The benchmark 173
of amplification uniformity as measured by the depth-of-coverage curve agrees with the 174
computed correlation magnitude (Fig. 2c inset). 175
Finally we also analyzed the base-level coverage in single-cell libraries amplified by 176
degenerate oligonucleotide primed PCR (DOP-PCR)28. The correlation was evident both at the 177
read length level (~ 50 bp) and on a longer scale ~ 200 bp (Supplementary Fig. 9) that is 178
consistent with the size of purified DOP-PCR product 4. In comparison to MDA or MALBAC 179
generated libraries, the smaller overall correlation magnitude (at the amplicon level) explains the 180
better uniformity of DOP-PCR. Interestingly, even for the MDA generated libraries, shorter 181
amplicon size tends to result in better uniformity (Supplementary Fig. 9); the underlying 182
mechanism for this observation requires further characterization. 183
Genome coverage variation reflects allele-level bias
184
Coverage at the locus-level includes contributions from homologous chromosomes (the 185
allele-level coverage). The same non-uniformity in the genome coverage, however, may result 186
from different combinations of non-uniformity at the allelic level (Fig. 3a). Although allele 187
coverage determines the sensitivity to detect heterozygous variants, we rarely consider this 188
aspect in bulk sequencing due to the comparable contributions of all alleles and largely uniform 189
coverage of the genome. In single-cell libraries, however, we often observe disproportionately 190
represented alleles and numerous loci may exhibit “allelic dropout”5,12. Consequently, the 191
detection sensitivity of hemizygous variants is measured by the allele coverage and needs to be 192
derived from the genome coverage. 193
To predict the allele coverage from the locus-level genome coverage, we considered two 194
limiting scenarios: a “segregated template model” (STM) assuming completely independent 195
amplification of homologous chromosomes, and a “mixed template model” (MTM) assuming 196
identical coverage of homologous chromosomes (as expected in bulk sequencing) (Fig. 3a). The 197
difference between the two models is most evident in highly amplified regions: STM implies 198
preferential amplification of one allele while MTM suggests that both alleles have been highly 199
amplified. Both models are analytically solvable and can be easily implemented computationally 200
(Methods, Supplementary Fig. 10). 201
We compared the model predictions for allele-level coverage to the observation at 202
germline heterozygous sites detected from bulk DNA sequencing (Fig. 3b, Supplementary Figs. 203
5,11). For glioblastoma libraries (Fig. 3b), both locus- and allele-level coverage was calculated
204
from disomic chromosome 12 at 1x sequencing depth. Coverage at heterozygous sites was 205
evaluated for different disomic chromosomes (5, 12, and 13) from higher-depth sequencing at 9-206
10x. As expected, the total coverage (reference plus alternate bases) at these sites agreed well 207
with the prediction for locus-level coverage, reflecting similar amplification bias for different 208
chromosomes with the same copy number. Meanwhile, coverage of either reference or alternate 209
bases followed the same distribution as predicted by the STM model. These results suggested 210
homologous chromosomes are amplified almost independently during WGA and manifest the 211
same degree of amplification bias. This discovery was further underscored by the agreement 212
between the observed coverage of monosomic chromosome 10 and the STM allele-coverage 213
prediction (Supplementary Fig. 11). 214
We further verified that coverage of alternate or reference alleles was indeed independent 215
of each other in the glioblastoma samples by looking at the distribution of alternate and reference 216
reads at heterozygous sites in disomic chromosome 5 (Supplementary Fig. 12). Interestingly, 217
the two-cell RPE-1 libraries showed positive correlations between the counts of the reference 218
and of the alternate alleles (Supplementary Fig. 12), consistent with the MTM model 219
(Supplementary Fig. 11). Of the two published single YH1 libraries5, one agreed better with the 220
MTM model and the other agreed with the STM model (Supplementary Fig. 5). Whether this 221
difference resulted from the cell’s initial condition (frozen vs. fresh), the stage of cell cycle, or 222
other factors requires further characterization. 223
Census-based strategy enables efficient variant detection
Our analytical prediction of the allele coverage measures the average probability of 225
capturing a single variant read in single-cell sequencing. In sequencing analysis, however, more 226
than one observation of the variant is necessary to mitigate sequencing errors. This requirement 227
substantially reduces the percentage of detectable variants at low sequencing depths. In one 228
example (GBM#4, correlation magnitude ≈ 4 for disomic chromosomes), the normalized allele 229
coverage implied that only 13.3% of clonal hemizygous variants could be confidently detected at 230
a mean sequencing depth of 1x when requiring at least two reads for each variant 231
(Supplementary Fig. 11). This percentage increased with sequencing depth to a limit of 79% at 232
100x. In contrast, the sensitivity to detect a sub-clonal mutation with allelic fraction of 0.4 in a 233
bulk library at 10x sequencing is ~ 80% and quickly reaches > 95% at a sequencing depth of 234
20x29. The reduced dependence of detection sensitivity on sequencing depth for single-cell 235
libraries suggested that deep sequencing of an individual library is not an efficient approach to 236
increase power for detecting variants from libraries prepared by WGA. 237
To overcome this challenge, we devised an approach to sequence a large number of 238
single-cell genomes at only modest depths (~ 1x). We simultaneously controlled for errors 239
resulting from random MDA artifacts or from sequencing by requiring true variants to appear in 240
multiple libraries (“census based”) (Fig. 4a). We expected this population-based approach to be 241
effective only when the amplification bias is random, but not recurrent (Fig. 1c). We thus 242
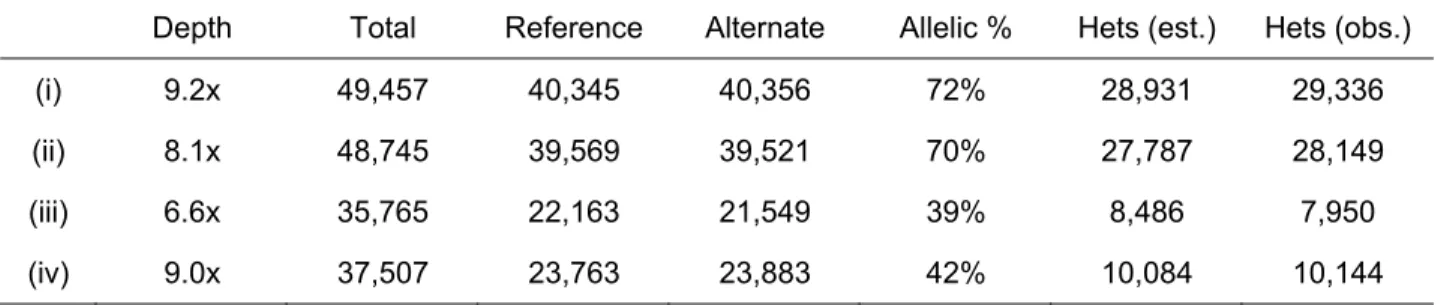
evaluated the correlation between the coverage of reference and alternate alleles in four 243
independent glioblastoma libraries. The small covariance (~ 0.01) between the coverage of each 244
given allele in different libraries is consistent with random MDA bias (Table 1). These data 245
contrasted with recurrent locus-specific amplification bias in degenerate-oligonucleotide-primed 246
PCR methods such as GenomePlex30. 247
We next examined how many single cells sequenced to the same total depth would 248
maximize the total allele coverage by census-based variant detection using a representative 249
library with modest bias (GBM#4, correlation magnitude ≈ 4) (Fig. 4b). In all cases, our model 250
predicted maximum allele coverage when each individual cell was sequenced to a modest depth 251
(~ 1x). We repeated this calculation using each of the other libraries as the representative, and 252
found that the optimal depth for detecting clonal and sub-clonal variants is always ≲1x (Fig. 4c). 253
To test this experimentally, we sequenced each of the following subsets of single 254
glioblastoma libraries to 20x total depth: 59 libraries (~ 0.33x per library), 22 libraries (~ 1x per 255
library), two libraries (~ 10x each, group A) with minimal bias (correlation magnitude ≈ 0.9 for 256
disomic chromosomes), and two libraries (~ 10x each, group B) with average bias (correlation 257
magnitude = 2~4). We genotyped germline heterozygous SNPs and detected somatic single 258
nucleotide variants (sSNVs) and small insertion/deletions (indels) by the census-based strategy 259
and compared the call sets with results from bulk DNA sequencing. For germline SNPs in 260
disomic chromosome 5, we observed that census-based detection in the two pools of single-cell 261
libraries (59 and 22 each) each uncovered more than 80% of all SNPs detected in bulk, while the 262
two sets of two libraries with minimal and average bias uncovered only ~ 30% and ~ 5% of the 263
heterozygous sites, respectively (Fig. 4d). A similar improvement in sensitivity was observed for 264
the detection of sSNVs and indels among the single cells sequenced to ~ 0.33x and ~ 1x per 265
library (as opposed to ~ 10x per library), detecting more somatic variants found in bulk whole-266
exome sequencing with fewer private or false positive calls (Fig. 4e, Supplementary Data 1 - 267
5). The false positive calls usually occur at low allele frequencies within each library and likely
268
reflect recurrent amplification errors and sequencing errors. Such errors are less frequent when 269
the library is sequenced to a low depth and can be suppressed by requiring more than one read 270
for each variant. Together, these data validate our statistical estimates of the variant detection 271
sensitivity from a population of single cell libraries and demonstrate that a census-based strategy 272
using only modest depths of sequencing for many single cells can substantially improve both 273
sensitivity and specificity for detecting variants compared to deep sequencing of individual 274
libraries. 275
Discussion
276Here we have established a universal method to characterize the amplification bias in 277
single-cell DNA libraries at both locus and allele levels. Based on our discovery that intrinsic 278
amplification bias occurs predominantly at the amplicon level, we demonstrated that the 279
cumulative distribution of bin-level coverage (with bin size set to the length scale of dominant 280
amplification bias) directly predicts the depth-of-coverage at any sequencing depth. We further 281
derived a quantitative measure of amplification bias that can directly predict locus-level coverage 282
via an empirical relationship. Our analysis thus provides a statistical description of the 283
relationship between the genomic coverage of single-cell DNA libraries and the intrinsic 284
amplification bias. This metric provides a robust benchmark that enables a quantitative 285
prediction of the complexity of single-cell libraries from low-pass sequencing (0.01~0.1x). 286
We demonstrated that amplification of different chromosomes (including different 287
homologous chromosomes) in a single cell is often independent (“segregated template model”), 288
reflecting random priming and amplification. This biophysical feature is fundamentally different 289
from amplification from bulk DNA, where allele-level coverage is strongly 290
correlated31,32(“mixed template model”). We proposed analytically solvable models that can 291
quantitatively predict the allele coverage of single-cell libraries at any sequencing depth. These 292
models provide the basic framework for estimating the detection sensitivity of hemizygous 293
genetic variants by single-cell sequencing. 294
The characteristic length in the coverage autocorrelation also determines the scale at 295
which the source of amplification bias should be characterized. In bulk DNA libraries, a 296
dominant bias at the fragment length level is shown to be associated with the sequence content 297
(GC%), but such bias quickly decays at longer length scales (Supplementary Fig. 5 and 6). In 298
MDA-generated libraries, however, we observed substantial variation even in regions with 299
similar GC content (Supplementary Fig. 6). This is in sharp contrast to MDAs from bulk 300
samples18,31-33. Such a wide range of variation reflects random priming bias17 instead of recurrent 301
polymerase extension bias, and may also depend on the size of DNA templates after cell lysis, 302
which is known to affect displacement efficiency21. Our discoveries of the amplicon-level 303
correlation and independent allele amplifications are both consistent with the dominant bias 304
being generated in the early stage of amplification of single DNA templates and reflect the 305
discrete nature of single-molecule biochemical reaction. As early stage bias can be exponentially 306
amplified during subsequent cycles of amplification, limited amplification should result in better 307
uniformity27,34.
308
The random nature of single-cell genome amplification further underscores the necessity 309
of cell specific bioinformatic tools and experimental design. Deep sequencing of single-310
cell libraries to recover measures of variant alleles easily extends the sequencing cost and 311
becomes prohibitive for libraries with extreme bias. Our analyses suggest a more practical 312
approach by (1) preparing individual sequencing libraries from many independent samples, and 313
(2) ranking and selecting the best libraries based on the complexity and the allelic coverage 314
predicted based on low-pass whole-genome sequencing of each library (~0.1x) before extensive 315
sequencing. 316
For clinical samples with a limited number of cells, such as fine-needle aspirates or 317
circulating tumor cells, the most interesting genetic variants are shared among the cells, 318
including both sub-clonal and clonal variants. For this purpose it is most efficient to perform 319
“census-based variant detection” from multiplexed sequencing of independently amplified 320
single-cell DNA libraries each sequenced to modest depths (~ 1x). The census-based variant 321
detection strategy simultaneously controls random errors due to sequencing (0.1-1% per 322
sequenced base) or amplification (~ 1% loci with error reads exceeding 10% allele frequency, 323
Supplementary Fig. 7, Refs. 27 and 34) and maximizes the total allele coverage at a given
324
sequencing depth by sampling many independently amplified libraries, thus enabling accurate 325
detection of somatic variants and dissection of clonal heterogeneity. 326
One technical complication in single-cell sequencing is DNA contamination. 327
Contamination of non-human-genomic DNA before whole-genome amplification will result in a 328
large percentage of sequencing reads that are not mapped to the reference assembly, which can 329
be readily identified and excluded by low-pass sequencing. The census-based strategy also 330
effectively controls human genomic DNA contamination limited to one single-cell library. 331
Contaminations to multiple single-cell libraries are usually present at many more copies than a 332
single-cell genome at the affected loci and should be recognizable as they are substantially 333
amplified after whole-genome amplification. 334
At the current stage, errors introduced during WGA prohibit an accurate characterization 335
of individual genetic variants within a single cell. (This task can be accomplished through 336
independent amplifications of biological replicates after cell division.) It is however possible to 337
infer global features of mutagenesis, such as the mutation rates in tumor progenitor cells or 338
circulating tumor cells, by single-cell sequencing after correcting the total number of detected 339
genetic variants by the statistical power for detecting variants in a single-cell library sequenced 340
to a certain depth. Our analyses have laid the foundation for single-cell genetic variant detection 341
by calibrating the amplification bias at both genomic and allelic levels. 342
343
Methods
344Amplification and sequencing of RPE-1 cells
345
The hTERT RPE-1 cell line stably expressing GFP-H2B was cultured and treated as 346
previously described36. Briefly, cells were transfected with a pool of siRNAs (Smartpool, 347
Dharmacon) against p53 using RNAiMAX (Invitrogen) according to the manufacturer’s 348
instructions. 18-hours later cells were treated with Nocodazole (100 ng/ml; Sigma) for 6 hours. 349
G2/M arrested cells were harvested by mitotic shake-off and replated after three washes with 350
medium. 4h after replating, G1- released cells were sorted into 384-well tissue culture plates and 351
cultured. Confirmed single cells were allowed to divide once, before being washed twice with 352
PBS and lysed and amplified within the 384-well tissue culture plate as outlined above. 353
Amplified DNA from two RPE-1 cells after one round of cell division was subject to 354
standard whole-genome DNA library preparation and assessed by low-pass sequencing ~ 0.1x 355
using the MiSeq platform (Illumina). DNA libraries of RPE cells (3 total) were then sequenced 356
to 4-9x on the HiSeq2500 platform (Illumina). Bulk RPE-1 DNA was sequenced to ~12x on the 357
HiSeq2500 platform (Illumina). 358
Processing of single-cell sequencing data
Sequencing reads from published studies were downloaded from the NCBI Short Read 360
Archive. For the diploid YH genome, we downloaded all sequencing runs of the bulk reference 361
(SRR294761) and two single-cell samples, “BGI_YH1” (SRR294759), and “BGI_YH2” 362
(SRR294760). For diploid neurons, we downloaded all the data from SRP014781, including 363
sequencing data for the bulk DNA, and for the whole-genome amplified products from single-364
cell DNA, 100-cell DNA, and 50,000-cell DNA. For haploid sperms, we downloaded the deep 365
sequencing data of 8 single sperm libraries, “Sperm23” (SRS344176), “Sperm24” (SRS344190), 366
“Sperm 27” (SRS344191), “Sperm28” (SRS344192), “Sperm101” (SRS344222), “Sperm113” 367
(SRS344223), “Sperm135” (SRS344224), “Sperm136” (SRS344225). For SW480 tumor cells, 368
we obtained data corresponding to the bulk reference (SRS374235), a single-cell MDA library 369
(SRS375060), and five single-cell MALBAC libraries (SRS373654, SRS374233, SRS375671, 370
SRS375672, SRS375673). Data of the glioblastoma libraries were generated from a previous 371
study and can be accessible from SRP052627. 372
Reads were aligned to the human genome reference (hg19/GRCh37) using bwa 373
(http://bio-bwa.sourceforge.net/) in the paired-end mode. The RPE and glioblastoma libraries 374
were aligned by “bwa aln” followed by “bwa sampe” with default parameters. The 375
remaining data were aligned by “bwa mem”. PCR duplicates were removed by 376
MarkDuplicates from PICARD (http://picard.sourceforge.net/). Sequencing data of the
377
glioblastoma libraries and the matching blood were recalibrated and indel-realigned by GATK
378
(http://www.broadinstitute.org/gatk/) before variant detection. 379
Down-sampling of deep sequencing data to ~1x was done by DownsampleSam from 380
PICARD. Base-level sequencing coverage was enumerated by the DepthOfCoverage module
381
from GATK with minimum read mapping quality set to 5.
To evaluate the allele coverage in RPE-1 MDA libraries, we detected heterozygous SNPs 383
in Chr.1 of the RPE-1 cells from the sequencing of bulk RPE-1 DNA (~12x) and individual 384
MDA libraries by UnifiedGenotyper from GATK; only variants with Qual. ≥ 100 and at least
385
three reference and three alternate reads in the bulk sample were selected to evaluate the allele 386
coverage in MDA libraries. For other samples, we genotyped HapMap SNPs (v3.3) to 387
estimate the allelic coverage; only variants found to be heterozygous in the matching blood with 388
Qual. ≥ 500 were selected and genotyped in each set of glioblastoma libraries. Somatic single-389
nucleotide variants and small insertions/deletions were detected by HaplotypeCaller from GATK
390
in each set of glioblastoma libraries and in the bulk library, and by MuTect29 from bulk whole-391
exome sequencing. 392
Computation of auto-correlation function of sequence coverage
393
The dimensionless auto-correlation function of coverage is defined as 394
. (1) 395
The brackets denote average over all genomic loci x and Δ measures the spread of correlation. In 396
computing the auto-correlation functions we only include regions not adjacent to the assembly 397
gaps. (Adjacency is determined by the step Δ.) 398
The correlation function is fitted to an exponential form to estimate the correlation length 399
lc:
400
. (2) 401
For MDA, the correlation length lc is on the order of 10 kb and the correlation function G(Δ) is
402
roughly constant above the fragment length (~300 bp) and below the correlation length lc. In this
403
regime, G(Δ) can be written as 404
. (3) 405
406
Here is the average coverage within each bin [x, x + Δ). It becomes evident that G(Δ) 407
measures the standard deviation of bin-level coverage. For convenience, we choose to evaluate 408
G(Δ) at Δ = 1 kb as a quantitative metric of the magnitude of amplification bias (correlation
409
strength). 410
Statistical models for predicting allele coverage from genome coverage
411
The power to detect a genetic variant is given by the probability that this variant locus 412
(usually of one chromosome) is represented in the sequencing data, or the relative abundance of 413
variant-supporting reads. But the direct observable in sequencing data is the total number of 414
reads covering all possible alleles, i.e., 415
, (4) 416
417
where C is the total observed coverage at a given locus as a sum of contributions from each allele 418
denoted by mi.
419
In the presence of amplification bias both C and mi’s vary across the genome. The
420
distribution of C across different loci can be straightforwardly evaluated from the depth-of-421
coverage curve; here we want to infer the statistical distribution of mi when the distribution of C
422
is known. The segregated template model (STM) assumes that amplifications of homologous 423
chromosomes are independent. As a consequence, the counts of reference and of alternate bases 424
at heterozygous sites are independent, and one highly amplified allele may dominate over the 425
remaining ones. In the mixed template model (MTM), different alleles are assumed to be 426
amplified to the same extent at every individual locus. As a result, the counts of reference and of 427
alternate bases at heterozygous sites follow a symmetric binomial distribution. 428
In mathematical terms, mi’s are independent of each other but follow the same
429
distribution in STM. In this scenario, one can numerically compute the distribution of mi from
430
the characteristic functions C(k) and m(k) (i.e, the Fourier transforms of the probability 431
distribution for C and m) which satisfy 432
. (5) 433
434
Here we present an iterative method to calculate the distribution of mi and illustrate this method
435
using a diploid genome (i.e., n = 2). 436
At a given sequencing depth, denote the total percentage of loci that are covered ≥1x by f, 437
. (6) 438
439
the percentage of loci that are covered in a particular allele is denoted by 440
. (7) 441
442
It is then straightforward to see that 443 (8) 444 445 or 446 . (9) 447 448
Hence in a region with n alleles, the probability that a given allele is covered is given by 449
. (10) 450
451
For diploid genomes, this becomes 452
. (11) 453
454
We can expand this further to compute the coverage at higher depths. For example, 455
(12) 456
If we denote the percentage of loci where total coverage is at or above two as f2, and the
457
percentage of loci covered at or above two for each allele as λ2, then we have
458 , (13) 459 or 460 . (14) 461 462
The iteration can be continued to calculate the allele coverage at any depth, 463 (15) 464 or (denoting λ0 = 1, λ1 = λ, etc.) 465 , (16) 466 which gives 467 . (17) 468
In the mixed template model, we assume that the local coverage C is a mixture of all 469
alleles randomly sampled at the same frequency. In disomic regions, this implies that m follows a 470
binomial distribution B(C, 0.5) at any total coverage C. Under this model we have 471
(18) 472
where the sum runs over all observed local coverage (t =1, 2, … M). The series converges 473
quickly as both ft and the exponential prefactor decay quickly. Furthermore, one easily verifies
474
that when f is small, this result is equal to the segregated template model to the leading order (1/2 475
f).
476
It is also straightforward to calculate the allele coverage at higher depths. 477
. (19) 478
Census-based detection sensitivity from a pool of single-cell libraries
479
As the percentage of genome that is covered at or above 1x at any sequencing depth can 480
be estimated, we can also predict the census-based detection power for hemizygous variants in a 481
pool of single-cell libraries. Consider a total number of Y libraries having similar amplification 482
bias and the probability of observing a hemizygous variant in any of the Y libraries is given by λ, 483
then the probability for observing this variant in a subset of libraries (X out of Y) is given by 484
. (20) 485
We can then compute this for a sub-clonal variant at clonal fraction y in a total of Z 486
libraries from 487
, (21) 488
where random selection of cells containing the sub-clonal variant follows a binomial distribution 489
B(Z,y). 490
491 492
References
4931. Kalisky, T., Blainey, P. & Quake, S. R. Genomic Analysis at the Single-Cell Level. Annu. 494
Rev. Genet. 45, 431–445 (2011).
495
2. Shapiro, E., Biezuner, T. & Linnarsson, S. Single-cell sequencing-based technologies will 496
revolutionize whole-organism science. Nat. Rev. Genet. 14, 618-630 (2013). 497
3. Chi, K. R. Singled out for sequencing. Nat. Methods 11, 13–17 (2014). 498
4. Navin, N. et al. Tumour evolution inferred by single-cell sequencing. Nature 472, 90–94
499
(2011). 500
5. Hou, Y. et al. Single-cell exome sequencing and monoclonal evolution of a
JAK2-501
negative myeloproliferative neoplasm. Cell 148, 873–885 (2012). 502
6. Wang, J., Fan, H. C., Behr, B. & Quake, S. R. Genome-wide Single-Cell Analysis of 503
Recombination Activity and De Novo Mutation Rates in Human Sperm. Cell 150, 402– 504
412 (2012). 505
7. Lu, S. et al. Probing Meiotic Recombination and Aneuploidy of Single Sperm Cells by
506
Whole-Genome Sequencing. Science 338, 1627–1630 (2012). 507
8. Evrony, G. D. et al. Single-Neuron Sequencing Analysis of L1 Retrotransposition and 508
Somatic Mutation in the Human Brain. Cell 151, 483–496 (2012). 509
9. McConnell, M. J. et al. Mosaic copy number variation in human neurons. Science 342,
510
632–637 (2013). 511
10. Shalek, A. K. et al. Single-cell transcriptomics reveals bimodality in expression and 512
splicing in immune cells. Nature 498, 236–240 (2013). 513
11. Xue, Z. et al. Genetic programs in human and mouse early embryos revealed by
single-514
cell RNA sequencing. Nature 500, 593–597 (2013). 515
12. Lohr, JG. et al. Whole exome sequencing of circulating tumor cells provides a window
516
into metastatic prostate cancer. Nat. Biotechnol. 32, 479-484 (2014). 517
13. Ni, X. et al. Reproducible copy number variation patterns among single circulating tumor
518
cells of lung cancer patients. Proc. Natl. Acad. Sci. USA 110, 21083-21088 (2013). 519
14. Eberwine, J., Sul, J.-Y., Bartfai, T. & Kim, J. The promise of single-cell sequencing. Nat. 520
Methods 11, 25–27 (2013).
521
15. Blainey, P. C. The future is now: single-cell genomics of bacteria and archaea. FEMS 522
Microbiol Rev 37, 407–427 (2013).
523
16. Zhang, L. et al. Whole genome amplification from a single cell: Implications for genetic
524
analysis. Proc. Natl. Acad. Sci. USA 89, 5847-5851 (1992). 525
17. Zhang, K. et al. Sequencing genomes from single cells by polymerase cloning. Nat.
526
Biotechnol. 24, 680-685 (2006).
527
18. Pinard, R. et al. Assessment of whole genome amplification-induced bias through high-528
throughput, massively parallel whole-genome sequencing. BMC Genomics 7, 216 (2006). 529
19. Geigl, J. B. et al. Identification of small gains and losses in single cells after whole 530
genome amplification on tiling oligo arrays. Nucleic Acids Res. 37, e105 (2009). 531
20. Dean, F. B. et al. Comprehensive human genome amplification using multiple 532
displacement amplification. Proc. Natl. Acad. Sci. USA 99, 5261-5266 (2002). 533
21. Lage, J. M. et al. Whole genome analysis of genetic alterations in small DNA samples 534
using hyperbranched strand displacement amplification and array-CGH. Genome Res. 13, 535
294-307 (2003). 536
22. Zong, C., Lu, S., Chapman, A. R. & Xie, X. S. Genome-Wide Detection of Single-537
Nucleotide and Copy-Number Variations of a Single Human Cell. Science 338, 1622-538
1626 (2012). 539
23. Gole, J. et al. Massively parallel polymerase cloning and genome sequencing of single
540
cells using nanoliter microwells. Nat. Biotechnol. 31, 1126-1132 (2013). 541
24. Lander, E. S. & Waterman, M. S. Genomic mapping by fingerprinting random clones: a 542
mathematical analysis. Genomics 2, 231–239 (1988). 543
25. DePristo, M. A. et al. A framework for variation discovery and genotyping using next-544
generation DNA sequencing data. Nat. Genet. 43, 491–498 (2011). 545
26. Daley, T. & Smith, A. D. Predicting the molecular complexity of sequencing libraries. 546
Nat. Methods 10, 325–327 (2013).
547
27. Francis, J. M. et al. EGFR variant heterogeneity in glioblastoma resolved through
single-548
nucleus sequencing. Cancer Discovery 4, 956-971 (2014). 549
28. Wang et al. Clonal evolution in breast cancer revealed by single nucleus genome
550
sequencing. Nature 512, 155-160 (2014). 551
29. Cibulskis, K. et al. Sensitive detection of somatic point mutations in impure and
552
heterogeneous cancer samples. Nat Biotechnol 31, 213–219 (2013). 553
30. Voet, T. et al. Single-cell paired-end genome sequencing reveals structural variation per 554
cell cycle. Nucleic Acids Res. 41, 6119-6138 (2013). 555
31. Hosono, S. et al. Unbiased whole-genome amplification directly from clinical samples.
556
Genome Res. 13, 954-964 (2003).
557
32. Paez, J. G. et al. Genome coverage and sequence fidelity of phi29 polymerase-based 558
multiple strand displacement whole-genome amplification. Nucleic Acids Res. 32, e71 559
(2004). 560
33. Pugh, T. J. et al. Impact of whole genome amplification on analysis of copy number 561
variants. Nucleic Acids Res. 36, e80 (2008). 562
34. De Bourcy et al. A quantitative comparison of single-cell whole genome amplification
563
methods. PLoS One 9, e105585 (2014). 564
35. Baslan, T. et al. Genome-wide copy number analysis of single cells. Nat. Prot. 6,
1024-565
1041 (2012). 566
36. Ganem N. J., Godinho, S. A., Pellman D. A mechanism linking extra centrosomes to 567
chromosomal instability. Nature 460 278-282 (2009). 568
Acknowledgements
569We thank Dr. David Pellman for sharing the sequencing data on RPE cells, M. Leibowitz, X. 570
Cai, and G. Evrony for discussions, and the Koch Institute Swanson Biotechnology Center 571
(specifically the BioMicro Center) for technical support. C.-Z.Z. was supported by the National 572
Cancer Institute (U24CA143867 to M.M.). V.A.A. was supported in part by a graduate 573
fellowship from the National Science Foundation. J.C.L. is a Camille Dreyfus Teacher-Scholar. 574
This work was supported by the Bridge Project, a collaboration between Koch Institute for 575
Integrative Cancer Research at MIT and the Dana-Farber/Harvard Cancer Center (DF/HCC) to 576
(J.C.L, K.L.L and M.M.), and the National Brain Tumor Society. This work was also supported 577
in part by Janssen Pharmaceuticals, Inc., and the Koch Institute Support (core) Grant P30-578
CA14051 from the National Cancer Institute. 579
Author contributions
580C.Z.Z. and V.A.A. initiated the project and carried out the analysis. C.Z.Z. performed analysis of 581
amplification bias; V.A.A. performed analysis of census-based detection sensitivity with help 582
from C.Z.Z. J.F., H.C., C.M., and K.L. prepared sequencing libraries for the RPE cell line and 583
glioblastoma samples. C.Z.Z., V.A.A., J.C.L., and M.M. wrote the manuscript with help from all 584
authors. M.M. and J.C.L. supervised the study. 585
Competing interests
586M.M. is a founder and equity holder of Foundation Medicine, a for-profit company that provides 587
next-generation sequencing diagnostic services. 588
Data access
589The sequence data have been deposited in the Short Read Archive from NCBI under the 590
following accession codes: RPE-1 bulk (SRX858057); two-cell RPE libraries (SRX858832, 591
SRR1779331 for RPE#1, SRR1779329 for RPE#2, SRR1779330 for RPE#3); single RPE 592
libraries (SRX858836, SRX858838, SRX858840, SRX858841); glioblastoma bulk whole-593
genome sequencing (SRX848889); glioblastoma bulk whole-exome sequencing (SRX857666); 594
single-glioblastoma nuclei pool #1 (59 nuclei, SRX858332); single-glioblastoma nuclei pool #2 595 (22 nuclei, SRR1778915, SRR1779027, SRR1779078, SRR1779079, SRR1779080, 596 SRR1779083, SRR1779085, SRR1779088, SRR1779089, SRR1779091, SRR1779092, 597 SRR1779093, SRR1779095, SRR1779098, SRR1779157, SRR1779161, SRR1779163, 598 SRR1779167, SRR1779172, SRR1779174, SRR1779175, SRR1779177); deeply sequenced 599
single-glioblastoma nuclei (SRX858848, SRR1779345 for GBM #1, SRR1779347 for GBM 600
#2; SRR1779348 for GBM #3; SRR1779350 for GBM #4); whole-genome sequencing of 601
blood reference for the glioblastoma patient (SRX851083); whole-exome sequencing of the 602
blood reference for the glioblastoma patient (SRX857684). 603
Figure legends:
604Figure 1 | Non-uniformity in genome coverage and its impact on the sequencing yield (a)
605
Dependence of the information yield on the sequencing depth. Deeper sequencing of bulk 606
libraries yields information on a larger population of cells; deeper sequencing of whole-genome 607
amplified single-cell libraries reveals information on a larger fraction of the genome (thick lines). 608
(b) Genome coverage bias at different levels. “Amplification bias” (top): Whole-genome 609
amplification generates coverage bias at the amplicon level, which is around 10-50 kb for multi-610
strand displacement amplification. “Sequencing bias” (bottom): Non-uniformity in the selection 611
of sequencing fragments can be caused by multiple sources of bias including whole-genome 612
amplification: the variation in sequencing coverage can be observed from 100 bp to multiple 613
megabases. (c) Schematic representations of recurrent and random amplification bias from 614
multiple independent amplifications of the same DNA material. 615
616
Figure 2 | Statistical analysis of whole-genome amplification bias and coverage uniformity
617
(a) Autocorrelation in the genome coverage of a two-cell RPE-1 DNA library (RPE#1) amplified 618
by multi-strand displacement amplification (MDA). The same library independently sequenced 619
to 0.1x (open triangles) and to 8x (solid triangles) exhibits a correlation above 1kb that is 620
invariant at intermediate depths (shaded triangles) from downsampling of the 9x sequencing 621
data. Black dashed curve represents exponential fitting of the autocorrelation in the 1-100 kb 622
range as 2 + 0.17e Δ/lc with a correlation length lc = 33 kb. This correlation is absent in the bulk
623
library sequenced to different depths. Both the bulk and the MDA-generated libraries show a 624
sequencing-fragment-level correlation (lc =100 bp) that decays with the sequencing depth. (b)
625
The identical normalized cumulative coverage at bin size 1/2 lc evaluated from the 9x (solid) and
626
from the 0.1x sequencing (dashed) reflects the same amplicon-level variation due to MDA. The 627
agreement between bin-level (dashed and solid lines) and base-level (red dots) depth-of-coverage 628
curves further suggests that the bin-level variation contributes the dominant amplification bias. 629
See Supplementary Figs. 2,4-8 for more examples of the correlation (a) and coverage (b) 630
analysis of single-cell sequencing data from different studies. (c) Relationship between genome 631
coverage (% covered at 1x mean sequencing depth) and amplification bias (measured by the 632
amplitude of the amplicon-level correlation) of single-cell libraries from different studies. 633
Coverage is evaluated at Chr.1 for both haploid sperms and diploid cells, as well as the SW480 634
tumor cells (disomic in Chr.1), and at Chr.10 (monosomic), Chr.12 (disomic), and Chr.13 635
(disomic) for glioblastoma nuclei. The inverse dependence is fitted with an empirical formula, y 636
= 0.86/(1.2+√x). (d) Comparison of the cumulative coverage in the most uniform single-cell 637
library from each study. Data were directly evaluated from high-depth sequencing of all samples 638
except the neuron library for which the curve was interpolated from 0.5x sequencing as in (b). 639
640
Figure 3 | Amplification bias of homologous chromosomes. (a) Schematic illustration of the
641
“mixed template model” and the “segregated template model” reflecting different allele-level 642
contributions to the same locus-level coverage. (Methods, Supplementary Fig. 10). (b) 643
Comparison of the allele coverage predictions (“Pre.”) from 1x sequencing depth with the 644
observed coverage at heterozygous sites (“Obs.”) at 9x sequencing depth in three single 645
glioblastoma libraries. The combined coverage of reference and alternate bases (red dots) at 9x 646
sequencing validates the prediction from 1x sequencing (dashed curve). The allele coverage 647
(reference or alternate) is then predicted from the combined coverage assuming mixed templates 648
(MTM, blue dotted lines) or segregated templates (STM, green dotted lines) and compared to the 649
coverage of reference (blue triangles) or alternate (green triangles) bases at heterozygous sites. 650
The predictions were made from the sequence coverage in disomic Chr. 12 but the agreement 651
with observations in different disomic chromosomes demonstrate that amplification bias is 652
consistent in all chromosomes. 653
654
Figure 4 | Variant detection in single-cell genomes. (a) Census-based variant calling requires
655
that acceptable variants be observed in at least two independent single-cell libraries. (b) 656
Estimates of the census-based detection sensitivity for a population of independently amplified 657
single-cell libraries all assumed to have similar amplification bias as GBM#4 (Supplementary 658
Fig. 11). Optimal detection sensitivity is achieved at roughly 0.5x depth-per-library regardless of
659
the sub-clonal fraction or the total sequencing depth. (c) Optimal depth-per-library for census-660
based variant detection in a population of independently amplified single-cell libraries assumed 661
to have similar coverage bias. The range of the optimal depths is calculated based on the 662
amplification bias observed in single glioblastoma libraries in Fig. 2b. For libraries with more 663
bias or for the detection of variants with lower clonal fractions it is optimal to sequence more 664
libraries at modest depths (0.1-0.5x). (d) Observed coverage of reference and alternate bases at 665
heterozygous SNP sites in disomic Chr.5 as an estimate of the census-based detection sensitivity 666
for clonal variants. A varying number of single glioblastoma nuclei (59, 22, and 2) were 667
sequenced to the same total depth (20x) and genotyped at germline heterozygous SNP sites. 668
Group (A) included two cells with the best uniformity and group (B) included two cells with 669
average uniformity. For either heterozygous coverage or the detection of alternate bases, the 670
larger pools offer better sensitivity than the two groups of two cells. (e) Comparison between 671
somatic non-synonymous variants detected in different sized pools of single cells sequenced to 672
the same total depths (20x). The truth set (48 variants in total) included 43 variants that were 673
detected in both 30x whole-genome and 120x whole-exome sequencing of bulk tumor DNA, 674
plus five additional variants detected in bulk whole-genome and single-cell sequencing. At the 675
same overall sequencing depth, census-based detection from a population of cells (59 and 22) 676
offers higher sensitivity and better specificity over deep sequencing of two libraries. A larger 677
number of private/false positive mutations are observed when individual samples are sequenced 678
to higher depths, and these private calls often arise from sporadic sequencing errors that coincide 679
with amplification errors. 680
681
Tables:
682Table 1 | Overlap and correlation between allele coverage in independent single-cell libraries by
683
multi-strand displacement amplification. Allele coverage in each library is evaluated by the 684
number of covered HapMap heterozygous SNP sites in disomic chromosome 5 detected in bulk 685
sequencing (combining blood and bulk tumor) by UnifiedGenotyper (Qual. ≥ 500). (a) In each 686
single-cell library, coverage of A and B alleles is almost equal and the expected overlap 687
assuming random A or B allele coverage—the estimated coverage of heterozygous sites—is 688
comparable to the observed number of heterozygous sites. (b) The overlap between different 689
single-cell libraries’ coverage of each allele is also close to the expected overlap based on 690
random allele coverage. 691
a
original genome
WGA amplicons
sequencing fragments
variation in genome coverage representations of DNA sequences
over amplified under amplified amplification bias sequencing bias ~ 1 kb
b Coverage bias at different levels
uniform 10 ~ 50 kb for MDA variation at different scales
Fig. 1
c Recurrent and random amplification bias
WGA1
WGA2
WGA3
recurrent amplification bias random amplification bias
WGA1
WGA2
WGA3
Library complexity and sequencing yield
bulk DNA libraries whole-genome amplified single-cell DNA libraries
original genome DNA library d e p th d e p th 10 ~ 50 kb for MDA
a b 10−2 10−1 100 101 0.2 0.4 0.6 0.8 1 0.1x MDA 9x MDA 9x MDA locus-level coverage bin-level coverage fra ct io n o f g e n o me
Fig. 2
100 102 104 106 10−1 100 101 correlation at thefragment level MDA
bulk 0.1x 0.25x 0.5x 1x 2x 4x 8x 4x 9x 12x correlation at the amplicon level c correlation strength fr a c ti o n o f g e n o m e c o v e re d 0 10 20 30 40 50 0 0.1 0.2 0.3 0.4 0.5 0.6 glioblastomas (Epicentre) neurons (Epicentre) YH1 (Repli-G 12’) sperms (Repli-G 12’) single RPEs (Repli-G 14’)
SW480 (MALBAC) SW480 (MDA, GE) 0 1 2 3 0.3 0.4 0.5 0.6 0 1 normalized depth fra ct io n o f g e n o me YH1 (Repli-G 12’) RPE single (Repli-G 14’)
Glioblastoma (epicentre) SW480 (MALBAC) Neuron (epicentre) normalized depth 0.2 0.4 0.6 0.8 10−1 100 101 d
separation between loci
n o rma lize d a u to -co rre la ti o n
locus-level (combined)
mixed template segregated template
allele A
allele B
correlated coverage of allele A and allele B
independent coverage of allele A and allele B
a
Amplification of homologous chromosomesallele A allele B
b Allele coverage predictions for single glioblastoma libraries
100 101 102 0 0.2 0.4 0.6 0.8 1 ref allele alt allele combined observation from 9x prediction from 1x MTM STM locus-level p e rce n ta g e o f SN Ps depth of coverage 100 101 102 0 0.2 0.4 0.6 0.8 1 100 101 102 0 0.2 0.4 0.6 0.8 1 p e rce n ta g e o f SN Ps depth of coverage p e rce n ta g e o f SN Ps depth of coverage Obs. (Chr. 5) vs. Pre. (Chr. 12) GBM #1 GBM #2 GBM #3
Obs. (Chr. 13) vs. Pre. (Chr. 12) Obs. (Chr. 12) vs. Pre. (Chr. 12)
Fig. 3
allelic distortion in amplification
uneven coverage at heterozygous sites
a census-based variant calling
library #1 2 3
accept (variant allele detected in ≥ 2 libraries) reject (variant allele detected in 1 library only)
..
.
census-based sensitivity = % allele covered in ≥ 2 libraries
0.6 0.3 0.1 0.25 0.5 1 2 4 5 10 20 30 su b cl o n a lit y
depth per library (x)
20x total sequencing depth
40x 60x 0 0.5 1 1 0.6 0.3 0.1 1 0.6 0.3 0.1 1 b
depth per library (x)
predicted optimal depth per library
c su b cl o n a lit y 1 1.5 0 0.5 1 0.6 0.3 0.1
predicted census-based sensitivity
0 0.2 0.4 0.6 0.8 1 d SN Ps d e te c te d ( % ) SSN Vs/ in d e ls d e te ct e d (# ) 0 10 20 30 40 also in bulk
private / false positive
e
59
observed census-based sensitivity (germline/clonal) observed census-based sensitivity (somatic/subclonal)
both alleles (correct genotype) at least alt. allele
22 2 (A) 2 (B) 4 20x total 40x # cells sequenced # cells sequenced 59 22 2 (A) 2 (B) 4 59 22 2 (A) 2 (B) 4 20x total 40x 20x total 40x # cells sequenced
Fig. 4
Table 1a | Coverage at heterozygous sites in single glioblastoma nuclei libraries
Depth Total Reference Alternate Allelic % Hets (est.) Hets (obs.)
(i) 9.2x 49,457 40,345 40,356 72% 28,931 29,336 (ii) 8.1x 48,745 39,569 39,521 70% 27,787 28,149 (iii) 6.6x 35,765 22,163 21,549 39% 8,486 7,950 (iv) 9.0x 37,507 23,763 23,883 42% 10,084 10,144 Total germline heterozygous SNPs in Chr. 5: 56,278 (qual. ≥ 500, HapMap)
Table 1b | Overlap between independent single-nuclei libraries ( Covariance = pAB − pA • pB )
Allele A Allele B Cell (i) 40,345 40,356 Cell (ii) 39,569 39,521 Overlap 28,912 28,953 Covariance 0.010 0.011 Allele A Allele B Cell (i) 39,569 39,521 Cell (ii) 22,163 21,549 Overlap 15,290 15,195 Covariance 0.006 0.001 Allele A Allele B Cell (i) 40,345 40,356 Cell (ii) 23,763 23,883 Overlap 17,420 17,521 Covariance 0.007 0.007