XV. COMMUNICATIONS BIOPHYSICS
Prof. W. A. Rosenblith Dr. T. T. SandeltT G. E. Forsen
Prof. M. H. Goldstein, Jr. Dr. W. Storm van Leeuwentit Margaret Z. Freeman
Dr. J. S. Barlowt Dr. W. van Bergei-k tt C. D. Geisler Dr. M. A. B. Braziert W. A. Clark, Jr. tf J. L. Hall II
Dr. Eda Bergert O. C. Gutierrez**** B. D. King
Dr. M. Eden** Aurice V. Albert C. E. Molnar
Dr. B. G. Farleytt R. Balsells D. F. O'Brien
Dr. G. L. Gerstein$$ R. M. Brown W. T. Peake
Dr. F. B. Goffinjt J. D. Cowantttt R. F. Webber
Dr. N. Y-S. Kiang A. H. Crist T. F. Weiss
Dr. J. W. Kuiper*** C. D. Woody
A. A SMALL ELECTRONIC ANALOG AVERAGER AND VARIANCE COMPUTER
FOR EVOKED POTENTIALS OF THE BRAINTttt
The detection by visual means of cortical potentials evoked by sensory or electric stimuli is frequently difficult or impossible if the level of the background activity of the cortex is of equal or higher amplitude than the evoked cortical potentials themselves. One means of surmounting this difficulty is that of averaging many responses (1); the
potentials of the response will be accentuated, relative to the background activity, by the averaging process because these potentials follow the stimulus at a constant latency.
For the computation of the averages of evoked responses with the present device, a considerably modified form of an earlier model (2, 3), brain potentials as well as brief pulses occurring synchronously with the stimuli (hereafter referred to as "stimuli") are recorded simultaneously on magnetic tape after appropriate amplification by means of
This work was supported in part by the U.S. Air Force under Contract AF19(604)-4112.
tResearch Associate in Communication Sciences from the Neurophysiological Laboratory of the Neurology Service of Massachusetts General Hospital. The work of this Laboratory is aided by grants from the U. S. National Institute of Neurological Diseases and Blindness (B 369 Physiology), the U.S. Navy (Office of Naval Research NR 101-445) and the U.S. Air Force (Office of Scientific Research AF-49-(638)-98). IPostdoctoral Fellow of the National Institute of Mental Health.
Research Associate in Communication Sciences on leave from the National Heart Institute. ttStaff Member, Lincoln Laboratory, M. I. T.
IPostdoctoral Fellow of the National Institute of Neurological Diseases and Blindness. Sloan Postdoctoral Fellow of School for Advanced Study, M.I. T.
tResearch Associate in Communication Sciences; also Research Fellow in Neurology, Massachusetts General Hospital. (Visiting Fulbright Fellow from Electro-Neurological Department, Academisch Ziekenhuis, Leiden.)
On leave from Bell Telephone Laboratories, Inc., Murray Hill, New Jersey.
Doherty Foundation Fellow.
MtGraduate Fellow of British Tabulating Machine Company, Ltd.
T This work was supported in part by a special traineeship (BT-437) from the U.S. National Institute of Neurological Diseases and Blindness, U.S. Public Health Service, and was presented at the Inter-national Conference on Medical Electronics, Paris, June 24-27, 1959.
(XV. COMMUNICATIONS BIOPHYSICS)
a conventional electroencephalograph or by physiological amplifiers. The results are then obtained as the tape is played back repeatedly in the form of an endless loop. By means of commercial delay equipment, the stimuli are delayed in time with respect to the brain potentials. For a given delay, the instantaneous voltage of the brain potentials for each of the set of stimuli is noted. An average of all such samples for one revolution of the tape is obtained by means of a Miller integrator, and the result is written out on an
Esterline-Angus graphic milliammeter. The process is repeated with another value of the delay for another revolution of the tape, and so on. The resulting plot of averages
against the delay then gives the averaged evoked response for the particular sample of signal recorded on the tape loop. For computation of the variance of the averaged sig-nal, the procedure is identical to that described above, except that the sample signal is squared before being fed to the integrator.
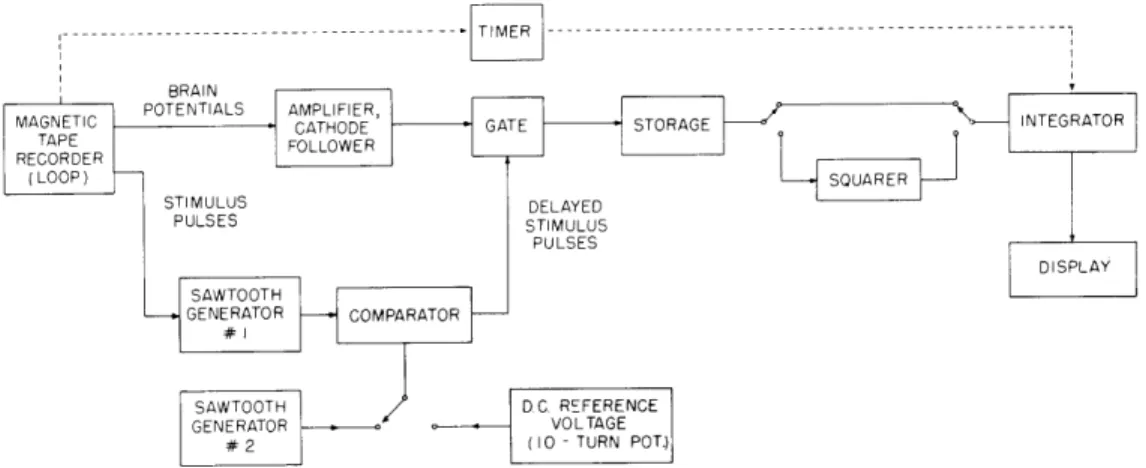
Figure XV-1 shows a block diagram of the computer. The tape-recorded brain potentials are played back at a faster speed than that used for the original recording;
BRAIN
POTENTIALS AMPLIFIER,INTEGRATOR
SAWTTAPE FOLLO WER
GENERATOR VOLPARTAGE RECORDER (LOOP) SQUARER STIMULUS DELAYED PULSES STIMULUS PULSES SAWTOOTH GENERATOR COMPARATOR GENERATOR - - VOLTAGE
#2 (10 IO- TURN POT.)
Fig. XV-1. Block diagram of analog averager and variance computer.
the choice of the speed-up factor is determined by the bandwidth of the recorded brain potentials. For the Ampex FM tape recorder that is used with this instrument, the loop is played back at 60 inches per second, the corresponding upper frequency limit for the modulating signal being 10 kc/sec. For electroencephalographic potentials in the
fre-quency range of 1-30 cps, a speed-up factor of 200 can be used; the corresponding
fre-quency range of the signal that is fed to the computer is then 200-6000 cps.
Delay of the stimuli is accomplished by comparison, by means of a Tekronix Pulse
Generator Type 161, of two saw-tooth waveforms; one (from saw-tooth generator no. 1
in Fig. XV-1) is triggered by the stimuli recovered from the magnetic tape, and the other (from saw-tooth generator no. 2) is triggered manually at the start of a computation.
(XV. COMMUNICATIONS BIOPHYSICS)
These two saw-tooth waveforms, which are obtained from Tektronix Waveform Genera-tors Type 162, are identical except for their time duration; the duration of the first wave-form is made equal to the maximum delay desired for the particular computation (a
range from 100 sec to 10 sec is possible), and that of the second is made equal to the time required for the computation of the entire average, that is, for all values of delay. Positive and negative pulses, which thus constitute the delayed stimuli, are generated by the comparator on each occasion when the voltages of the two saw-tooth waveforms are equal. The time duration of the second saw-tooth waveform (and thus the time required for the total computation) is made sufficiently long (of the order of a few min-utes) so that the delay of the stimuli is made to increase very slowly relative to the time required for one revolution of the tape loop. For this purpose, the time constant of the RC network in the phantastron circuit of the second saw-tooth generator is increased beyond the maximum provided by the manufacturer. Alternatively (Fig. XV-1), the delay of the stimuli can be maintained at a fixed value, or changed manually, by means of the reference dc voltage provided by the 10-turn potentiometer. This voltage is then used for the comparator instead of the saw-tooth signal available from saw-tooth generator no. 2.
The positive and negative pulses from the comparator are used to gate the brain potentials to a storage circuit. The output of the storage circuit is then fed either directly, for the computation of average responses, or indirectly through a squaring circuit, for computation of variance, to a Miller integrator.
The operation of the gating and storage circuit, which will now be considered in detail,
CATHODE CATHODE FOLLOWER I FOLLOWERS V9 12AU7 OUTPUT GATE PULSES FROM COMPARATOR
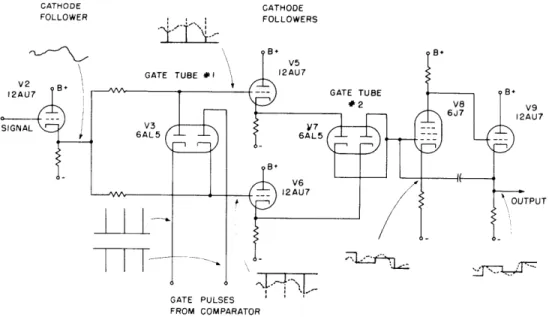
Fig. XV-2. Gating and storage circuit.
(XV. COMMUNICATIONS BIOPHYSICS)
is indicated in the simplified schematic diagram in Fig. XV-Z, and is best understood if the effect of removing the first gate tube (V3) from its socket is considered. In this instance, the waveforms of the circuit are those that are shown as dotted lines. The brain potentials, which are available at low impedance from the cathode follower V2, are fed through the two series resistors to the grids of the two cathode followers V5 and V6.
From these two secondary low-impedance sources, the signal is then fed through the second gate tube (V7) to the storage circuit, which consists of V8, V9 and the storage capacitor connecting the cathode of V9 to the grid of V8. As can be seen from the dashed waveforms in Fig. XV-1, with the first gate tube removed from its socket, the signal from VZ is fed unaltered to the grid of the first tube of the storage circuit and is present, inverted in polarity, at the output cathode follower V9 of the storage circuit.
If the first gate tube V3 is replaced in its socket, the operation of the circuit is indi-cated by the solid waveforms in Fig. XV-Z, and it is evident that the brain potentials are sampled and stored at the time each new (delayed) stimulus in the series appears. The combination of the two gate tubes operates in such a way as to disconnect the signal appearing at the cathode of VZ from the storage circuit at all other times. For the stor-age circuit, the use of the cathode followers V5 and V6 and the use of a modified Miller integrator for the storage circuit (V8 and V9) permits an extremely large ratio (106 or
greater) of the discharge to the charge time constant.
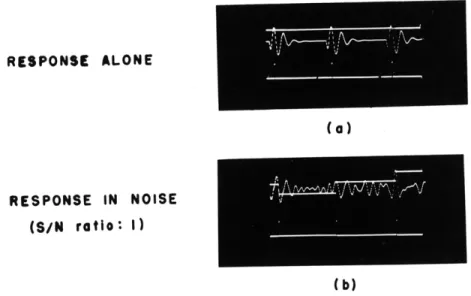
Photographs of waveforms for the gating and storage circuit, shown in Fig. XV-3, illustrate its operation for a simulated evoked response alone and in the presence of background noise. The delayed stimuli for a particular value of delay are shown in the lower traces of Fig. XV-3a and 3b. In Fig. XV-3b, the step-like waveform for the
RESPONSE ALONE
(a)
RESPONSE IN NOISE
(S/N ratio: I)
Fig. XV-3. Operation of gating and
(b)
storage circuit for a simulated response.
161
(XV. COMMUNICATIONS BIOPHYSICS)
storage circuit, which results as the instantaneous voltage of the signal is stored at the incidence of each new stimulus, is evident. In Fig. XV-3a, the input signal consists only of the simulated response, and therefore the output of the storage circuit for this fixed value of the delay of the stimuli remains constant (solid line).
For a given delay, it is the average dc component of the output of the storage circuit which the Miller integrator (2, 4) indicates in the write-out for each value of the delay in the averaged response, the storage condenser of the integrator being discharged at the end of each revolution of the tape (timer of Fig. XV-1). If the dc component of the output of the gating and storage circuit is removed by means of condenser coupling and the out-put signal from the circuit is squared before its average is found by the Miller integrator, a very close measure of the variance of the sampled signal can be obtained. Thus, when each of the delayed stimuli appears, the amplitude of the input signal of the gating and storage circuit (Fig. XV-3a) is always the same, and hence the output of this circuit contains no ac component. The variance of this signal for all values of the delay should then be zero. In Fig. XV-3b, the output signal for the gating and storage circuit does contain an ac component, owing to the random background, and hence the variance of this sampled waveform should be greater than zero. In order to obtain the square of the ac component of the output of the gating and storage circuit, a conventional quarter-square circuit (4-6) that employs the parabolic transfer characteristic of two 6B8 pentodes in push-pull operation is used.
RESPONSE ALONE RESPONSE IN NOISE NOISE ALONE
(S/N ratio: 1) AVERAGE OF (a) (b) (c)
VARIANCE
EL
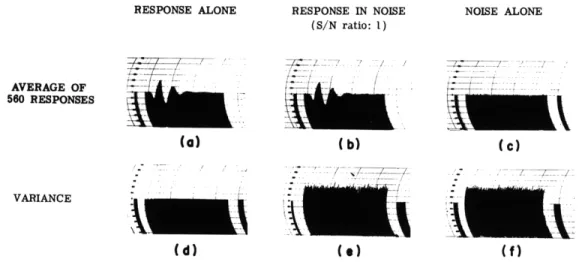
(d) (e) (f)Fig. XV-4. Averages and variances for a simulated evoked response in an unrelated background (units of amplitude are arbitrary). The operation of the computer is indicated for a simulated evoked response, alone, and also in a random background in Fig. XV-4. Average responses are shown in the upper part, and plots of variance on the same time scale are indicated in the lower part
162
- I t II Llii -r-c- I L
--cI
--(XV. COMMUNICATIONS BIOPHYSICS)
of the figure. In Fig. XV-4a and 4d the average response and the variance for the sim-ulated evoked response alone are shown. Since the simsim-ulated response is unvarying in its waveform for the entire series of 560 responses that are averaged, the variance is zero for all values of the delay (the calibration of the instrument for zero input from the tape recorder is shown on the extreme left of each plot). When the background noise is added (Fig. XV-4b and 4e), the same average response is obtained as before, except for a slightly irregular outline; but the plot of variance (here, of the background activity alone) remains at a uniform level for all values of the delay. The average response for the noise alone (Fig. XV-4c) is seen to be zero, but the variance (Fig. XV-4f) is the same as that for Fig. XV-4e and represents that of the background alone. Had the amplitude of the simulated evoked response itself been variable, independently of that of the background, then the variance of the two would have added linearly.
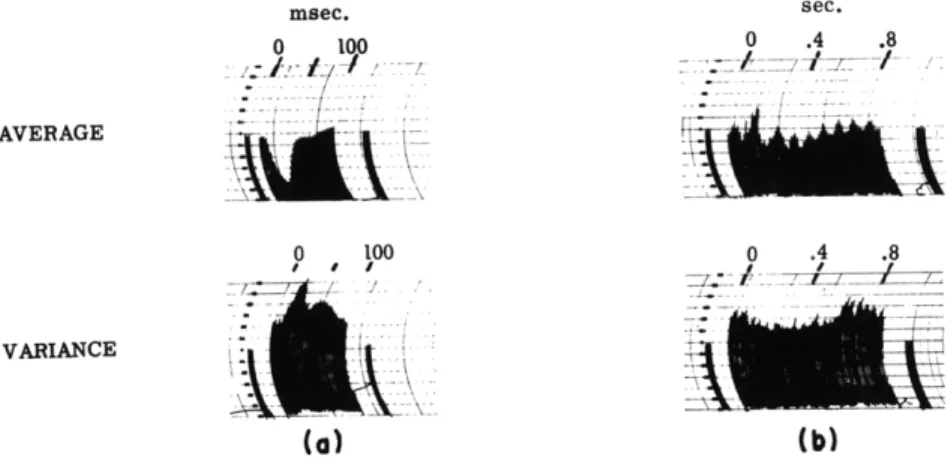
Averaged responses and variances for two different types of physiological signals are shown in Fig. XV-5. The results of the stimulation of a cat with 150-msec tone bursts,
msec. sec. O 100 0 .4 .8 AVERAGE 0 100 0 .4 .8 VARIANCE (a) (b)
Fig. XV-5. Averages and variances for two types of physiological evoked responses (units of amplitude are arbitrary). (a) Cat auditory cortex (encephale isole): stimulus, 1/sec; tone bursts, 2900 cps, 150 msec; 500 responses. (b) Human parieto-occipital cortex (waking recording, scalp electrodes): stimulus, aperiodic flashing; flash interval, 0.7-0.9 sec; 160 responses.
from an experiment performed by Dr. T. T. Sandel, are shown on the left of Fig. XV-5. (A section of the cat's spinal cord was made at the second vertebra, that is, an encephale isole preparation.) The magnetic tape recording from this experiment was chosen for analysis because a measure of the variance of the response (that is, the interquartile range) was already available (7) for comparison with the output of the present device. The plot indicates a latency of about 10 maec for the onset, 30 msec for the peak, and
50 msec for the end of the response to this stimulus. In the plot of variance against delay, the very first part of the curve (from 0 to 10 msec) may be taken to indicate the
163
L C I ~I .- =--=- ,
~---(XV. COMMUNICATIONS BIOPHYSICS)
variance of the background activity alone, since the response itself has not yet begun. The variance increases rapidly, however, as the delay increases beyond 10 msec, and reaches a peak at approximately 25 msec, the delay at which the response itself is max-imum in amplitude. At still greater delays, however, the variance does not return to the level that preceded the onset of the response, whereas the average response itself does return to the base line, for example, at about 50 msec. Although it is impossible to distinguish, after the evoked response has begun, the part of the variance that results from the response from the part that results from the background activity, the
fore-going results suggest that for delays of less than 50 msec, the two phenomena are largely independent, inasmuch as it appears that their variances are linearly additive. Beyond this 50 msec, however, there is a suggestion that the background activity has a greater variability than before the onset of the response, and that this increased variability
slowly returns to the base-line level and reaches it at approximately 100 msec delay. In Fig. XV-5b the average response and the variance for stimulation of a human sub-ject with very brief (40
psec)
flashes of light from a stroboscope are shown. The flashrate was randomized in such a way that its rate ranged from 0. 7 to 0. 9 per second, by means of a random electronic triggering device. Following the early components of the response, which occupy the range of delay from zero to 200 msec (or so) of the display, a
series of rhythmic waves is apparent in the averaged response, the frequency of which is approximately 11.4 per second. This frequency was rather close to the resting alpha fre-quency for this subject, which was 11.2 per second. These rhythmic waves, which are
called the "sensory after-discharge," appear to be superimposed on a slight depression of the base line; this depression gradually subsides at a delay of approximately 0. 8 sec. The variance of this signal decreases with increasing delay and approximately par-allels the depression of the base line in the averaged response. An increase in variance appearing at approximately 0. 6 sec delay, is apparent when compared with the variance for the part of the curve immediately following zero delay.
These results suggest that, for this subject, the flash not only has evoked a sensory after-discharge, but also has caused suppression of the intrinsic (alpha) rhythm beginning at approximately 0. 1 sec, and lasting until approximately 0.6 sec. A slight, temporary rebound of the amplitude of the intrinsic rhythm then follows. Such a brief suppression of alpha activity in the EEG by flash stimuli is a familiar phenomenon to electroen-cephalographers.
J. S. Barlow References
1. Communications Biophysics Group of Research Laboratory of Electronics and W. M. Siebert, Processing neuroelectric data, Technical Report 351, Research Laboratory of Electronics, M.I.T., July 7, 1959.
(References continued on following page)
(XV. COMMUNICATIONS BIOPHYSICS)
2. J. S. Barlow and R. M. Brown, An analog correlator system for brain potentials, Technical Report 300, Research Laboratory of Electronics, M. I. T., July 14, 1955.
3. J. S. Barlow, An electronic method for detecting evoked responses of the brain and for reproducing their average waveforms, EEG Clin. Neurophysiol. 9, 340-343 (1957).
4. J. N. Holmes and J. M. C. Dukes, A speech-waveform correlator with magnetic-tape delay and electronic multiplication, Proc. Inst. Elec. Engrs. (London), Part III,
101, 225-237 (1954).
5. J. S. Barlow and M. A. B. Brazier, A note on a correlator for electroencephalo-graphic work, EEG Clin. Neurophysiol. 6, 321-325 (1954).
6. K. W. Goff, An analog electronic correlator for acoustic measurements, J. Acoust. Soc. Am. 27, 223-236 (1955).
7. T. T. Sandel, T. F. Weiss, C. E. Molnar, and G. L. Gerstein, Dispersion measures of evoked electrocortical activity, Quarterly Progress Report No. 52, Research Laboratory of Electronics, M.I.T., Jan. 15, 1959, pp. 155-157.
B. EFFECTS OF "OVERLAPPING" FOR CORTICAL RESPONSES
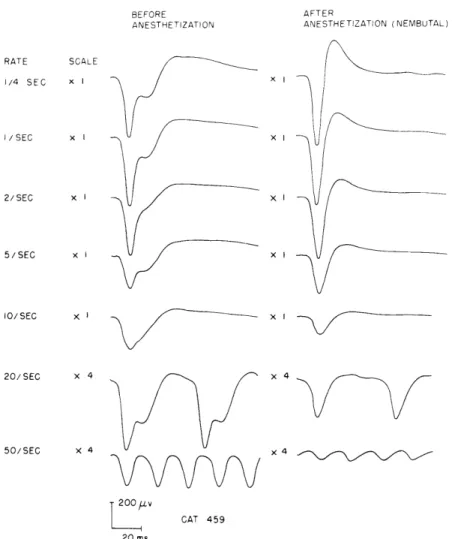
When cats are stimulated with brief acoustic stimuli, "evoked responses" can be observed in the electrical activity recorded from the auditory cortex. When the stimuli are presented at a low repetition rate, such as 1/sec, responses are easily detected, provided that there is not too much on-going activity. At higher rates, the stimulus-locked activity diminishes, but under certain conditions it can still be detected by an averaging technique. Changes in evoked responses that accompany changes in the rate of stimulus presentation have been reported elsewhere (1); the use of averaging in the detection of neural responses has also been reported (2). When responses to repeated clicks were recorded before and after administration of barbiturate anesthesia, averaged responses such as those shown in Fig. XV-6 were obtained. In every instance, the individual responses that were averaged had been recorded long enough after the onset of stimulation to ensure that a "steady state" had been established. These averages were obtained on the ARC-1 computer (2).
It is possible that the diminution of stimulus-locked activity with increasing rate may be the result of the partial overlapping of successive evoked responses. In this
report we discuss a simple model for the description of overlapping of the response waveforms. This model makes quantitative predictions of the extent to which the
responses at high repetition rates are influenced by such overlapping. Responses from the auditory nerve have also been considered in these terms (3).
Two assumptions are made concerning the activity of the neural elements that are monitored by a gross electrode:
(a) Responses to successive identical stimuli are, on the average, identical; that is, the responses are in a "steady state." For a stimulus occurring at time tk , the average
(XV. COMMUNICATIONS BIOPHYSICS) BEFORE ANESTHETIZATION AFTER ANESTHETIZATION (NEMBUTAL) RATE SCALE 1/4 SEC x I I/ SEC x I 2/SEC x 5/SEC I IO/SEC X 20/SEC x 4 50/SEC x 4 200 /v 20 ms
Fig. XV-6. Averages of cortical responses to repeated clicks presented monaurally. Responses were recorded by a concentric electrode from the contra-lateral cortex of a cat immobilized by a spinal section at the level of C-2. Left column, unanesthetized; right column, after injection of Nembutal (16.5 mg/kg) into the femoral vein. Stimulus intensity, 35 db re VDL. (VDL represents the level at which responses to clicks at low rates are just visually detectable.) Number of individual responses aver-aged: one every 4 seconds, 64; 1/sec and 2/sec, 256; 5/sec, 10/sec, and
20/sec, 512; 50/sec, 4096.
response is w(f) . U(t-tk), in which w(f) is a weighting function that depends only on the repetition rate, f, of the stimuli.
(b) As the repetition rate is changed, the waveform of the average response to any stimulus in a train does not change. Thus only w is a function of rate, and U is inde-pendent of rate.
With these assumptions, the average steady-state response is
00 G(t) = w(f) Z U(t-kT), k=-oo for k=O, 0 1, l2,... 166 XI x 4 CAT 459
VVV N\J\
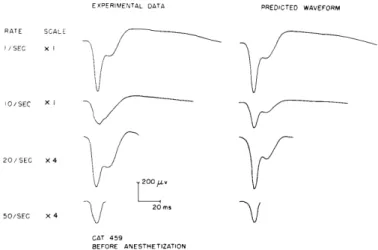
EXPERIMENTAL DATA PREDICTED WAVEFORM RATE SCALE I / SEC X I O/SEC X I 20/SEC X4 200 V 50/SEC x 42 CAT 459 BEFORE ANESTHETIZATION
Fig. XV-7. Experimental and predicted waveforms. Experimental conditions
identical with those for the left-hand column of Fig. XV-6.
EXPERIMENTAL DATA PREDICTED WAVEFORM
RATE SCALE I/SEC X I 20/SEC X 4 20s 50/SEC x 4 20 ms CAT 459
AFTER ANESTHETIZATION (NEMBUTAL)
Fig. XV-8. Experimental and predicted waveforms. Experimental conditions identical with those for the right-hand column of Fig. XV-6.
125 ms OVERLAP WAVEFORMS EXPERIMENTAL DATA CAT 459 BEFORE ANESTHETIZATION 1 2 5 10 20 50 100 CLICKS/SEC
Fig. XV-9. Reduction of response amplitude caused by overlapping. Upper right:
waveform of "standard" response (to stimuli presented at rate of I/sec) that was used in the computation of overlapping waveforms.
167
200 500 1000
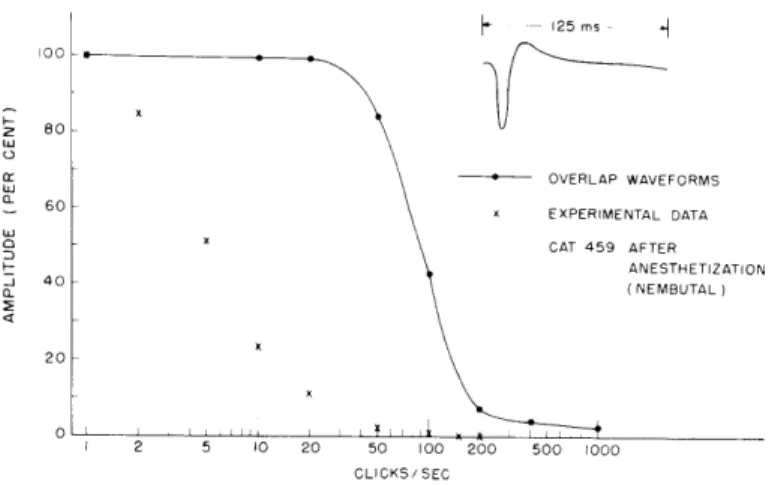
(XV. COMMUNICATIONS BIOPHYSICS) 125 ms 100 2 0 OVERLAP WAVEFORMS 60 x EXPERIMENTAL DATA x CAT 459 AFTER C -_ ANESTHETIZATION _J 40 (NEMBUTAL) 20 0 I 2 5 10 20 50 100 200 500 1000 CLICKS/SEC
Fig. XV-10. Reduction of response amplitude caused by overlapping. Upper right: waveform of "standard" response (to stimuli presented at rate of 1/sec) that was used in the computation of overlapping waveforms.
U(t) is defined here as the first 125 msec of the waveform of the average response to stimuli presented at the rate of I/sec.
Waveforms of the averages of responses obtained experimentally were compared with those computed by Eq. 1. The results obtained from the data for one animal under two conditions (before and after anesthetization with Nembutal) are shown in Figs. XV-7 and XV-8. In each instance the experimental and predicted waveforms are identical for the rate of i/sec, by definition. In Figs. XV-7 and XV-8 the peak-to-peak ampli-tudes of the predicted waveform were adjusted to equal those of the experimental data. The predicted waveforms are reasonably similar to the observed ones, especially for the potentials recorded from an anesthetized animal (Fig. XV-8).
In the method employed for calculating the predicted waveforms it is assumed that all components of the waveform U(t) behave in the same way with increasing rate; that is, that all components have the same w(f). This assumption is not strictly valid and may be far from the neurophysiological situation. The "notch" in the evoked response on Fig. XV-7 may represent activity that is quite different from that of other com-ponents of the waveform.
The manner in which overlapping (in terms of our model) causes diminution of response amplitude as a function of rate is illustrated in Figs. XV-9 and XV-10, for the conditions of Figs. XV-7 and XV-8. The solid curves show the effect of overlapping on the peak-to-peak amplitude of G(t), computed for the value w(f) = 1. These curves represent the way in which amplitude would change with rate if only overlapping were involved. The data presented in Figs. XV-9 and XV-10 indicate, however, that the major factor in the reduction of response amplitude for rates up to 200/sec is not over-lap. This reduction thus represents a decrease in activity of the neural elements that contribute to the evoked potential.
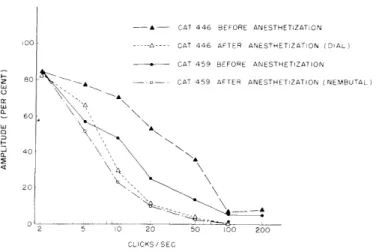
-A-- CAT 446 BEFORE ANESTHETIZATION --- CAT 446 AFTER ANESTHETIZATION (DIAL)
CAT 459 BEFORE ANESTHETIZATION
- - CAT 459 AFTER ANESTHETIZATION (NEMBUTAL)
2 5 10 20
CLICKS / SEC
50 00 200
Fig. XV-11. Relative peak-to-peak amplitudes of average response to repeated
clicks plotted as a function of repetition rate. (The experimental procedure for Cat 446 was similar to that for Cat 459, except that the anesthetic was injected intraperitoneally.)
CAT 446 BEFORE ANESTHETIZATION
CAT 446 AFTER ANESTHETIZATION (DIAL)
CAT 459 BEFORE ANESTHETIZATION
CAT 459 AFTER ANESTHETIZATION (NEMBUTAL
40
20
2 5 0 20 50 100 200 CLICKS/SEC
Fig. XV-12. Data of Fig. XV-11 replotted with correction for overlapping.
169 -A -r-- -n--- ~---
,-(XV. COMMUNICATIONS BIOPHYSICS)
Figure XV-11 presents data from two cats on the amplitude of steady-state responses to repetitive clicks. If these curves are corrected for overlapping, the curves of Fig. XV-12 obtain; these curves now represent the weighting function w(f).
This correction for overlapping thus does not affect the experimental results appre-ciably, except at rates of 100/sec and 200/sec. At the rate of 200/sec, the correction for overlapping appears to be significant. However, a very small error in reading the value of the response amplitude may result in a large error in w(f). Consequently, the precise shape of the w(f)-curve is difficult to determine at rates higher than 100/sec. The important point is that, although the stimulus-locked activity recorded by gross electrodes approaches zero at the repetition rate of 200 sec, we cannot say that the stimulus-locked activity of the individual elements that contribute to the response approaches zero.
Overlapping of responses thus makes it extremely difficult, if not impossible, to determine from gross-electrode recordings whether or not the activity of cortical elements of unanesthetized cats is stimulus-locked at rates of 200/sec and higher. At rates of 100/sec and lower, the effect of overlapping is not nearly so important. It would also seem that for barbiturate-anesthetized cats, stimulus-locked activity at rates of approximately 100/sec and higher is genuinely negligible.
M. H. Goldstein, Jr. References
1. M. H. Goldstein, Jr., N. Y-S. Kiang, and R. M. Brown, Responses of the auditory cortex to acoustic stimuli, J. Acoust. Soc. Am. 31, 356-364 (1959).
2. Communications Biophysics Group of Research Laboratory of Electronics and W. M. Siebert, Processing neuroelectric data, Technical Report 351, Research Laboratory of Electronics, M.I.T., July 7, 1959.
3. W. T. Peake, M. H. Goldstein, Jr., and N. Y-S. Kiang, Responses of the auditory nerve to repetitive acoustic stimulation (unpublished).