RESEARCH OUTPUTS / RÉSULTATS DE RECHERCHE
Author(s) - Auteur(s) :
Publication date - Date de publication :
Permanent link - Permalien :
Rights / License - Licence de droit d’auteur :
Bibliothèque Universitaire Moretus Plantin
Institutional Repository - Research Portal
Dépôt Institutionnel - Portail de la Recherche
researchportal.unamur.be
University of Namur
Origin of the double-peaked breakthrough curve in the Furfooz karst system: field data, scale model and numerical modelling
Dewaide, Lorraine; Rochez, Gaëtan; Poulain, Amael; Hallet, Vincent
Publication date:
2016
Link to publication
Citation for pulished version (HARVARD):
Dewaide, L, Rochez, G, Poulain, A & Hallet, V 2016, 'Origin of the double-peaked breakthrough curve in the Furfooz karst system: field data, scale model and numerical modelling', Eurokarst 2016, Neuchâtel, Suisse, 5/09/16 - 9/09/16.
General rights
Copyright and moral rights for the publications made accessible in the public portal are retained by the authors and/or other copyright owners and it is a condition of accessing publications that users recognise and abide by the legal requirements associated with these rights. • Users may download and print one copy of any publication from the public portal for the purpose of private study or research. • You may not further distribute the material or use it for any profit-making activity or commercial gain
• You may freely distribute the URL identifying the publication in the public portal ?
Take down policy
If you believe that this document breaches copyright please contact us providing details, and we will remove access to the work immediately and investigate your claim.
Origin of the double-peaked breakthrough curve in the Furfooz karst
system: field data, scale model and numerical modelling
The effect of conduit geometry on solute transport in karst was studied before by several authors. Those studies have enlighten that the geometry of the flooded karst system has a major influence on solute transport which is visible on the breakthrough curve (BTC) shape when a tracer-test is performed. This study focus on the physical effect of a specific feature often observed in karst: an underground lake. The karstic system of Furfooz (South of Belgium) was chosen because of the presence of such a lake on the tracer path. It is a classical swallow hole-resurgence system of 1,2 km in length developed in carbonifereous carbonates that drains 6 to 70 l/s of water. The underground river flows mainly along conduits of a few square meters in section but, around 200 meters downstream the swallow hole, the river flows into a lake. The geometry of this lake is not well known but the divers‘s reports allow to conceive the lake as it is shown in figure 1. This lake is actually separated in two parts because of a rocky spur in the middle of the lake. The upstream lake ends in a funnel shape that could not be penetrated by the divers, so the access to the downstream lake is from its surface downstream.
In order to understand and to characterize the hydrogeology of the active system, tracer-tests were performed in various flow conditions. Breakthrough curves (BTC) obtained via the different tests show similarities, particularly in the existence of a double restitution peak downstream the underground lake (Fig.2). Those two peaks show different features : the first one is rather quick and advective while the second one results from a slower transport implying an important dispersion and retardation. Interpretation of the BTCs, along with field observations and monitoring of various parameters, suggests that the dual peak is due to the presence of the lake on the tracer route. Indeed, the lake should be seen as a two pathways media: one pathway that behave more as a conduit responsible for the first peak, and a second pathway that could be an important volume of water where the transport velocity would be greatly reduced and in which the tracer would disperse slowly and be caught in immobile water zone giving dispersion and skewness to the second peak.
Figure 2. Double-peaked BTC at the resurgence
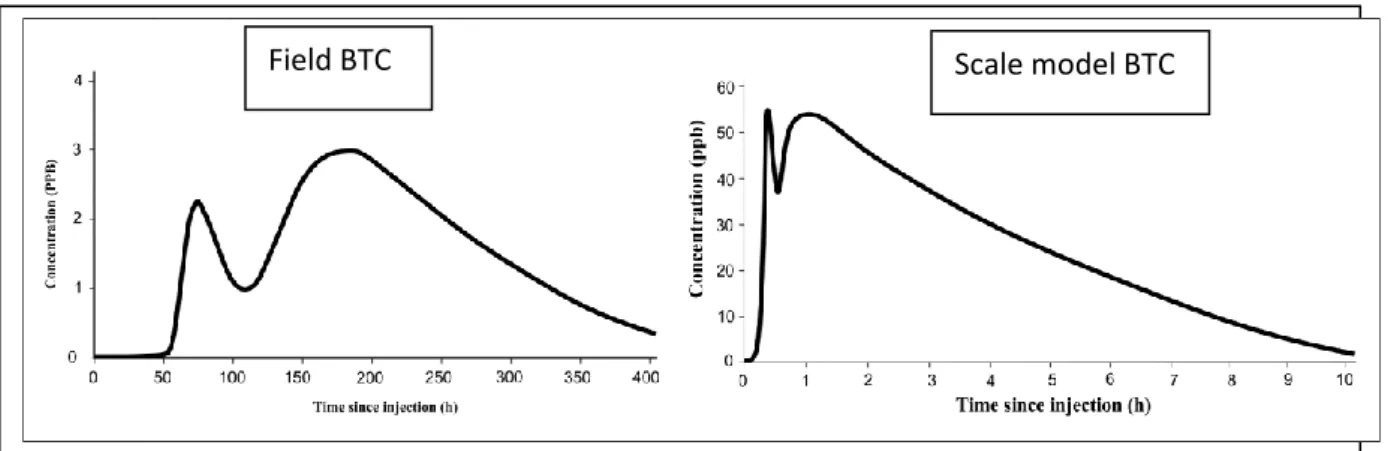
In trying to understand the processes that actually impact the tracer transport within the lake, a scale model was built and tracer-tests were performed on this laboratory analog. The scale model was conceived so that a reasonable dynamic and geometric similarity with the real system was respected. In this analog, conduits are represented thanks to PVC pipes of 10 cm in diameter and to simulate the lake, a water tank of 1m3 is chosen. The simulation of a double transport was made by including an internal porous pipe inside the water tank. Double-peaked BTCs, similar to the field ones (fig. 3), could be reproduced and other
observations on the tracer behavior could be made. As it can be seen on figure 3, the field and the scale model curves seem to express similar modes of solute transport: a first peak resulting from a quick and advective transport and a second peak largely dominated by dispersion and retardation. It can also be seen that the curves are not strictly matching but this is probably due mainly to a lack of similarity between the scale model and the reality. Improvement of the scale model geometric and dynamic similarity is in process. The scale model demonstrates that the appearance of dual peaked BTC is possible in an important volume of water with preferential pathways and it shows also that this double restitution is strongly linked to the exchange that exists between the two supposed transport zones. The lake is currently under study to understand how a fast and a slow transport zones could take place and where are those preferential ways.
Figure 3. Comparison between the field results and the scale model results
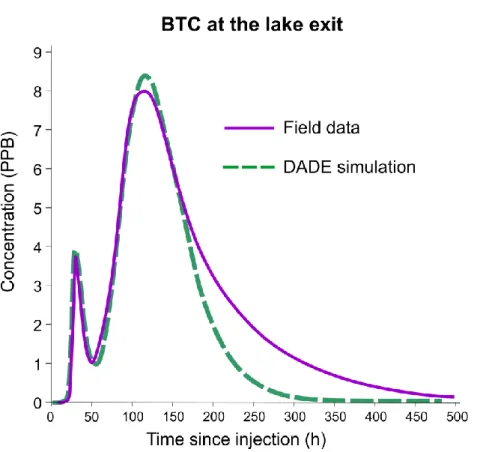
In order to dimension the transport parameters and to characterize the hydrodynamic within the lake, numerical modelling should be performed. Given the hypothesis of the two transport zones within the lake, the model should be able to simulate two conduits with different features and an exchange of tracer between the two conduits. The model that has been used so far is the DADE (Double advection-dispersion equation) developed by Field and Leij in 20121. The performed simulations are rather good (fig. 4). However, the main problem of
1 M.S. Field and F.J. Leij. 2012. Solute Transport in solution conduits exhibiting multi-peaked breakthrough
curves. Journal of Hydrology, 440-441 (2012), 26-35.
these simulation is the fitting of the BTC tail. This is probably due to the fact that the DADE does not include any retardation caused by immobile water. Therefore, one objective of this study is to develop a new model similar to the DADE but that will include an exchange with immobile water.
Figure 4. DADE simulation and field BTC at the lake exit
The dimensioning of the two conduits via the DADE confirms a small quick and advective conduit (cross section of 4 m2) at the origin of the first peak and a bigger and slower transport zone (cross section of 12 m2) that is responsible for the second peak. The dimension of this slower zone is probably under evaluated given the absence of immobile water zone in the model. A major parameter that influence greatly the curve shape is the exchange that exists between the two conduits.
The coupling of the scale model method and the numerical modelling is an original approach that comforts us in the hypothesis of a double transport within the lake and that helps to build a conceptual model of the reality. Furthermore, the performed work brought interesting
reflections about the hydrodynamic of solute transport in underground lake which has not been much studied so far.