HAL Id: halshs-00359098
https://halshs.archives-ouvertes.fr/halshs-00359098
Submitted on 31 Mar 2009
HAL is a multi-disciplinary open access archive for the deposit and dissemination of sci-entific research documents, whether they are pub-lished or not. The documents may come from teaching and research institutions in France or abroad, or from public or private research centers.
L’archive ouverte pluridisciplinaire HAL, est destinée au dépôt et à la diffusion de documents scientifiques de niveau recherche, publiés ou non, émanant des établissements d’enseignement et de recherche français ou étrangers, des laboratoires publics ou privés.
The Free Trade Agreement Between the United States
and Morocco. The Importance of a Gradual and
Assymetric Agreement
Mustapha Sadni Jallab, Lahsen Abdelkmalki, René Sandretto
To cite this version:
Mustapha Sadni Jallab, Lahsen Abdelkmalki, René Sandretto. The Free Trade Agreement Between the United States and Morocco. The Importance of a Gradual and Assymetric Agreement. Journal of Economic Integration, Center for Economic Integration, Sejong Institution, Sejong University, 2007, 22 (4), pp. 852 - 887. �halshs-00359098�
THE FREE TRADE AGREEMENT BETWEEN THE UNITED
STATES AND MOROCCO
THE IMPORTANCE OF A GRADUAL AND ASSYMETRIC AGREEMENT1
Mustapha Sadni Jallab (*)
(*) United Nations Economic Commission for Africa African Trade Policy Center
Lahsen Abdelmalki (**) René Sandretto (**)
(**) University Lyon 2 and GATE-CNRS Forthcoming Journal of Economic Integration Abstract:
The agreement recently signed between Morocco and the United States foresees several modalities in dismantling tariffs. Our simulations show that the various modalities of trade liberalization may have different impacts on the welfare, the rate of growth and the sectoral trade balance of these two countries.More precisely, our findings justify the interest of a gradual and asymmetrical agreement. In addition, the free trade agreement (FTA) between the US and Morocco will have a significant impact not only on trade between the two countries, but also on their trading relationships with other countries. The most important trade diversion will affect the EU and particularly France, which is Morocco’s largest trading partner. It will also adversely affect the other North African countries. The FTA will thus offer the opportunity to Morocco to diversify its markets and its capabilities, which are currently focused on the EU, particularly on France and Spain.
JEL CLASSIFICATION:
F13 - Commercial Policy; Protection; Promotion; Trade Negotiations F17 - Trade Forecasting and Simulation
C68 - Computable General Equilibrium Models
Key words: Trade Policy, Liberalization, Free trade Agreement, Simulation, CGE Model, Morocco, and United-States
1 This paper should be attributed to the authors. It is not meant to represent the position or opinions of the United Nations or its Members, nor the official position of any UN staff member. Corresponding author: Mustapha Sadni Jallab, Trade, Finance and Economic Development Division, United Nations Economic Commission for Africa, P.O. Box 3005, Addis Ababa, Ethiopia, Phone: 251-115-44-52-12; Fax: 251-115-51-30-38, e-mail: [email protected]. We thank the participants of the Ninth GTAP Annual Conference and two anonymous referees of the Journal for their insightful comments.
1. Introduction
Free trade agreements (FTA) between Morocco and the United States (US) will expose the Moroccan economy to increased competition on both price and quality in a range of products. This competitive pressure should provoke an increase in productivity on the part of Moroccan firms. Under such circumstances, it is quite possible that allowing US exports tariff-free access to the Moroccan market could result in substantial trade diversion. Although Moroccan consumers could enjoy lower prices, these gains could be more than offset for the economy as a whole because of possible producer losses in several activities, of loss in tariff revenue and the purchase of goods from the US rather than more efficient sources. In addition, there is the possibility that Morocco could experience declines in its terms of trade since its tariff reductions would be much larger than those of the US.
The most important contribution related to this FTA has been achieved by Ahmed Galal and Robert Z. Lawrence (2003). This interesting study explains clearly why Morocco was at that time, a potential partner of the US and a keystone in the project to establish a “US-Middle East free trade area within a decade” (as announced by Georges W. Bush on May 2003). Galal and Lawrence paper gives some short indication about “substantial trade diversion” (without numerical assessment). The authors refer also to some evaluations made by John Gilbert (2003) about Moroccan tariff revenues losses, estimated to $ 117 millions currently collected on US products (to compare with our result: $ 147.21 millions). Gilbert’s analysis, as ours, is based on the GTAP model. However, this research is not focused on the US-Morocco case but covers all the US free trade agreements. It provides estimations on imports, exports, Tariff Revenue and an assessment of the impact on Moroccan Welfare of all the US Free Trade Agreements considered simultaneously. Unfortunately, these simulations do not provide a specific assessment of the impact of the US-Morocco free trade agreement considered individually.
The purpose of our paper is precisely to assess the specific impact of the agreement signed by the two countries on June 15, 2004 and which came into effect the 1st of January 2006.
The following are the specific questions to be addressed:
First, how does Morocco gain or lose based on the impacts on GDP, trade and other macroeconomic aggregates from the bilateral trade liberalization between Morocco and the US?
• • • • •
Second, what sectors lose and what sectors gain?
Third, what are the welfare implications for Morocco from the FTA?
Fourth, how does the formation of FTA affect trade expansion through the trade creation and trade diversion effects?
Fifth, what are the fiscal implications of the FTA?
Consequently, this study will also try to quantify the impact of the US-Morocco FTA on direct revenue. The quantification of the trade expansion will provide a basis for estimating the resulting revenue effects due to trade diversion from non-US to US producers and suppliers. The agreement between Morocco and the US foresees several modalities in dismantling tariffs. The problems with dismantling tariffs will be examined in the essential cereals, red meats and vegetables sectors where a period of transition is necessary for their survival. Indeed, the
American agricultural sector is one of the most efficient in the world, especially for cereals2. The agricultural sector was the main obstacle in the finalization of the FTA. Indeed, the Moroccan economy is largely based on the agriculture. Fifty percent of the working population are employed in the primary sector, while 70 % of farmers cultivate cereal mostly in small farms (73.6% of them are less than 5 hectares with an average equal to 1,64 ha). American products would be an extremely serious threat to Moroccan agriculture, as a lot of US products are produced at cheaper cost and will presumably be considered rightly or wrongly by Moroccan consumers as being of better quality than Moroccan ones, mainly because of a greater level of standardization as well as of technological aspects of production, including for GMOs products, even though these last one may not correspond to the taste of all Moroccan consumers.
During the negotiations, the Moroccan party had recommended reserving cereals as a special case before total liberalization. However, the position of the US delegation was that an FTA needed to include agricultural products. The final agreement stipulated a gradual and further liberalization on some very sensitive agricultural product lines (see below).
The benefit of the FTA lies in the structural changes the Moroccan agriculture would undergo to make it more competitive and to better exploit the comparative advantages of the country. The questions and the answers which are arising from this converge on the same conclusion, as we shall demonstrate namely the interest for both partners of an asymmetric agreement and a progressive dismantling, especially for Morocco
The article is structured as follows: Following the Introduction, Section 2 highlights Morocco’s trade relations with US compared to that with European Union (EU). Section 3 presents the methodology used to assess the necessity of an asymmetric FTA, while Section 4 describes the models used in the analysis. A description of the World Integrated Trade Solution (WITS) and the Global Trade Analysis Project (GTAP) 6 models is made in this section. Section 5 presents the main results obtained from the simulations. Lastly, section 6 concludes the paper.
2. Trade performance of Morocco’s economy
Morocco’s major imports and exports are in manufacturing (around 62 % of imports and 65 % of exports in value terms in 2001). Machinery and transport equipment, textiles and chemicals are the main imports. Imports of textiles are mainly in connection with sub-contracting, particularly with partners in the EU. The rapid increase in their share of total imports of goods was essentially due to a change in the way they are entered in the accounts (how they are reflected in trade statistics). Agricultural foodstuffs and products from the mining and quarrying industries form the primary imported goods. Variations in imports of fuel primarily reflect the fluctuations in their global price.
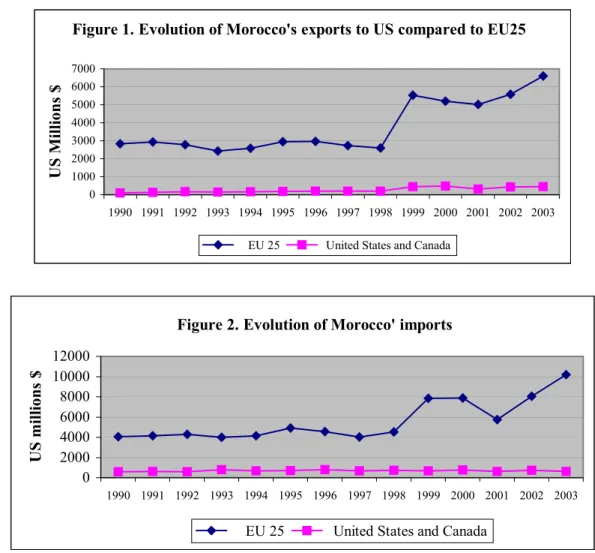
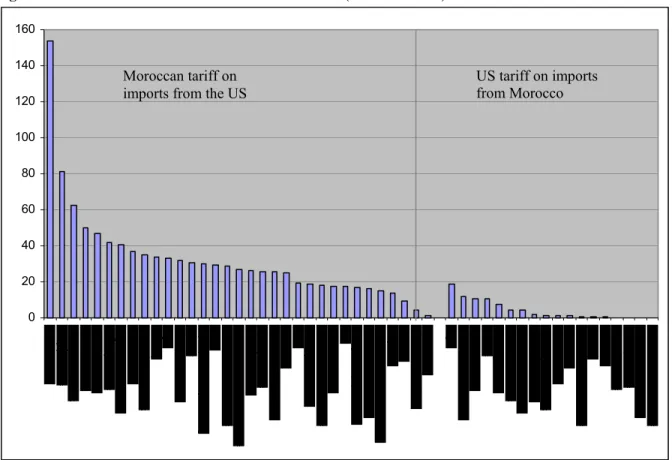
The EU is Morocco’s principal trading partner, both for imports and exports (see figures 1 and 2). France alone provides over 20 % (24 % in 2000 and 22.5 % in 2001) of total imports; other major importers to Moroccan include Spain, the United Kingdom, Italy and Germany. Outside the EU,
2 In 2005, the US was the leading exporter of cereals with a total volume of export equal to 82.2 millions tons (out of of world total equal to 279.6 largely ahead of the second exporter the European Union). The US achieved 25.2% of the world exports of wheat and 59.3% of world exports of corn.
Morocco also imports goods from the US and Saudi Arabia, while the volume of imports from other regions is negligible.
Morocco’s main exports to the EU are textiles and clothing, foods (fishery products, fruit, early produce – particularly tomatoes and citrus fruit), flowers and manufactured products. Main imports from the EU are fabrics, various types of machinery and equipment, chemicals, plastics, and wheat. Industrial products already enter the EU duty-free. The EU-Morocco fisheries agreement signed in 1995 expired in 1999. The EU Council of Ministers gave a mandate to the Commission to negotiate a Fisheries Partnership Agreement between the European Community and the Kingdom of Morocco in early July 2005. Based on this mandate, a new Agreement has been agreed and ratified by both sides. It should enter into force in 2007, pending the final procedural steps in Morocco. This agreement provides for access of EU vessels in Moroccan waters and EU support to the modernization of the fisheries sector.
Table 1. Balance of payments of Morocco, 1995-01
(US$ millions)
1995 1996 1997 1998 1999 2000 2001
Balance in the current transactions account -1,296 -58 -169 -146 -171 -501 1,606.0 Trade balance -2,482 -2,193 -1,864 -2,319 -2,448 -3,235 -3,022.0 Exports f.o.b. 6,871 6,886 7,039 7,144 7,509 7,419 7,142.0 Imports, f.o.b. -9,353 -9,080 -8,903 -9,463 -9,957 -10,654 -10,164.0 Services balance 283 961 747 864 1,112 1,142 1910 Credit 2,173 2,743 2,471 2,827 3,115 3,034 4,029.0 Debit -1,890 -1,782 -1,724 -1,963 -2,003 -1,892 -2,119.0 Revenue balance -1,318 -1,309 -1,176 -1,033 -985 -864 -833.0 Current transfers (net) 2,220 2,483 2,123 2,343 2,150 2,456 3,550.0 Capital account balance -6 73 -5 -10 -9 -6 -9.0
Financial operations account balance -984 -897 -990 -644 -13 -774 -967.0 Direct investment in Morocco 92 76 4 12 3 221 144.0 Direct investment abroad -15 -30 -9 -20 -18 -59 -97.0 Portfolio investment 20 142 38 24 6 17 -8.0 Other investment -1,083 -1,085 -1,022 -660 -4 -954 -1,006.0 Errors and omissions 391 209 175 160 123 114 230.0
Overall balance -1,895 -673 -988 -640 -69 -1,167 860
Financing 1,895 673 988 640 69 1,167 -860
Reserve assets 984 -274 -553 -248 -1,636 416 -3,842.0 Use of IMF resources -101 -47 -3 0 0 0 0.0 Exceptional financing 1,013 995 1,544 887 1,705 751 2,982.0 Gross official reserves
Foreign exchange reserves in terms of months of imports
4.6 5 5.4 5.2 6.7 5.4 9.9
Source: UNCTAD (2005).
France receives over one quarter of Morocco’s exported goods, followed by Spain, the United Kingdom, Italy, and Germany. In terms of trade structure, the order of importance of the leading partners is the same, both for imports and exports. The high concentration of exports to the EU is mainly due to the change in the method of reflecting sub-contracting operations in the accounts. Trade between the EU and Morocco has flourished in the last decade. In 2005, 74% of Moroccan exports went to the EU, while 65% of Moroccan imports came from the EU. Total trade reached 21 billion EUR in 2004. The EU is Morocco’s biggest trading partner and the balance of trade is still in the EU's favour. (Figure 1)
0 1000 2000 3000 4000 5000 6000 7000 1990 1991 1992 1993 1994 1995 1996 1997 1998 1999 2000 2001 2002 2003 US Millions $
EU 25 United States and Canada
Figure 1. Evolution of Morocco's exports to US compared to EU25
0 2000 4000 6000 8000 10000 12000 1990 1991 1992 1993 1994 1995 1996 1997 1998 1999 2000 2001 2002 2003 US mill ions $
EU 25 United States and Canada
Figure 2. Evolution of Morocco' imports
Source : UNCTAD, 2005
In this paper, we intend to simulate the consequences of the trade liberalization process between the two countries with a partial equilibrium analysis that we present first. Then, our results are extended and qualified in the light of a computable general equilibrium (CGE) analysis model. Indeed, the merit of a partial equilibrium is in providing a first sketch of the expected impacts, by revealing at a very disaggregated level the products for which the consequences of the FTA will presumably be the most important. Thus, this analysis has the advantage to reveal the products and issues which may be considered as the most sensitive in terms of impact on consumer gains, on tariffs revenues and evolution of the exports. Logically, we can expect to find among these ‘sensitive’ products those for which a particular attention has been devoted during the negotiation of the agreement due to the high stakes they represent for either one of the two countries. This approach can also (eventually) display some products, which may experience important impacts in the future, despite that they did not receive a particular attention during the negotiation. However, these advantages of a partial equilibrium approach are paid at the costs of being unable to address producer impacts and intersectoral and interregional linkage effects. Obviously, these two limitations are particularly severe for our subject since it make impossible to have a clear appreciation of the welfare impact of the agreement and a precise estimation of its overall consequence for each of the two countries, such as the effect of the free trade agreement on the economic growth. In order to remedy these limits, we complete this first approach with a CGE analysis. For each of these two approaches, we present first the methodology and the main
assumptions that we have adopted (section 3 and 4), then our main results and findings (section 5).
3. The Partial Equilibrium Modelling Framework – the WITS/SMART Model
This section describes the partial equilibrium modelling methodology that was used in the study, based on the WITS/SMART model developed jointly by the World Bank and UNCTAD. In this section, we describe first the SMART methodology, and then we present the simulation scenario that we have adopted.
3.1. The WITS/SMART Model
For the purposes of this study, it is proposed that the WITS/SMART model will be the applied partial equilibrium framework. WITS brings together various databases ranging from bilateral trade, commodity trade flows and various levels and types of protection. WITS also integrates analytical tools that support simulation analysis. The SMART simulation model is one of the analytical tools in WITS used for simulation purposes. SMART contains in-built analytical modules that support trade policy analysis, covering the effects of multilateral tariff cuts, preferential trade liberalization and ad hoc tariff changes. The underlying theory behind this analytical tool is the standard partial equilibrium framework that considers dynamic effects to be constant. Like any partial equilibrium model, these strong assumptions only allow trade policy analysis to be undertaken one country at a time. In spite of this weakness, WITS/SMART can help estimate trade creation, diversion, welfare and revenue effects.
3.1.1. Trade creation
The underlying theory is summarized below for the estimation of the trade flows and revenue effects. The exposition of the WITS/SMART theory is summarized from Laird and Yeats (1986). Trade creation captures the trade expanding aspects of liberalisation that leads to the displacement of inefficient producers in a given preferential trading area (a free trade area for instance). It is assumed that there is full transmission of price changes when tariff or non-tariff distortions (ad valorem equivalents) are reduced or eliminated. Laird and Yeats (1986) derive clearly the equation that can be used to estimate the trade creation effects. The derivation begins with the following basic trade model composed of simplified import demand and export supply functions and an equilibrating identity:
A simplified import demand function for country j from country k of commodity i: ) , , ( j ij ik ijk f Y P P M = (1)
The export supply function of commodity i of country k can be simplified as: )
( ikj
ijk f P
X = (2)
The equilibrium in the trade between the two countries is the standard partial equilibrium equation:
ikj ijk X
In a free trade environment, the domestic price3 of commodity i in country j from country k would change with the change in an ad valorem tariff as follows:
) 1 ( ijk ikj ijk P t P = + (4)
To derive the trade creation formula, following Laird and Yeats (1986), the price equation (4) is totally differentiated to get:
ikj ijk ijk ikj ijk P dt t dP dP = +(1+ ) (5)
Equations (4) and (5) are then substituted into the elasticity of import demand equation4 to get: + + = ikj ijk ijk ijk m i ijk ijk P dP t dt M dM ) 1 ( η (6)
From the identity in equation (3),
ikj ikj ijk ijk X dX M dM
= can be used to derive the following expression for elasticity of export supply:
ijk ijk e i ikj ikj M dM P dP γ 1 =
which when used in equation 6, allows the computation of the trade creation effect. From equation (3) the trade creation effect is equivalent to exporting country k’s growth of exports of commodity i to country j: )) / 1 )( 1 (( e i m i ijk ijk m i ijk ijk t dt M TC γ η η − + = (7)
If e →∞, then equation (7) can be simplified as follows:
i γ ) 1 ( ) 1 ( ) 1 ( 0 0 1 ijk ijk ijk ijk m i ijk t t t M TC + + − + =η (8)
where TCijk is the sum of trade created in millions of dollars over i commodities affected by tariff
change and is the elasticity of import demand for commodity i in the importing country from the relevant trading partner. M
m i
η
ijk is the current level of import demand of the given commodity i.
and represent tariff rates for commodity i at the initial and end periods respectively. Trade creation then depends on the current level of imports, the import demand elasticity and the relative tariff change.
0 ijk t 1 ijk t 3.1.2. Trade diversion
3 The transport and insurance costs are not reflected in the equation explicitly.
4 The elasticity of import demand is
ijk ijk m i ijk ijk P P M M ∆ = ∆ η
Trade diversion as opposed to trade creation can expand or contract trade globally. Trade diversion is the phenomenon that occurs in a free trade area for example whereby efficient producers from outside the free trade area are displaced by less efficient producers in the preferential area. In the particular case of the US-Morocco FTA, trade diversion would take place, if as a result of this agreement, more efficient suppliers of the rest of the world into the US are replaced by less efficient Moroccan ones or conversely. Trade diversion can affect both suppliers of the US (for example in South America) or suppliers of Morocco (namely in Europe). The theory underlying the measurement of trade diversion in SMART is also explained in Laird and Yeats (1986). To see the derivation clearly, first the expression for elasticity of substitution is given. The elasticity of substitution can be expressed as the percentage change in relative shares of imports from two different sources due to a one per cent change in the relative prices of the same product from these two sources:
(
ijk ijK) (
ijk ijK)
k K ijK ijk K ijK k ijk M P P P P M M M M / / / / / / ∆ ∆ =
∑
∑
∑
∑
σ (9)where k denotes imports from US and K denotes imports from the rest of the World (ROW). Equation (9) can be expanded, and through substitutions and rearrangements be used to obtain the expression for trade diversion, which is expressed as:
∑
∑
∑
∑
∑
∑
∆ + + ∆ = K k ijk ijK M ijK ijk ijk ijK k ijk M k K ijk ijK ijK ijk ijK ijk k ijk ijk ijk P P P P M M M P P P P M M M M TD σ σ / ) / ( / ) / ( (10)Equation (10) can be simplified to the case of a FTA. The relative price movement terms in the equation as noted in Laird and Yeats (1986) capture the movement due to changes in tariffs or the ad valorem incidence of non-tariff distortions for the US and the ROW. Therefore, the trade diverted to the US in the FTA, TD can be captured by reducing equation (10) above as follows: FTA M US US US ROW US M US US ROW US FTA t t M M M t t M M TD σ σ − + + + + − + + = 1 1 1 1 1 1 0 1 0 1 (11)
Equation (11) shows the additional US imports. MUS and MROW are the current imports into
Morocco from the US and ROW respectively. and are respectively the end and initial periods import tariffs imposed on US imports in the destination to Morocco with t .
1 US t 0 US t 0 1 US US <t σM is
the elasticity of substitution between US and ROW imports into Morocco. Trade diversion then depends on the current level of imports from the US and ROW, the percentage change (reduction in this case) of tariffs facing US imports with those for ROW remaining unchanged and the
elasticity of substitution of the imports from the two sources. The higher the value of the elasticity of substitution, the greater will be the trade diversion effects.
3.1.3. Trade expansion
Adding the trade creation and diversion derives the total effect on trade. As indicated in Laird and Yeats (1986), the summation in equations (8) and (10) for an importing country can be done across products and/or across sources. It is also possible to sum the results across a group of importers for single or groups of products as well as for single sources of supply or groups of suppliers.
3.1.4. The revenue effect
The quantification of the revenue effect using WITS/SMART model is simple. In theory, the tariff revenue is given as the product of the tax rate (tariff rate in this case) and the tax base (the value of imports). Thus, before the change in the ad valorem incidence of the trade barriers, the revenue is given as:
∑∑
= i k ijk ijk ijkP M t R 0 0After the change in the tariff rate, the new revenue collection will be given by:
∑∑
= i k ijk ijk ijkP M t R 1 1The revenue loss as a result of the implementation of a FTA would then be the net effect between R1 and R0 which is the same as:
∑∑
∆ = i k ijk ijk ijkP M t RL (12) 3.1.5. Consumer’s gainsThe WITS/SMART model estimation of consumer’s gain is quite simple. This is unlike the equivalent variations measurement in general equilibrium models. The benefit for consumers in the importing country is the result of lower import prices5. This allows them to substitute more expensive domestic or imported products with the cheaper imports that are affected by the relevant tariff reduction. Increased imports leads to a gain that can be thought as the increase in consumer welfare and is measured as follows:
) ( 5 . 0 ijk ijk ijk t M w = ∆ ∆ (13)
5 As emphasized in Laird and Yeats (1986), in the case of pre-existing level of imports, there is no net welfare gain in the country as the tariff reduction simply means a reallocation/transfer of revenue from the government to the consumers.
The coefficient of 0.5 captures the average between the ad valorem incidence of the trade barriers before and after their elimination/reduction. Equation (13) assumes that the elasticity of export supply is infinite. If this is not the case, the import prices in the importing countries fall by less than the full reduction in trade barriers. Therefore, while the equation can be used to measure welfare effect, it is no longer a representation of consumer surplus alone but has some element of producer surplus (see Laird and Yeats, 1986).
3.1.6. The database
WITS database comes from various sources. The external trade statistics comprise of UN COMTRADE, UNCTAD TRAINS and the WTO Integrated Data Base (IDB). The tariffs data is derived from UNCTAD TRAINS, WTO IDB and WTO Consolidated Tariff Schedule Data Base (CTS). The non-tariff measures are compiled from UNCTAD TRAINS database.
3.2. Simulation scenario
In the partial equilibrium approach, we consider only one scenario. This scenario looks only at the reciprocity principal. Due to the weaknesses already pointed out, especially the ceteris paribus assumption upon which this model operates, only one-way liberalization is possible. The results discussed here are the possible outcomes of reducing to zero the import duties that Morocco imposes on US goods. One special advantage of the WITS/SMART model is that it allowed the analysis to be undertaken at the 6-digit level. Trade created from the full reciprocity scenario depends on the following three key elements as discussed in the analytical methodology: the initial level of trade (imports from the US); the initial level of protection; and the price elasticity of import demand. The higher the initial level of protection, the greater the change expected from the reciprocation policy will be. The transmission mechanism for the trade effects is simple: the elimination of existing tariffs on US imports reduces the prices that consumers in Morocco face compared to domestic substitutes, while the responsiveness of demand to the price change influences the amount of trade created or diverted. The substitutability of US goods for domestic goods is implicitly assumed. The Armington assumption at HS 6-digit level is that goods imported from different countries are imperfect substitutes. It is also assumed that the supply response to the price reduction will allow US producers and exporters to meet any demand arising in the importing countries as a result of price reduction. That is, export supplies are perfectly elastic, meaning that world supplies of each variety of the goods by origin are given. 4. General Equilibrium Analytical Methodology
By definition, in a partial equilibrium model, the inter-sectoral implications of trade policy change are not taken into account. Similarly, the inter-regional implications are also ignored in a partial equilibrium framework. For this reason, trade policy analysis is more robust when undertaken within a general equilibrium-modelling framework. This can be seen as the best option as general equilibrium models not only measure the first-round effects of simulated change (as is the case in the partial equilibrium approach), but also the second-round effects which include inter-industry effects and macroeconomic adjustments.
This section discusses in detail the methodology applied for the empirical analysis. The discussion starts by outlining the GTAP modelling and data framework.
4.1. Rationale for a General Equilibrium Methodology
Trade policy analysis involves examining implications of trade policy instruments on the production structure in economies at the national and global level. Trade policy instruments, such as tariffs and quotas, have direct and indirect effects on the relative prices of commodities produced in a given country. As the mix of goods and services produced changes, the demand for factors of production also changes. Consequently, it is difficult to conceive a situation in any economy where the change in trade policy affects only one sector. Due to the forward and backward linkages and their related strengths existing in a particular economy, the result is always one in which the relative mix of sectoral outputs change. This, by extension, affects the relative mix of the different factors of production in the different sectors.
The country-level effects on output mix and demands for factors of production can in the context of international trade be extended to the global economy. Changes in relative prices of outputs and inputs resulting in a given country’s change in trade policy are transmitted to the industries and input markets of other economies that the country trades with. Therefore, for trade policy analysis to be meaningful and for robust results to be produced, the interactions that prevail among different sectors as a result of a change in a given group of countries trade policy instruments must be taken into account. The general equilibrium methodology provides an analytical framework that allows for inter- and intra-sectoral changes in output mix, and by extension the demand for different factors of production to be captured.
Kehoe T. and Kehoe P. (1994) succinctly captured the essence of general equilibrium models. General equilibrium models are an abstraction that is complex enough to capture the essential features of the economy, yet simple enough to be tractable. These models are popular over their partial equilibrium counterparts because they stress the interactions among different sectors. However, they are not perfect, especially the static ones, since they fail to take into account the dynamic effects that accompany changes taking place in a given economy as a result of policy change. The GTAP model falls in this class of general equilibrium models. GTAP is a multi-region CGE model designed for comparative-static analysis of trade policy issues (Adams et al. 1997) 6.
There are four types of behavioral parameters in GTAP: elasticities of substitution (in both consumption and production), transformation elasticities that determine the degree of mobility of primary factors across sectors, the flexibilities of regional investment allocation, and consumer demand elasticities. The parameters that describe demand behavior in initial equilibrium for the representative private household are region-specific. Consumer behavior in GTAP is based on the constant differences of elasticities (CDE) expenditure function, which is most naturally calibrated to income and own-price elasticities of demand (Hertel et al., 1991). The CDE specification allows for more flexibility in specifying varying degrees of substitution between consumer goods purchases. This specification is also less restrictive in how one specifies correlations between household wealth and private goods consumption patterns.
For agricultural and food commodities, we draw upon the Food and Agricultural Organisation (FAO) model (FAO, 1993), which has proved to be a good source for recent estimates of income
6 The interested reader can find all the relevant information about this model, both its structure and possible applications in the remarkable book published by Thomas W. HERTEL (1997), Global Trade Analysis. Modelling and Applications. Cambridge University Press.
elasticities. For non-agricultural and nonfood commodities, we used income elasticities from the SALTER model and Theil, Chung and Seale (1989). A full description of the elasticities used in this exercise is detailed in Zeitsch et al (1991).
Demand: The demand side is modeled in each region through a representative agent, whose utility function is intra-temporal, with a fixed share of regional income allocated to savings and the rest being used to purchase final consumption. Consumption trade-off across sectors is represented through a Cobb Douglas utility function.
Supply: Production makes use of five factors: capital; skilled labour; unskilled labour; land; and natural resources. The first three are generic factors; the last two are specific factors. The production function assumes perfect complementarity between value added and intermediate consumption. The structure of value-added is intended to take into account the well-documented skill-capital relative complementarity. Constant returns to scale and perfect competition are assumed to hold in agricultural sectors.
Capital, markets clearing and macroeconomic closure: The capital good is the same whatever the use sector, and capital is assumed to be perfectly mobile across sectors within each region. At the regional-wide level, capital stock is assumed to be constant in the core simulations of this paper. Natural resources are also perfectly immobile and may not be accumulated. Both types of labour (skilled and unskilled), as well as land, are assumed to be perfectly mobile across sectors, while production factors are assumed to be fully employed. As for macroeconomic closure, the current balance is assumed to be exogenous (and equal to its initial value in real terms), while real exchange rates are endogenous.
This model can be used to capture effects on output mix, factor usage, trade effects and resultant welfare distribution between countries as a result of changing trade policies at the country, bilateral, regional and multilateral levels. Since the GTAP model puts emphasis on resource reallocation across economic sectors, it is a good instrument for identifying the winning and losing countries and sectors under policy changes involving the trade aspects of FTAs.
4.2. The GTAP Database and the Study Aggregation 4.2.1. Data description
The GTAP model is used together with the GTAP database which, like the model, captures individual and composites of countries. In this exposition, Version 6 of the database is used. The base year for this version is 2001 and recognizes 87 regions as well as 57 sectors and 5 factors of production. Thus, for each individual or composite region, there are 57 sectors whose data is captured in the overall GTAP database. As previously indicated, not all countries are individually captured in GTAP. However, each economy is indirectly included in the database as part of a given composite region or as part of the rest of the world. Thus, global macroeconomic consistency holds. For the purpose of our study, Morocco and the US are presented separately. Bilateral trade data is a critical component of the GTAP database. It is these bilateral trade flows that transmit policy and growth shocks between countries. Indeed, trade shares are important in explaining the simulation results. Bilateral trade is also important when looking at the terms of
trade implications. The global bilateral data is sourced from the United Nations COMTRADE data. This is supplemented with individual countries global trade information and trade totals or aggregate bilateral trade statistics such as those available from the IMF, FAO and World Bank. Another important sub-component of the GTAP database is data protection. Data is both explicit and implicit. It is explicit in the sense that tariff or export revenue and anti-dumping data by commodity and region are available. It is implicit in the sense that bilateral trade data is available both in market and world prices. The key sources of the protection data vary. Agricultural tariffs are obtained from the Economic Research Service, the EU and the applied or Most-Favoured Nation (MFN) rates. Merchandise tariffs, on the other hand, are available from the World Integrated Trade Solution project of the World Bank and UNCTAD (details of WITS are presented in the section discussing the SMART methodology). Domestic support protection data is obtained from the OECD’s producer subsidy equivalent tables and can be divided into output subsidies, input subsidies, land-based and capital-based payments.
4.2.2. Sectoral and geographical aggregations
For the present study, 87 regions have been aggregated into 5 subregions, and 57 sectors have been identified. A complete description of the sectoral and geographical aggregation is posted in Annex 1.
4.2.3. Scenarios tested in the CGE modelling
In order to assess the overall effect of the FTA on the Moroccan economy, we test three scenarios:
• Scenario 1: Strongly asymmetrical liberalization. All tariffs and quotas are removed by the US on imports from Morocco (duty free, quota free entrance for Moroccan exports), while Morocco reduces its tariffs on imports from the US by 10% (which roughly corresponds to a one-year liberalization impact for Morocco in the actual agreement); • Scenario 2: Intermediate asymmetrical liberalization. All tariffs are removed by the US
on imports from Morocco, while Morocco reduces tariffs on imports from the US by 50%; and
• Scenario 3: Full reciprocity, full liberalization. All bilateral tariffs are removed between Morocco and the US. All ad valorem tariffs, which appear in Figure 1, are reduced to zero.
All of the macroeconomic, trade and protection data refer to the common reference year 2001. Various international agreements have been implemented with important implications on the global economic landscape. It is therefore important that these changes be captured in our simulations. The main events to include are: the enlargement of the European Union; the implementation of the Agreement on Textiles and Clothing as part of the multifiber agreement (MFA) phase out; the implementation of the Uruguay Round Agreement on domestic support and export subsidies; the full accession of China into the WTO; and the conclusion of the Doha Development Round. The Doha Round outcome is currently not clear how it will likely impact
both economies. Therefore, it has not been built into our scenarios. As for the other four main issues, the following discussions explains how they were incorporated into the scenarios tested: Enlargement of the EU: An enlarged EU will ultimately be the trading bloc that Morocco will have to face by the time the FTA come into effect. First, all tariffs and export subsidies as well as non-tariff barriers between the EU-15 and the new ten members are abolished. Second, trade barriers among the 10 new EU members have also been eliminated. Finally, all sectors in the EU-10 are given the same level of protection against the rest of the world as found in the EU-15 at the time of the accession. This means that some of the tariff rates that the new EU members charge third countries have been increased or reduced to the existing levels of the old EU members.
Elimination of MFA quotas (implementation of the Agreement on Textiles and Clothing): It is expected that the phasing out of the multifibre agreement on textiles and clothing will have significant implications for developing countries and Morocco more particularly. It was therefore important to capture the likely effects of the removal of the MFA into our reference scenario. The elimination of the MFA was captured through elimination of the export tax equivalents of the textile and clothing quotas in the developed countries markets in particular.
Uruguay Round Agreement implementation: The US has traditionally used domestic support and export subsidies especially in agriculture. While the Doha Round negotiations are expected to have an agreement that will have dramatic impacts on how these two instruments are applied, there are still outstanding issues from the Uruguay Round. Our simulations capture the 20 percent reductions for developed countries domestic support. A rate of 13 percent was applied for the developing countries. In the case of the agricultural export subsidies, the scenarios implement the 36 percent and 24 percent reductions agreed at the Uruguay Round for developed and developing countries respectively.
China accession to the WTO: The full accession of China to the WTO is expected to have important implications for Morocco and US. At full accession, all WTO members will be expected to impose import tariffs on Chinese goods on an MFN basis. This was captured in our simulations by reducing tariffs on Chinese imports above the highest rate currently charged by importing country on each commodity.
These 3 scenarios are compatible with the main objectives of the Doha agenda related to market access and the reductions of all forms of export subsidies and trade-distorting domestic support. Actually, none of the three scenarios correspond to the actual agreement, although they give some indication of the relative importance of having an asymmetric agreement. Indeed, the U.S.-Morocco FTA eliminates tariffs on 95% of bilateral trade in consumer and industrial products (including textiles) with all remaining tariffs to be eliminated within 9 years. Particular treatment is reserved for agricultural products. Some important Moroccan exports, such as clementines, tomatoes and olives, will be allowed to enter the US duty-free market on the first day of implementation. Morocco will in turn provide immediate duty-free access to American products such as pistachios, pecans, nuts, almonds, processed poultry product (with some restriction), pizza cheese and other foodstuff. For all other agricultural products, tariffs will be phased out in 5 to 15 years. The agreement includes broad commitments in some key services, namely banking
and insurance (with a 4-year protection period), distribution, express delivery, engineering, audiovisual and telecommunications.
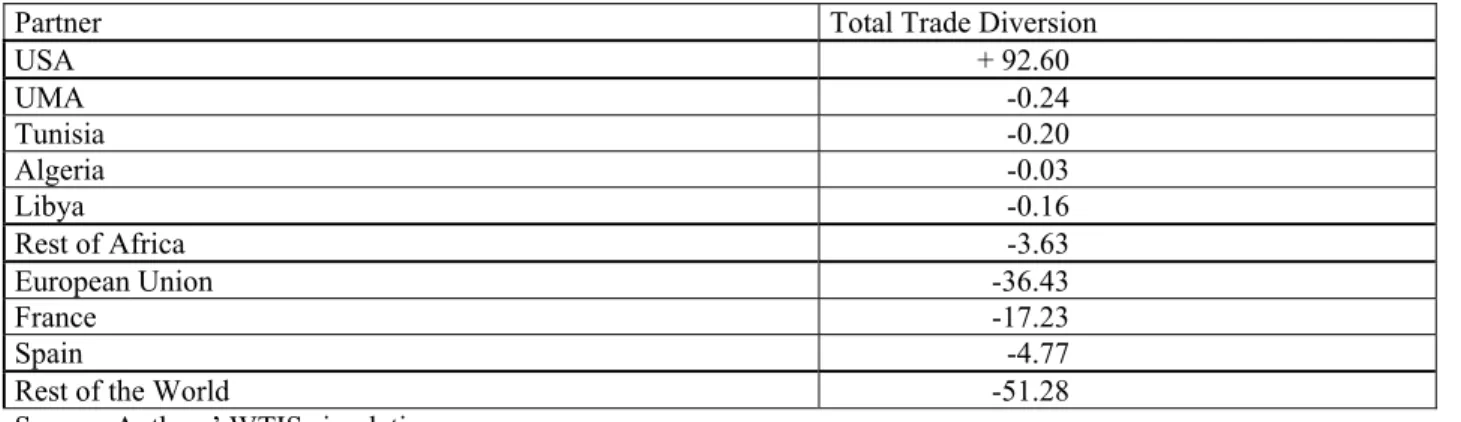
An important characteristic of the agreement is that it includes asymmetrical commitments to Morocco’s advantage, as suggested by Scenarios 1 and 2. This asymmetry is justified by the difference in the level of development of the trading partners and by the difference in the average level of the tariff schedules of the 2 countries, which amounts to more than 20% for Morocco against 4% for the US (Figure 3).
Figure 3. Ad valorem tariffs on different commodities (bilateral trade)
0 20 40 60 80 100 120 140 160
Source: TRAINS database
Moroccan tariff on imports from the US
US tariff on imports from Morocco
Obviously, with such a difference in the tariff schedules, the trading concessions made by Morocco would be much greater than the American ones in a full and perfectly symmetrical liberalization scenario. Of course, the complexity of the actual US-Morocco agreement cannot be captured by a simple scenario formula. However, inasmuch as the real agreement is a (complex) combination of these scenarios, we can expect to draw some interesting conclusions by comparing the scenarios.
5. Simulation results
This section discusses in detail the results obtained from the empirical analysis. The SMART partial equilibrium is complemented in the study with the GTAP model analysis.
5.1. Identifying specific products: Partial Equilibrium Results
In this section, the results using the WITS/SMART partial equilibrium model showing the possible impact of the FTA on Morocco are discussed, under the assumption of a full reciprocity, full liberalization scenario. Essentially, we want to analyze the possible consequences of a complete elimination of tariff barriers on the Moroccan economy and first of all the impacts on consumer’s surplus. One of the main justifications of liberalization is to reduce the price paid by consumers, increasing thus their purchasing power. So, our main objective in this fifth section is to analyze as accurately as possible consumers’ potential gain for the products that we can identify as the most sensitive. In this section, we analyze also the consequence of this scenario on product-specific tariff revenues and exports. We choose to simulate the impact of a complete dismantlement of tariffs in order to clearly expose the effects of trade liberalization on all Moroccan products. This is therefore an “extreme scenario” which aims at delineating the general trends of the impact of liberalization of the Maroccan economy under the FTA. The results on trade creation and diversion are also reported.
5.1.1. Impact on consumer’s surplus
It is important to underline that the WITS SMART model does not allow us to evaluate the total impact of the FTA on welfare, because it captures only consumer’s surplus. In order to obtain a complete view of this impact, it is necessary to address also the effects for producers. In addition, these impacts must not be evaluated product by product, but as a whole, taking into account general equilibrium linkages. This is what we intend to do in the next section. As underlined above, the partial equilibrium approach is just aimed at identifying sensitive products.
Table 2 displays the Harmonized system chapters (HS02) yielding the highest welfare gains for Morocco. Together, these 6 product groups account for more than 65% of total consumers’ gains in the country in the case of liberalization of trade with the US. By far, the group of products yielding the highest gains for consumers are cereals (32.4%), followed by electrical equipment and plastic industries (20%). Not surprisingly, our simulations show that taking into consideration only the effect on consumer welfare, Moroccan consumers should benefit greatly of trade liberalization. They will be able to purchase US consumer goods (part of the immediate liberalization) at cheaper prices, obtaining thus an immediate – but limited - improvement in their standard of living. Indeed, in a full liberalization scenario, the total improvement in Moroccan consumer welfare would equal US$24.9 million per year (Table 2).
Moroccan consumers will derive gains from the FTA since they will have access to goods at lower prices. To this point, it is assumed that US producers and exporters will not be pricing to market. In other words, there is an implicit assumption that US exporters and Moroccan importers will pass the benefits of tariff reductions on to Moroccan consumers. If the benefits of tariff dismantlement are not passed on to Moroccan consumers but are captured by the exporter or the importer, it is possible that there will be no increase in consumer welfare.
It is therefore crucial to ensure that welfare is transmitted to consumers. To this end, it is necessary that the competition policy shield consumers against possible abuse of potential dominant positions or against collusion from large importers. Competition policy capacities and the judicial system supporting it should therefore be strengthened to ensure that the FTA delivers its potential benefits.
Let us note that increased imports through trade creation do not necessarly benefit only to consumers. Potential gains are also likely to emanate from embodied technologies in some imports that may eventually be welfare enhancing. This will however depend on capital equipment and machinery and such imports that tend to have embodied technologies
Table 2. Impact of full liberalization on consumer welfare in Morocco by commodity
(in millions of US dollars)
Sectors Welfare Changes % Cumulative
Cereals 8.07 32.4% 32.0%
Electrical mchy equip parts thereof; sound recorder etc 3.20 12.8% 44.8%
Plastics and articles thereof 1.79 7.2% 52.0%
Paper & paperboard; art of paper pulp, paper/paperboard 1.61 6.5% 58.5%
Rubber and articles thereof 1.16 4.6% 63.1%
Mineral fuels, oils & product of their distillation; etc 1.13 4.5% 67.6% Vehicles o/t railw/tramw roll-stock, pts & accessories 0.85 3.4% 71.0% Tobacco and manufactured tobacco substitutes 0.79 3.2% 74.2% Aircraft, spacecraft, and parts thereof 0.75 3.0% 77.2% Nuclear reactors, boilers, mchy & mech appliance; parts 0.66 2.7% 79.9%
Iron and steel 0.46 1.8% 81.7%
Cotton 0.40 1.6% 83.3%
Man-made staple fibres 0.36 1.4% 84.8%
Miscellaneous chemical products 0.33 1.3% 86.1%
Articles of iron or steel 0.32 1.3% 87.4%
Pharmaceutical products 0.24 1.0% 88.3%
Others 2.8 11.7% 100.00%
Total 24.9 100.0%
Source: Authors’ WTIS simulation
5.1.2. Impact on Moroccan tariffs revenues
As would be expected, the elimination of import tariffs from the US is shown to harm government revenues in Morocco. In a full liberalization scenario, the FTA would significantly reduce Moroccan tariff revenues by more than US$147 million. Almost 60% of these losses would result from the elimination of duties on the import of US cereals (Table 3). This represents 0.5% of GDP and 4.5% of the balance of payments. Once again, one may mention that cereals account for almost 60% of the revenue shortfall. We can therefore understand why this product was treated separately during the negotiations.
In some cases, the bulk of the loss of revenues comes from the elimination of tariffs on goods that could otherwise be easily taxed. Nevertheless, in terms of evaluating the FTA for Morocco, it can be noted that the foregone revenue is likely to have negative impacts on other government programmes. When this is combined with undermining regional integration, one is left with a picture that goes beyond normal international trade theory arguments. The question about the significance of non-economic reasons for integration comes into play. It is therefore necessary to look closer at the real weight of such a revenue loss on government finance. If the FTA entails full liberalization of US imports, Morocco would have to forgoe tariff revenues amounting to almost 2.5% of their public revenue.
It is important to note however that the revenue loss indicated by our simulations relates to imports tariff revenues. In reality, the increased imports presented earlier resulting from trade creation are in most countries subject to indirect taxes such as the VAT. As such, as long as there
is rapid increase in the volume and value of imports into Morocco, and this country has indirect taxes such as VAT, then the revenue shortfall described will be minimized. However, unless the elasticity of the VAT and indirect taxes is significantly higher than that for import duties, it is unlikely that addition indirect tax revenues will outweigh the foregone revenue from the import tariffs.
Table 3. Impact of full liberalization on tariff revenue losses in Morocco
(Millions of US dollars)
Description Variation of tariff revenues %
Cereals -85.93 58.4%
Electrical mchy equip parts thereof; sound recorder etc -9.90 6.7% Mineral fuels, oils & product of their distillation; etc -7.19 4.9% Paper & paperboard; art of paper pulp, paper/paperboard -6.27 4.3%
Tobacco and manufactured tobacco substitutes -5.54 3.8%
Oil seed, oleagi fruits; miscell grain, seed, fruit etc -5.147 3.5% Nuclear reactors, boilers, mchy & mech appliance; parts -3.43 2.3%
Aircraft, spacecraft, and parts thereof -2.45 1.7%
Vehicles o/t railw/tramw roll-stock, pts & accessories -2.17 1.5%
Iron and steel -2.09 1.4%
Cotton -1.57 1.1%
Articles of iron or steel -1.54 1.0%
Man-made staple fibres -1.43 1.0%
Rubber and articles thereof -1.06 0.7%
Pharmaceutical products -0.97 0.7%
Others -10.50 7.0%
Total -147.21 100%
Source: Authors’ WITSsimulation 5.1.3. Impact on exports
By providing duty free access to an American consumer market with 300 million individuals, the FTA will strongly stimulate Moroccan exports. Not surprisingly, this expansion would primarily concern the textile and clothing industry, which is the most important industrial activity in Morocco (43% of the country’s industrial exports, providing 39.5% of total industrial employment). Table 4 shows that the agreement will likely have strong effects concentrated only on a limited number of sectors. Simultaneously, US exports to Morocco would increase at a still higher percentage: 36,28% against 22,58% (Table 5).
Table 4. Total impact of full liberalization on Morocco’s exports to the US in selected products (in thousands of US dollars and as a % of the sectoral Moroccan exports to the US)
Products Before After Change In Revenue % of increase
Art of apparel & clothing access, not knitted/crocheted 48.83 71.48 22649.412 4 .4% 6 Art of apparel & clothing access, knitted or crocheted 28.27 45.87 17603.708 62.3% Mineral fuels, oils & product of their distillation; etc 131.15 139.65 8497.814 6.5% Footwear, gaiters and the like; parts of such articles 4.54 6.47 1934.601 42.6% Prep of meat, fish or crustaceans, molluscs etc 10.48 12.08 1608.979 15.4% Edible vegetables and certain roots and tubers 6.00 6.57 566.686 9.4%
Total 237.77 291.45 53.68 22.58%
Table 5. Total impact of full liberalization on US exports to Morocco (Millions of US dollars)
Before After Change In Revenue % of increase
567.57 773.51 205.936 36.28%
Source: Authors’ WTIS simulation
5.1.4. Impact on third countries
This section looks at possible impact of trade diversions on Morocco resulting from the FTA. It starts with a presentation of the losses in regional trade, due to the substitution of intra-regional exports by US products. Then, it will attempt to identify which products could be most affected by losses of intra-regional trade and would suffer the most from US competition.
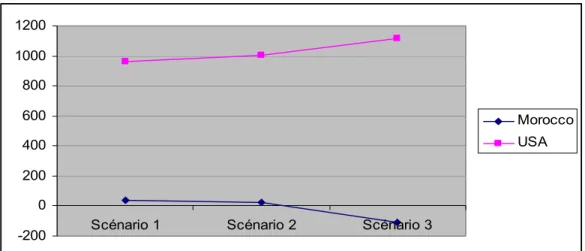
Trade diversion is the quantity of exports (of third countries) that is being replaced by US products after liberalization. We assume here that the effect of the elimination of the tariff is fully transmited to consumer prices. Indeed, the FTA between the US and Morocco will have significant impact not only on trade between these two countries, but also on the trading relationship with other countries. The most important trade diversion will affect the EU and particularly France, which is Morocco’s largest trading partner. It will also have adverse effects on the other North African countries (Table 6). The FTA will thus offer the opportunity to Morocco to diversify its markets and its capabilities which are currently strongly focused on the EU, particularly France and Spain.
The risk that countries affected by trade diversion, namely the EU, retaliate (“negative response) is likely insignificant. Actually, for France which is the most concerned country, the loss of export represent only 0.5% of the total French to Morocco exports. For Spain, the corresponding percentage is 0.6 and for the EU, it is 0.3 However, this does not mean that France and more generally the EU will accept in the future negotiations with Morocco trading conditions which would be less favourable than those granted to the US. Nowadays, as a result of the US-Morocco FTA, the US receive a better treatment than the EU for several products namely durum wheat. Consequently, everything leads one to believe that all the trading advantages which have been granted to the US will probably represent not the final objective but rather the starting point in the future agricultural negotiations between the EU and Morocco.
On another side, it is perfectly possible that the UE might respond “positively” to the US Morocco FTA by negotiating an extensive euromed partnership agreement. This might have significant consequences both for Morocco and the rest of North African countries (See below 5.2.4)
Table 6. Impact of full liberalization on Moroccan trade with third countries (in millions of US dollars)
Partner Total Trade Diversion
USA + 92.60 UMA -0.24 Tunisia -0.20 Algeria -0.03 Libya -0.16 Rest of Africa -3.63 European Union -36.43 France -17.23 Spain -4.77
Rest of the World -51.28
Source: Authors’ WTIS simulation
Our partial equilibrium simulations show that imports from the US to Morocco would increase by approximately US$53.68 million. Finally, our model shows results, albeit incomplete, concerning welfare gains. It seems that consumer surplus would mainly be improved through lowering the price of industrial goods such as cars, machinery and equipment. Furthermore, the FTA would significantly reduce Moroccan tariff revenues by more than US$147 million. However, the partial equilibrium results tell only one part of the story. In particular, it should be noted that the overall economic welfare effects are not clear within a partial equilibrium modelling framework since producer surplus changes, especially since the supplanting of domestic producers by EU producers has not been captured in this analysis. A CGE analysis can adress such producer impacts as well as linkage effects, thus qualifying some of our previous results.
5.2. Assessing welfare and linkage effects: General Equilibrium Results
Using the GTAP simulation model, we propose a quantitative assessment of the potential impacts of the three possible implementations of free trade described above on the economic growth of the two countries, on welfare, on sectoral value added, on exports, imports, trade balance and terms of trade.
5.2.1. Impacts on growth and welfare
As shown in Table 7 and Figures 4 and 5, the additional growth provided by trade liberalization is modest in the two countries, but not inconsiderable in Morocco (the rate of growth of Moroccan GDP would be increased by an additional 0.37% and a net welfare gain equal to US$37 million in the first scenario (strongly asymmetrical liberalization). The difference in the impact on the US and Moroccan GDP and welfare are clearly related to the difference in the size of the two countries and in the importance of their bilateral trade relations.
In any scenario, the impact of trade liberalization on the rate of growth would be much more important for Morocco than for the US, taking into account the difference in the bilateral trade flows sizes: US imports from Morocco represent 0.03% of total US imports, while Moroccan imports from the US correspond to 3.4% of total Moroccan imports. Welfare effects, on the other hand, are much greater in the US, when reported in millions of USD. Clearly, the impact on total welfare resulting from a one-dollar reduction in the price of an imported good is greater for a country with a population of 300 million than for a country with 30.6 million people. However, if
we evaluate the welfare impact as a percentage of the GDP which is undoubtedly more appropriate, the situation is reversed: the welfare impact in Morocco is three time as big as US one in scenario 1 (gain for both countries) and it is nine time as big in scenario 3 (loss for Morocco, gain for the US).
Lastly and more importantly, these results prove the importance of an asymmetrical and gradual liberalization process for Morocco. As the liberalization scenario become more liberal, the changes in GDP and welfare are lowered for Morocco. Finally, the Moroccan gains associated with Scenarios 1 and 2 result in recession and impoverishment in Scenario 3 (see table 2 and figures 4 and 5). This last result complete and qualify the conclusion we got from a partial equilibrium approach. Considering only the impact on consumers in a full liberalization scenario, the WITS-SMART model revealed a gain resulting mostly from a reduction of the prices of cereals. In a more general context integrating producer and linkage effects, it turns out that this benefit turns into a net welfare loss (equal to US$112 US million) resulting from important producer losses which outweigh consumer gain. This result clearly indicates that Moroccan producer surplus will suffer from a full liberalization scenario. These results could have significant implications on the structure of production in Morocco. Therefore, the results dictate clearly in favour of a progressive dismantelment in order to limit the adjustment costs.
Table 7. Impacts of the three different scenarios on welfare (in millions of US dollars) and GDP growth rate
(in %)
Scenarios Scenario 1 Scenario 2 Scenario 3
Regions Welfare GDP Welfare GDP Welfare GDP
Morocco 37.08 0.37 26.49 0.18 -112.1 -0.78
USA 962.02 0.03 1001.65 0.03 1115.94 0.04
RofNAFR -38.19 0.09 -39.55 0.09 -43.37 0.08
ROW -1277.54 0.06 -1303.83 0.05 -1375.13 0.05
Source: Authors’ GTAP simulation
Figure 4. Impacts on welfare (in millions of US dollars)
-200 0 200 400 600 800 1000 1200
Scénario 1 Scénario 2 Scénario 3
Morocco USA
Figure 5. Impacts on the rate of growth of the GDP (in %) -1 -0,8 -0,6 -0,4 -0,2 0 0,2 0,4 0,6
Scénario 1 Scénario 2 Scénario 3 Morocco
USA
Source: Authors’ GTAP simulation
We have also calculated the decomposition of the welfare from the various levels of trade liberalisation schemes. We have indicated the main two effects, allocative effects and terms of trade effect usually presented for this kind of analyse. We can see that the most important effect for Morocco is linked with the terms of trade effect. Indeed, with a strongly asymmetrical liberalisation scheme, the terms of trade effect is roughly ten times more important than the intermediary asymmetrical liberalisation scenario. And obviously, this effect becomes negative with a full reciprocity agreement.
Table 8. Welfare decomposition according to the level of ambition (in millions of US dollars) Scenarios Strongly asymmetrical liberalization Intermediate asymmetrical liberalization Full reciprocity Regions Allocative effect Terms of Trade effect Allocative
effect Terms of Trade effect
Allocative
effect Terms of Trade effect Rest North Africa -1.7 -36.8 -2.2 -37.7 -3.5 -40 Morocco 20.2 16 25.1 1.7 -53.6 -54.8 EU 25 465.6 -120.4 466.2 -129.7 468.5 -148.3 USA 488.4 664.2 482.7 702 464.5 812.1 Turkey -3.1 -4.3 -3.2 -5 -3.2 -7.1 Rest of the World -814.8 -5.85 -933.8 -531.1 -960.2 -561.9
Source: Calculated from the GTAP Model, version 6.2
5.2.2. Impacts on sectoral value added
If we consider the impact on the output, and more precisely on the variation of the value added in the two countries, we can conclude that the FTA creates both winners and losers in the two countries. In Morocco, meat, electronic equipment, leather, textiles and clothing benefit as the trade scenario becomes more liberal. Textile and clothing apparel appear to be (and will probably be) among the biggest winners. This activity can be expected to take advantage of increasing production in a short period of time as a result of immediate liberalization. On the other hand,
transport equipment, metals, mineral products and wheat lose out in the same process. Our simulation is therefore consistent with the fact that wheat is a highly political issue in Morocco. Eight million people in Morocco depend on wheat production, which is the main crop produced by small farmers. A full immediate liberalization in this sector would cause a large percentage of the Moroccan rural population to lose their livelihood. Not surprisingly, wheat is the only US product to remain subject to a quota in the actual agreement.
US farmers are expected to be the biggest beneficiaries of the agreement with Morocco, namely for wheat production, beef and animal feed, particularly for poultry which corresponds to the most important feed grain demand and the fastest growing meat production in Morocco. However, American oil seeds producers would experience severe losses in every scenario (Table 9).
Table 9. Impacts of the three scenarios of trade liberalization on selected industrial and agricultural activities (% of variation of value added)
Scenario 1 Scenario 2 Scenario 3
Sectors Morocco USA Morocco USA Morocco USA
Meat products nec -1.74 0.12 0.28 0.11 6.33 0.11
Meat: cattle,sheep,goats,horse -1.57 0.1 -0.28 0.09 4.13 0.07
Electronic equipment -1.34 0.08 -0.76 0.07 1.57 0.04
Transport equipment nec -1.21 0.06 -3.84 0.06 -8.07 0.06
Metals nec -1.07 0.07 -0.65 0.04 -2.02 0.07
Machinery and equipment nec -0,86 0,05 -0,74 0,05 1,08 0,04
Animal products -0.81 1.00 -0.44 0.97 -0.2 0.16
Ferrous metals -0.8 0.04 -0.65 0.06 0.14 0.04
Vegetables, fruit, nuts -0.17 -0.75 1.57 -1.26 0.26 -0.85
Mineral products nec -0.14 0.03 -0.66 0.04 -2.02 0.07
Leather products -0.14 0.18 -0.08 0.17 0.45 0.18
Wheat 0.33 2.28 -0.87 2.68 -4.42 3.88
Textiles 0.88 0.11 1.84 0.13 5.26 0.2
Vegetable oils and fats 1.11 -1.25 1.57 -1.26 2.73 -1.27
Wearing apparel 2.82 0.03 3.64 0.04 6.42 0.09
Oil seeds 3.06 -10.65 2.52 -10.67 1.87 -10.76
Source: Authors’ GTAP simulation
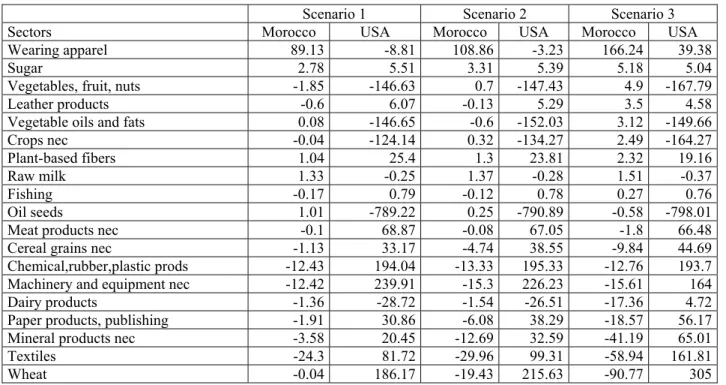
5.2.3. Impacts on sectoral exports, imports and trade balance
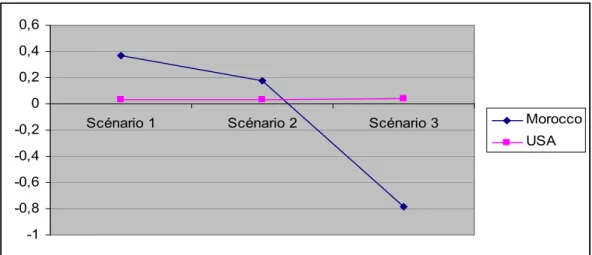
The general picture is roughly the same when we consider the potential effects on trade. In Morocco, under full liberalization, the trade balance would improve particularly for clothing, sugar, vegetables and leather products, while it would deteriorate notably for wheat. In the US, the FTA would cause the greatest improvement for chemical, rubber and plastic products and textiles, while trade deterioration would be felt most in oil seed and vegetables (Table 10). Part of these changes is related to the evolution of the terms of trade, which would deteriorate significantly for Morocco should the liberalization process be complete, immediate and perfectly reciprocal as described by the third scenario (Figure 6)
Table 10. Changes in trade balance for selected products (in millions of US dollars)
Scenario 1 Scenario 2 Scenario 3
Sectors Morocco USA Morocco USA Morocco USA
Wearing apparel 89.13 -8.81 108.86 -3.23 166.24 39.38
Sugar 2.78 5.51 3.31 5.39 5.18 5.04
Vegetables, fruit, nuts -1.85 -146.63 0.7 -147.43 4.9 -167.79
Leather products -0.6 6.07 -0.13 5.29 3.5 4.58
Vegetable oils and fats 0.08 -146.65 -0.6 -152.03 3.12 -149.66
Crops nec -0.04 -124.14 0.32 -134.27 2.49 -164.27
Plant-based fibers 1.04 25.4 1.3 23.81 2.32 19.16
Raw milk 1.33 -0.25 1.37 -0.28 1.51 -0.37
Fishing -0.17 0.79 -0.12 0.78 0.27 0.76
Oil seeds 1.01 -789.22 0.25 -790.89 -0.58 -798.01
Meat products nec -0.1 68.87 -0.08 67.05 -1.8 66.48
Cereal grains nec -1.13 33.17 -4.74 38.55 -9.84 44.69
Chemical,rubber,plastic prods -12.43 194.04 -13.33 195.33 -12.76 193.7 Machinery and equipment nec -12.42 239.91 -15.3 226.23 -15.61 164
Dairy products -1.36 -28.72 -1.54 -26.51 -17.36 4.72
Paper products, publishing -1.91 30.86 -6.08 38.29 -18.57 56.17 Mineral products nec -3.58 20.45 -12.69 32.59 -41.19 65.01
Textiles -24.3 81.72 -29.96 99.31 -58.94 161.81
Wheat -0.04 186.17 -19.43 215.63 -90.77 305
Source: Authors’ GTAP simulation
Figure 6. Terms of Trade (%)
-0,5 -0,4 -0,3 -0,2 -0,1 0 0,1 0,2
Scénario 1 Scénario 2 Scénario 3
Morocco USA
Source: Authors’ GTAP simulation
5.2.4. Impacts of a possible EU response
We have also simulated a ‘positive retaliation’ from the EU in response to this agreement. We have previously argued that a ‘negative response’ (retaliation) is poorly plausible. At the opposite, the possibility of a ‘positive response’ is perfectly plausible. In this prospect, we have considered the strongly asymmetrical liberalisation where the US are granting important concessions to Morocco and in parallel, EU is granting a full duty free quota free market access to Morocco and the Rest of North African Countries (Scenario 4). Il could be done through an extensive euromed partnership agreement.