Sensitivity of an ecosystem model to hydrology
and temperature
Annett Wolf&Eleanor Blyth&Richard Harding&
Daniela Jacob&Elke Keup-Thiel&Holger Goettel&
Terry Callaghan
Received: 6 July 2006 / Accepted: 3 October 2007 / Published online: 27 November 2007 # Springer Science + Business Media B.V. 2007
Abstract We tested the sensitivity of a dynamic ecosystem model (LPJ-GUESS) to the representation of soil moisture and soil temperature and to uncertainties in the prediction of precipitation and air temperature. We linked the ecosystem model with an advanced hydrological model (JULES) and used its soil moisture and soil temperature as input into the ecosystem model. We analysed these sensitivities along a latitudinal gradient in northern Russia. Differences in soil temperature and soil moisture had only little influence on the vegetation carbon fluxes, whereas the soil carbon fluxes were very sensitive to the JULES soil estimations. The sensitivity changed with latitude, showing stronger influence in the more northern grid cell. The sensitivity of modelled responses of both soil carbon fluxes and vegetation carbon fluxes to uncertainties in soil temperature were high, as both soil and vegetation carbon fluxes were strongly impacted. In contrast, uncertainties in the estimation of the amount of precipitation had little influence on the soil or vegetation carbon fluxes. The high sensitivity of soil respiration to soil temperature and moisture suggests that we should strive for a better understanding and representation of soil processes in ecosystem models to improve the reliability of predictions of future ecosystem changes.
A. Wolf
Department of Physical Geography and Ecosystem Analyses, Lund University, Lund, Sweden E. Blyth
:
R. HardingCentre for Ecology and Hydrology, Wallingford, UK D. Jacob
:
E. Keup-Thiel:
H. GoettelMax-Planck-Institut für Meteorologie (MPI-M), Hamburg, Germany A. Wolf
:
T. CallaghanAbisko Scientific Research Station, Abisko, Sweden T. Callaghan
Department of Animal and Plant Sciences, University of Sheffield, Sheffield S10 2TN, UK Present address:
A. Wolf (*)
Department of Environmental Science, Universitätsstr. 22, CH-8092 Zürich, Switzerland e-mail: [email protected]
1 Introduction
The Arctic and Sub-Arctic regions have experienced substantial regional warming in recent decades, with an average temperature increase of about 2 to 3°C since the 1950s (ACIA 2005). Climate projections for the next 100 years suggest a continuation of this warming trend, with the largest changes expected in the winter months (IPCC 2001). The Arctic Climate Impact Assessment (ACIA2005) predicted an increase in temperature of 1.2°C for the 2011–2030 period, 2.5°C for 2041–2060 and 3.7°C for 2071–2090 and a mean increase in precipitation by 4.3, 7.9 and 12.3% for the respective periods.
Warming as such might be favourable for most Arctic plant species, but the responses to warming are critically controlled by indirect effects such as the availability of moisture and nutrients and competition from invading plants. Warming experiments show a general increase in productivity for most arctic ecosystems (Rustad et al.2001; Dormann and Woodin 2002; van Wijk et al.2003; Walker et al.1998), whereas increasing summer precipitation produced few responses in the Arctic environment, except for mosses (Dormann and Woodin 2002; Sonesson et al. 2002). Still, soil moisture has an important influence on patterns of tundra plant communities and tundra ecosystem processes (Walker2000).
Although arctic ecosystems have a low primary productivity, they tend to accumulate organic matter because decomposition and mineralization processes are limited more by environmental factors than is the fixation of carbon in photosynthesis (Jonasson et al .2001). These factors include soil temperature (Lloyd and Taylor 1994; Rustad et al. 2001), soil moisture (McGuire et al. 2000b; Clein et al. 2000), changes in NPP (net primary production), i.e. substrate availability (Raich and Potter 1995), population dynamics of plants (Raich and Schlesinger1992) and vegetation substrate quality (Raich and Schlesinger 1992). As a result of this mismatch between rates of carbon capture in photosynthesis and decomposition rate, high latitude areas contain about 40% of the world’s soil carbon (McGuire et al.1995) and therefore any change in rates of carbon fluxes will have a direct impact on the global climate system (ACIA2005). In areas of permafrost, soils in the active layer can be waterlogged; in some areas, when the permafrost thaws, drainage is impeded and the soil remains wet. In other areas associated with good drainage, disappearance of permafrost will lead to aridification, which results in a loss of tundra ponds and soil drying (Callaghan et al.2005).
The dynamic ecosystem model LPJ-GUESS (Smith et al.2001) concentrates on processes at the plant level and has proven capable of predicting vegetation distribution, net primary production and net ecosystem exchange in many different ecosystems (Smith et al.2001; Hickler2004; Morales2006). It has been also successfully used for predictions of forest productivity and biomass in Sweden (Koca2006) and the Barents Region (Wolf et al.2008). LPJ-GUESS uses a very simple representation of soil processes and hydrology. To make LPJ-GUESS more applicable to the Arctic, we link it with the complex hydrological model JULES, which simulates the freezing and melting of soil water, and takes account of the dependence of soil thermal characteristics (Cox et al.1999). Both models were driven with the same regional climate model (REMO, Jacob2001). We compare the responses of soil and vegetation carbon fluxes, when JULES soil temperature, JULES soil moisture or both were implemented in the ecosystem model with the control run using the simple representation of LPJ-GUESS only. We ran the simulation in a sequential way in order to be able to isolate the impact of the two soil properties on the carbon fluxes. We focused on a transect in northern Russia, because the ecosystem model has been used in this region (Wolf et al.2008) and strong responses of vegetation were indicated for a future warming
climate there. We analysed the changes along a latitudinal gradient, to cover the response of different ecosystems ranging from boreal needle leaved forest to tundra.
We also tested whether the use of improved estimations of soil properties (temperature and moisture) influence the output of the ecosystem model LPJ-GUESS. Secondly, we investigated whether, and to what extent, uncertainties in precipitation and air temperature predictions influence the estimations of ecosystem carbon fluxes.
2 Materials and methods
2.1 Ecosystem model
We used the LPJ-GUESS ecosystem modelling framework (Smith et al. 2001), which combines the mechanistic representation of plant physiological and biogeochemical processes with detailed representation of vegetation dynamic processes (Sitch et al.2003; Smith et al. 2001). The growth of cohorts of PFTs (plant functional types) is simulated in a number of replicated patches. In the standard version, PFTs are either trees or herbaceous vegetation, but in this study we included shrubs (deciduous and needle leaved shrubs) as they are characteristic of the Arctic and Sub-Arctic (for a detailed description see Wolf et al.2008).
Photosynthesis, water uptake and plant respiration are modelled at daily time steps. At a yearly time step, the resulting annual NPP is allocated to reproduction and growth as determined by a set of prescribed allometric relationships. The yearly leaf and root turnover as well as plant mortality is transferred to the litter pool. Litter and soil carbon dynamics follow first-order kinetics and are sensitive to soil temperature and soil water (modified Arrhenius equation, Lloyd and Taylor1994). A full description of LPJ-GUESS is found in Smith et al. (2001). Further details of the physiological, biophysical and biogeochemical components of the model are given by Sitch et al. (2003).
The treatment of soil thermal and moisture regime in the dynamic vegetation model LPJ-GUESS is based on the simple“bucket” model. It was recently improved as described in Gerten et al. (2004). The“capacity” approach is employed assuming that all water above the field capacity is removed immediately from the soil. Two layers of 0.5 and 1 m depth are specified. Water movement between the layers is described by the empirically defined percolation rate. Soil temperature is calculated based on the Fourier analytical solution of the heat diffusion equation. Thermal conductivity is a function of water content, but no effect of ice below the active layer or snow on the top of the soil is taken into consideration. Evapotranspiration is calculated based on the Pristley–Taylor approach with an underlying assumption that atmospheric specific humidity does not vary.
The model has been shown in earlier studies to predict correctly the dominant PFT composition in different sites (Badeck et al.2001; Smith et al.2001; Hickler et al.2004; Morales et al.2005) and for Northern Europe (Koca2006; Wolf et al.2008). The closely related LPJ-DGVM has been subject to extensive validation of variation in ecosystem carbon balance (Lucht et al.2002; Sitch et al.2003).
2.2 Climate and CO2data
The model is driven by monthly averages of temperature, precipitation, percentage of sunshine hours, annual atmospheric CO2-concentration and soil-type derived from the FAO global soil data set (FAO1991).
We used a 1,000-year spin-up period to allow the vegetation, soil and litter pools to reach equilibrium with the long-term climate. For this spin-up period, we used the global CRU-data set (Mitchell and Jones2005,http://ipcc-ddc.cru.uea.ac.uk/obs/cru_climatologies. html). The time series from 1901 to 1930 was used repeatedly to provide the climate input for the spin-up. For the historical period 1901–1960 we also used data from the CRU-data set. For the period 1961–2000, we used the data from the regional climate model REMO (Jacob 2001). The driving fields from the regional climate model REMO for the vegetation, which was developed at the Max-Planck-Institute for Meteorology (Jacob2001), were taken from an already existing climate simulation using REMO5.3 at 0.5° (≈55 km) horizontal resolution (Keup-Thiel et al.2006). REMO was driven by the coupled atmosphere ocean general circulation model (AOGCM) ECHAM4/OPYC3 (Roeckner et al.1996; Oberhuber 1993) data at T42 resolution. The AOGCM data describe the possible climate of 1961 until 2099 for current and possible future (IPCC B2) greenhouse gas concentrations. The Barents Region was laid in the centre of the regional climate model. We used the grid cell coordinates from the REMO model. As driving data for the spin-up period and 1901–1960 period, we used the CRU-point with the closest distance (in longitude–latitude degrees) to the REMO-grid point.
Global atmospheric CO2concentrations for 1901–1960 were derived from a combination of ice-core measurements (1901–1950) and atmospheric observations (1950–1960; cf. Sitch et al.2003). For the spinup period, the value 296 ppm (concentration in 1901) was used. For the period 1961–2000, we used the same CO2concentration as the REMO model (IPCC B2). 2.3 JULES
The JULES model has inherited its basic properties from the Hadley Centre climate model land surface scheme MOSES. It incorporates a fully mechanistic representation of the heat transfer and water flow in soil developed for large-scale applications (Cox et al. 1999). The soil hydrology module is based on the numerical solution of the Richards’ equation. The soil temperature is calculated using the discretised heat diffusion equation. Both equations are solved for 4 soil layers with thicknesses from the surface of 0.1, 0.25, 0.65 and 2 m, respectively. Water phase changes are considered and soil thermal characteristics are functions of the water content (liquid and ice). The model includes a description of the insulating effect of snow on the soil surface. Evapotranspiration components from the canopy, vegetation and the bare soil are calculated as a function of the atmospheric specific humidity.
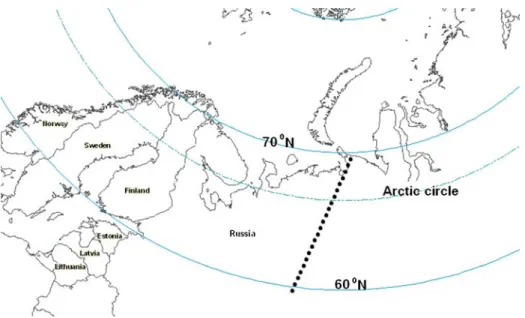
2.4 The transect in northern Russia
We studied a latitudinal transect in northern Russia which consists of 22 grid points and stretches from 59.7°N to 69.5°N (Fig. 1). It is situated in the Komi Republic and the Archangelsk Administrative District. This gradient covers the response of different ecosystems ranging from boreal needle leaved forest to tundra. The ecosystem model has been used in this region and shows that strong responses of vegetation, e.g. a northward shift of the forest biomes and an increase in shrub abundance, are expected for a future warmer climate (Wolf et al.2008).
2.5 Iterative coupling approach
JULES and LPJ-GUESS are driven by the same climate input from the REMO model. For the control run, only the REMO data were used. We then ran three simulations, including
the output of JULES as additional input into LPJ-GUESS. Firstly, we used the JULES output on soil temperature (upper 10 cm) and controlled the GUESS soil respiration with this temperature estimate, instead of the intrinsic estimate of soil temperature. Additionally, photosynthesis was first started when the soil temperature increased above freezing (0°C), as water supply was assumed to be unavailable below this temperature. Secondly, we used the JULES estimations (upper four soil layers: 0.1, 0.25, 0.65 and 1 m thick) of unfrozen plant-available water as direct input into the LPJ-GUESS. We used thickness-weighted averages to scale to the two soil layers of GUESS (0.5 and 1.5 m thick). Finally, we ran a simulation that included both soil temperature and available soil water. The coupling was done for the 1981–2000 period, and results were analysed for this period. We ran four different simulations: (1) with JULES soil moisture; (2) with JULES soil temperature; (3) with JULES soil moisture and temperature and (4) the control run i.e. using LPJ-GUESS without estimations from JULES. The differences in soil temperature and soil moisture estimations between the two models are shown in Table1.
2.6 Sensitivity of results to climate
There is some uncertainty in the climate model outputs of rainfall and air temperature. To test the land surface models’ sensitivity to these climate uncertainties, the precipitation and air temperature were changed by fixed amounts to assess the effect that had on the modelled carbon fluxes.
Changes in precipitation were achieved by changing the input data to be 20 and 50% less or 20 and 50% more precipitation than REMO data (Table 2). For temperature sensitivity, we increased or decreased the temperature predicted by REMO by 1 and 2°C, which resulted in an additional four runs (Table2). All the runs were compared to a control run with the unchanged REMO predictions on air temperature and precipitation. Overall, we ran nine simulations, one control and four sensitivity runs for air temperature and four sensitivity runs for precipitation.
2.7 Statistical analyses
The SPSS 13.0 statistical package was used for all analyses. Non-parametric tests were used in all cases, as the assumption of normal distribution might not be fulfilled. The tests for the effects of the different simulation runs were made as paired tests, as absolute values differed between grid points, e.g. along the latitudinal gradient. If the same data set was tested several times we corrected for multiple testing with the Dunn–Sidak method (Sokal and Rohlf1995). The presented p values are the corrected values in such cases.
3 Results
3.1 Soil water content
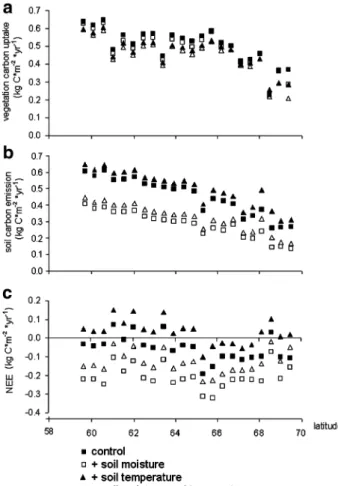
Including JULES predictions of the content of unfrozen soil water decreases the vegetation carbon fluxes (e.g. the carbon uptake by vegetation) compared to the control run (p<0.001, Wilcoxon Signed Ranks Tests, N=22, Fig.2a). However this decrease is small, on average only 4% compared to the control run, except for the most northern grid point where the decrease is 23% of the control run.
Including the soil water predictions of JULES leads to a strong decrease of the soil carbon fluxes from the soil to the atmosphere (Fig.2b). The average decrease in soil carbon emissions is 40% compared to the control run, a difference which is statistically significant (p<0.001, Wilcoxon Signed Ranks Tests, N=22). The importance of the feedback increases with increasing latitude from 32% at 59.7°N to almost 50% decrease in soil carbon fluxes at 69.5°N (r=−0.63, p<0.05, Spearman’s Rho, N=22).
3.2 Soil temperature
For the simulation run which included the JULES estimations of soil temperature (upper 10 cm), the vegetation carbon uptake is significantly lower than for the control run
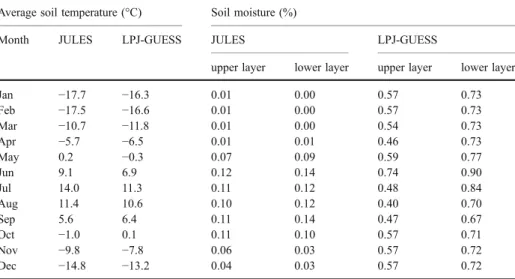
Table 1 Average soil temperature (upper layer, 0.5 m depth) and soil moisture (upper and lower layer, 1 m depth) as predicted by JULES and LPJ-GUESS
Average soil temperature (°C) Soil moisture (%)
Month JULES LPJ-GUESS JULES LPJ-GUESS
upper layer lower layer upper layer lower layer
Jan −17.7 −16.3 0.01 0.00 0.57 0.73 Feb −17.5 −16.6 0.01 0.00 0.57 0.73 Mar −10.7 −11.8 0.01 0.00 0.54 0.73 Apr −5.7 −6.5 0.01 0.01 0.46 0.73 May 0.2 −0.3 0.07 0.09 0.59 0.77 Jun 9.1 6.9 0.12 0.14 0.74 0.90 Jul 14.0 11.3 0.11 0.12 0.48 0.84 Aug 11.4 10.6 0.10 0.12 0.40 0.70 Sep 5.6 6.4 0.11 0.14 0.47 0.67 Oct −1.0 0.1 0.11 0.10 0.57 0.71 Nov −9.8 −7.8 0.06 0.03 0.57 0.72 Dec −14.8 −13.2 0.04 0.03 0.57 0.72
(p < 0.001, Wilcoxon Signed Ranks Tests, N = 22, Fig. 2a). The decrease in vegetation carbon uptake is around 8% of the control run, except for the two most northern sites, where carbon uptake by vegetation is ca. 20% lower than the control.
The soil carbon emissions are significantly influenced by including the soil temperature estimations from the JULES model (p<0.001, Wilcoxon Signed Ranks Tests, N=22, Fig. 2b). There is an increase in carbon fluxes from soil to atmosphere of about 12% compared to the control run and the influence increases at higher latitudes (r=0.93, p< 0.001, Spearman’s Rho, N=22).
3.3 Soil temperature and soil moisture
When both soil moisture and temperature estimates from the JULES model were used as input in the vegetation simulation, the carbon flux from atmosphere to vegetation is always smaller compared to the control run (p<0.001, Wilcoxon Signed Ranks Tests, N=22, Fig.2b). The changes are around 11% of the control run, except for the two most northern points, where the decrease in flux is around 20 and 40%.
The pattern is more complex for the carbon fluxes from soil to atmosphere, as the increase in flux due to the incorporation of JULES soil temperature estimates is overlaid with the decrease in soil carbon emissions due to the impact of soil moisture estimates from JULES (Figs. 2and 3). The reduction in soil respiration is around 30% compared to the control run and there is no trend with latitude (p>0.05).
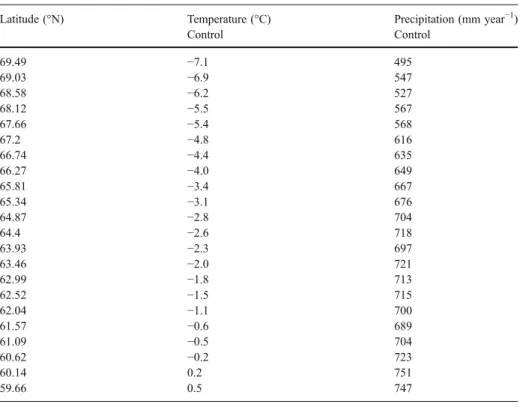
Table 2 Average air temperature and precipitation along the latitudinal transect and the values used for the study on uncertainty in air temperature and precipitation
Latitude (°N) Temperature (°C) Precipitation (mm year−1)
Control Control 69.49 −7.1 495 69.03 −6.9 547 68.58 −6.2 527 68.12 −5.5 567 67.66 −5.4 568 67.2 −4.8 616 66.74 −4.4 635 66.27 −4.0 649 65.81 −3.4 667 65.34 −3.1 676 64.87 −2.8 704 64.4 −2.6 718 63.93 −2.3 697 63.46 −2.0 721 62.99 −1.8 713 62.52 −1.5 715 62.04 −1.1 700 61.57 −0.6 689 61.09 −0.5 704 60.62 −0.2 723 60.14 0.2 751 59.66 0.5 747
3.4 Air temperature
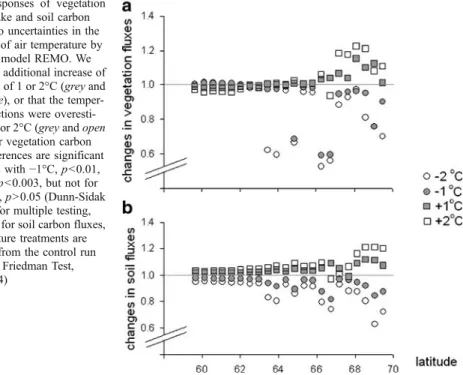
When we investigated the importance of uncertainties in temperature predictions, we increased or decreased the predicted temperature by 1 or 2°C. This results in a significant impact of on the vegetation carbon uptake (p=0.003, Friedman Test, N=22, df=4). The differences are significant for the runs with a temperature lower than the predicted mean (TREMO−1°C, p< 0.01, TREMO−2°C, p<0.003, Dunn–Sidak correction for multiple testing, N=4 tests), which results in a decrease in carbon uptake by vegetation. In contrast, if temperature was 1 or 2°C higher than the predicted mean, the increase in carbon uptake by vegetation is not significant (p>0.05). The effect of temperature is strongest in the more northern grid points (Fig.4a) where any further increase in predicted temperature leads to an increase in carbon uptake by vegetation and a decrease in temperature leads to a decrease in uptake.
When we tested the effect of the assumption of a 1 or 2°C over and underestimation of air temperature, we found a significant effect on soil carbon emission (p<0.0001, Friedman Test, N=22, df=4) where each temperature treatment is significantly different from the control run (Fig.4b, p<0.0003 for each pair-wise comparison, considering correction for multiple testing, Dunn–Sidak, N=4 tests). If the climate was increased by an additional 1 or 2°C, the soil carbon emissions increase (the effects were stronger in the 2°C temperature change compared to the 1°C). If the temperature was assumed to be 1 or 2°C lower than the
Fig. 2 Impact of coupling JULES soil moisture and temperature to LPJ-GUESS on carbon dioxide fluxes. The control run uses the LPJ-GUESS estimations of soil moisture and temperature (filled squares). In the other runs JULES estimations of soil temperature (filled triangles) or soil moisture (open squares) or both (open triangles) were used as additional input in the LPJ-GUESS model. Each comparisons of treatment versus control is significant (for all p<0.001 Wilcoxon Signed Ranks Tests, N=22). There are latitudinal trends in the response of soil carbon fluxes to changes in soil water content (r=−0.63, p<0.05, Spearman’s Rho, N=22) and soil temperature (r=0.93, p<0.001, Spearman’s Rho, N=22), but no trend when soil moisture and soil temperature treatments were combined
predicted temperature, the soil carbon emission are lower than the control (Fig.4b). The impact of uncertainties in the temperature is strongest in the higher latitudes (Fig.4b).
3.5 Precipitation
To test the consequences of the uncertainties in precipitation predictions, we increased and decreased the predicted precipitation by 50%. This has only minor effects on the fluxes of carbon from the atmosphere to vegetation; less than 1% change in fluxes compared to the control run. For the soil carbon emission, the effect of changes in the precipitation is small if the predicted precipitation is increased by 50%, which leads to an average 5% increase of soil carbon emissions. However, for a 50% decrease in precipitation, the average decrease of soil carbon emissions is around 11%. These results were significant (p<0.0002 for all tests, Dunn–Sidak correction for multiple testing, N=4 tests).
4 Discussion
4.1 Soil carbon emissions
Soil carbon fluxes showed a clear response to the changes in assumptions about soil temperature. The soil carbon emission increased by ca. 12% when we used the JULES soil temperature estimates as input into the ecosystem model. Soil respiration is highly sensitive
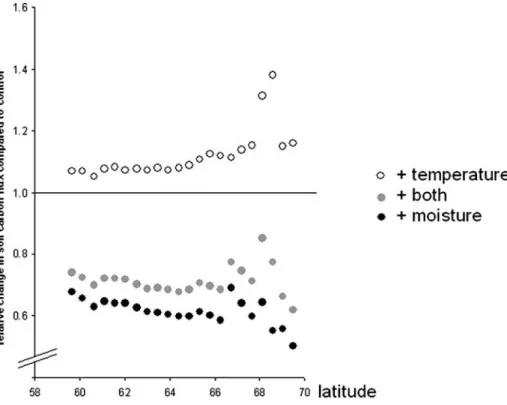
Fig. 3 Changes in soil carbon emissions compared to the control run. Values larger than 1 indicate an increase in fluxes compared to the control, whereas values smaller than 1 indicate a decrease in soil carbon emissions. JULES estimations of soil temperature (open circle) or soil moisture (black circle) or both (grey circle) were used as additional input in the LPJ-GUESS model
to soil temperature (e.g. Lloyd and Taylor1994; Rustad et al.2001). Therefore changes in the model formulation of soil temperature have a strong impact on the soil carbon emission. The importance of the model assumptions on soil temperature was also shown by McGuire et al. (2000a), who showed that keeping the soil temperature under snowpack at 0°C improved the model fit to observed data. However, the effect of soil moisture on soil carbon emission was even stronger, with a decrease in soil respiration by 40% when JULES soil moisture estimates were included in the LPJ-GUESS ecosystem model (Fig.2c). This is in agreement with other modelling studies that show a tight coupling of soil respiration to soil moisture (McGuire et al.2000b; Clein et al.2000).
In this study, which covers a transect from boreal to arctic vegetation, we found that the importance of the two factors of soil temperature and moisture varies with latitude: soil temperature has a stronger correlation with latitude, showing a stronger impact in the northern grid points. However, soil moisture changes have a strong influence, that is greater than that of soil temperature, over the whole latitudinal range (Fig.3). In this study, the importance of soil temperature and moisture was clearly shown. The impacts on soil carbon emissions could not be attributed to changes in NPP, which could be of high importance in some studies (Raich and Potter 1995), as vegetation carbon uptake was only little influenced. Neither were plant population dynamics important as suggested by Raich and Schlesinger (1992) as the time scale for such changes would be at least a few years, but substantial changes soil carbon emissions were observed already in the first year of coupling and remained important throughout the whole simulation period (1981–2000). 4.2 Carbon fluxes between atmosphere and vegetation
In our study, the carbon fluxes from the vegetation showed little response to either soil temperature or soil moisture formulations. This is surprising, because the TEM 5.0 (Terrestrial
Fig. 4 Responses of vegetation carbon uptake and soil carbon emissions to uncertainties in the predictions of air temperature by the climate model REMO. We assumed an additional increase of temperature of 1 or 2°C (grey and open square), or that the temper-ature predictions were overesti-mated by 1 or 2°C (grey and open circles). For vegetation carbon fluxes, differences are significant for the runs with−1°C, p<0.01, and−2°C, p<0.003, but not for +1 or +2°C, p>0.05 (Dunn-Sidak correction for multiple testing, N=4 tests), for soil carbon fluxes, all temperature treatments are significant from the control run (p<0.0001, Friedman Test, N=22, df=4)
Ecosystem Model) produced a better fit of ecosystem carbon uptake to observed values when the effect of soil temperature on vegetation carbon uptake was considered (Zhuang et al.2003) as the timing of the draw-down of atmospheric CO2at the start of the growing season was substantially improved. In our study, the limitation to photosynthesis in early spring, when air temperatures are already suitable for plant activity, but the soil might still be frozen and water unavailable, only reduces the annual photosynthesis by a little, usually less than 1% of total carbon uptake by vegetation. In addition, there is a small impact of soil temperature on root respiration that influences carbon uptake by vegetation. However, these responses were small and represent only a part of the total plant respiration. Only in the two most northern grid cells, was there a larger impact of soil temperature on carbon uptake by vegetation. In these grid cells, the growing season is very short, so even small changes in temperature regime might have a relatively larger impact than further south.
The impact of soil moisture on vegetation carbon fluxes did not show any changes along the considered gradient, except for the most northern grid cell. For instance, the drought stress which affected the growth of white spruce observed in Alaska (Barber et al.2000) was not apparent in our study. This may be because the JULES model had a free-draining bottom boundary and no permafrost was modelled. This means that no over-saturation or paludification was considered, which could be important in Arctic ecosystems (Callaghan et al.2005).
4.3 Temperature and precipitation uncertainties
Ecosystems of northern latitudes are particularly sensitive to changes in air temperature (Lucht et al.2002; ACIA2005and IPCC2001), so uncertainties in the model predictions of air temperature should show the strongest consequences in the northern areas: this effect is shown in our tests (Fig.4b). In contrast, precipitation increase or decrease showed little effect on vegetation and a small impact on soil carbon emissions. This is in agreement with field manipulation experiments, which showed only a small impact to additions of water on arctic vegetation (Press et al. 1998; Dormann and Woodin 2002). Our study also agrees with satellite observations showing that temperature and radiation limit plant productivity in high latitudes (Nemani et al. 2003) and modelling studies showing that responses in biogeochemical cycling and vegetation change at high latitudes are mainly sensitive to changes in air temperature and not precipitation (Lucht et al.2002). The lack of response of vegetation to uncertainties in precipitation is also in line with the small response of vegetation to changes in soil moisture representation shown in our study.
Therefore, we can conclude that for this model version of LPJ-GUESS, uncertainties in precipitation of 50% will not greatly affect the predictions of carbon fluxes. However, uncertainties in air temperature predictions are likely to have a larger impact on the predictions of carbon uptake by vegetation and carbon emissions from soils in a future changing climate.
4.4 Net ecosystem exchange
The changes in vegetation carbon uptake and soil carbon release influence net ecosystem carbon exchange (NEE, Fig.2c) and hence predictions of whether the Arctic is a source or sink for carbon. NEE is the difference between vegetation carbon uptake and soil carbon release. In this study, both processes showed opposite but strong responses to uncertainties in the representation of soil moisture and soil temperature. Therefore, modelled NEE is also sensitive to the formulation of soil moisture and varied significantly between the different
simulations runs, from being a sink for CO2in the simulation with the JULES soil moisture estimations included in the ecosystem model, to being a possible source of carbon dioxide, if soil temperatures were used from JULES (Fig.2c).
Long term changes in NEE are difficult to assess due to the high uncertainties related to the small fluxes. In addition to the uncertainties in model formulations, there are uncertainties related to the predictions in the precipitation and in air temperature which can alter the predictions about whether a given area is a source or sink of carbon. The importance of ecosystem respiration for NEE is in line with findings that respiration is highly important in carbon balance of European forests (Valentini et al.2000).
In summary, NEE showed a strong response to climate signals; combined with the uncertainties in climate predictions and the uncertainties in model formulation, we conclude that we need further investigation and improved knowledge both from the experimental side, and also for the model formulations, in order to assess the net carbon fluxes of high latitude ecosystems.
4.5 Additional factors
There are additional factors that influence the feedback of arctic systems, which are not explicitly considered in the LPJ-GUESS, such as methane emission (Christensen et al. 1999,2003; Smith et al. 2004; Sitch et al. 2007), changes in canopy complexity from tundra to forest, which results in changes in ground heat fluxes, latent heat fluxes and sensible heat fluxes (Thompson et al. 2004; Beringer et al. 2005; Chapin et al. 2005), disturbance such as fire, extreme events (Marchand et al. 2005), erosion and permafrost degradation (Malmer et al. 2005). Another important factor is the possible significant increase in rate of net N mineralization of the upper organic soil horizon following soil warming (Rustad et al.2001), which is not explicitly modelled in our study. Nitrogen is often considered to be a major limiting nutrient for plant production (Vitousek et al.1997) and therefore an increase in the availability of inorganic N should increase plant carbon uptake (Callaghan et al.2005). However, it is not certain that air warming will lead to soil warming because of increased interception of incoming radiation by an increased leaf area index (Callaghan et al. 2005) while Atkin and Cummins (1994) concluded that nutrient uptake was not increased greatly by the temperature treatments in experiments.
5 Conclusion
Soil moisture and soil temperature are important factors driving carbon fluxes, particularly soil carbon emissions. Therefore, ecosystem models should improve the formulation of soil characteristics to get a better representation of soil temperature and moisture. Furthermore, the dependence of soil carbon emissions on these factors needs to be reconsidered. The dependence of soil respiration on soil temperature uses the modified Arrhenius equation (Lloyd and Taylor1994) and the use of two soil pools with different turnover rates have been assumed to be sufficient (Knorr et al. 2005). However, the relationship of soil processes to soil moisture need to be studied in more detail and incorporated into the ecosystem model.
Precipitation pattern might not have a strong influence on productivity of northern ecosystems because of high uncertainties. Even with an increase in air temperature, plant productivity might not become water-limited. However, soil carbon emissions are sensitive
to soil moisture and hence precipitation pattern and the ecosystem responses to these should be studied with improved ecosystem models.
It should be noted that even the most realistic of the soil models used in this study did not include permafrost and hence was unable to represent some of the important sub-surface processes of the Arctic region. The model does include a parameterisation of organic soils and a simple representation of the sub-grid scale patterns in hydrology which affect soil moisture (and hence soil temperature). A further study of how uncertainties in these representations affect the soil moisture and therefore the carbon fluxes from the soils would be useful. This study can be seen as a step towards more realistic analysis of carbon fluxes in the Arctic: Striving for a better understanding and representation of soil processes in ecosystem models will improve their reliability and predictions of future ecosystem changes and more accurate predictions of the future carbon sink source status of northern ecosystems which is critical for understanding feedbacks to global climate.
Acknowledgements The project was funded by EU grant number EVK2-2002-00169. Additional funding was provided by NCCR Climate, a research initiative of the Swiss National Science Foundation. We wish to thank people from the LPJ-GUESS modelling group at Lund University for support and inspiring discussions. We also want to thank Margareta Johansson for administrative help. We like to thank Anders Lindroth and Torben Christensen who made it possible for A. Wolf to take part in the productive atmosphere of the GeoBiosphere Science Centre of Lund University. A special thanks to Alla Yurova for her helpful comments on the manuscript.
References
ACIA (2005) Arctic climate impact assessment. Cambridge University Press, Cambridge
Atkin OK, Cummins WR (1994) The effect of root temperature on the induction of nitrate reductase activities and nitrogen uptake rates in arctic plant species. Plant Soil 159:187–197
Badeck F-W, Lischke H, Bugmann H, Hickler T, Honninger K, Lasch P, Lexer MJ, Mouillot F, Schaber J, Smith B (2001) Tree species composition in European pristine forests: comparison of stand data to model predictions. Clim Change 51:307–347
Barber VA, Juday GP, Finney BP (2000) Reduced growth of Alaskan white spruce in the twentieth century from temperature-induced drought stress. Nature 405:668–673
Beringer J, Chapin FS, Thompson CC, McGuire AD (2005) Surface energy exchanges along a tundra–forest transition and feedbacks to climate. Agric For Meteorol 131:143–161
Callaghan TV, Björn LO, Chapin FS III, Chernov Y, Christensen TR, Huntley B, Ims R, Johansson M, Riedlinger DJ, Jonasson S, Matveyeva N, Oechel W, Panikov N, Shaver G (2005) Arctic Tundra and polar desert ecosystems. arctic climate impact assessment. Cambridge University Press, Cambridge, pp 243–352 Chapin FS III, Sturm M, Serreze MC, McFadden JP, Key JR, Lloyd AH, McGuire AD, Rupp TS, Lynch AH, Schimel JP, Beringer J, Chapman WL, Epstein HE, Euskirchen ES, Hinzman LD, Jia G, Ping C-L, Tape KD, Thompson CDC, Walker DA, Welker JM (2005) Role of land-surface changes in arctic summer warming. Science 310:657–660
Christensen TR, Jonasson S, Callaghan TV, Havström M (1999) On the potential CO2release from tundra
soils in a changing climate. Appl Soil Ecol 11:127–134
Christensen TR, Panikov N, Mastepanov M, Joabsson A, Öquist M, Sommerkorn M, Reynaud S, Svensson B (2003) Biotic controls on co2 and ch4 exchange in wetlands – a closed environment study. Biogeochemistry 64:337–354
Clein JS, Kwiatkowski BL, McGuire AD, Hobbie JE, Rastetter EB, Melillo JM, Kicklighter DW (2000) Modelling carbon responses of tundra ecosystems to historical and projected climate: a comparison of a plot- and a global-scale ecosystem model to identify process-based uncertainties. Glob Chang Biol 6 (S1):127–140
Cox PM, Betts RA, Bunton CB, Essery RLH, Rowntree PR, Smith J (1999) The impact of new land surface physics on the GCM simulation of climate and climate sensitivity. Clim Dyn 15:183–203
Dormann CF, Woodin SJ (2002) Climate change in the arctic: using plant functional types in a meta-analysis of field experiments. Funct Ecol 16:4–17
FAO (Food and Agricultural Organisation) (1991) The digitized soil map of the world (release 1.0). FAO, Rome Gerten D, Schabhoff S, Haberlandt U, Lucht W, Sitch S (2004) Terrestrial vegetation and water balance–
hydrological evaluation of a dynamic global vegetation model. J Hydrol 286:249–270
Hickler T (2004) Towards an integrated ecology through mechanistic modelling of ecosystem structure and functioning. PhD thesis, Dept of Physical Geography and Ecosystems Analysis, Lund University, Lund Hickler T, Smith B, Sykes MT, Davis MB, Sugita S, Walker K (2004) Using a generalized vegetation model
to simulate vegetation dynamics in northeastern USA. Ecology 85:519–530
IPCC (2001) Climate change 2001: the scientific basis. Contribution working group I to the third assessment report of the IPCC. Cambridge University Press, Cambridge
Jacob D (2001) A note to the simulation of the annual and inter-annual variability of the water budget over the Baltic sea drainage basin. Meteorol Atmos Phys 77:61–73
Jonasson S, Chapin IFS, Shaver GR (2001) Biogeochemistry in the arctic: patterns, processes and controls. In: Schulze E-D, Heimann M, Harrison SP, Holland EA, Lloyd JJ, Prentice IC, Schimel D (eds) Global biogeochemical cycles in the climate system. Academic, New York, pp 139–150
Keup-Thiel E, Goettel H, Jacob D (2006) Regional climate simulations for the Barents Sea region. Boreal Environ Res 11:1–12
Knorr W, Prentice CI, House JI, Holland EA (2005) Long-term sensitivity of soil carbon turnover to warming. Nature 433:298–301
Koca D (2006) Impacts of regional climate change on swedish forests: an evaluation using process-based regional ecosystem modelling approach. PhD thesis, Dept of Physical Geography and Ecosystems Analysis, Lund University, Lund
Lloyd J, Taylor JA (1994) On the temperature dependence of soil respiration. Funct Ecol 8:315–323 Lucht W, Prentice IC, Myneni RB, Sitch S, Friedlingstein P, Cramer W, Bousquet P, Buermann W, Smith B
(2002) Climatic control of the high-latitude vegetation greening trend and pinatubo effect. Science 296:1687–1689
Malmer N, Johansson T, Olsrud M, Christensen TR (2005) Vegetation, climatic changes and net carbon sequestration in a north-Scandinavian subarctic mire over 30 years. Glob Chang Biol 11:1895–1909 Marchand FL, Mertens S, Kockelbergh F, Beyens L, Nijs I (2005) Performance of high arctic tundra plants
improved during but deteriorated after exposure to a simulated extreme temperature event. Glob Chang Biol 11:2078–2089
McGuire AD, Melillo JM, Kicklighter DW, Joyce LA (1995) Equilibrium responses of soil carbon to climate change: Empirical and process-based estimates. J Biogeogr 22:785–796
McGuire AD, Melillo JM, Randerson JT, Parton WJ, Heimann M, Meier RA, Clein S, Kicklighter DW, Sauf W (2000a) Modeling the effects of snowpack on heterotrophic respiration across northern temperate and high latitude regions: comparison with measurements of atmospheric carbon dioxide in high latitudes. Biogeochemistry 48:91–114
McGuire AD, Clein JS, Melillo JM, Kicklighter DW, Meier RA, Vorosmarty CJ, Serreze MC (2000b) Modelling carbon responses of tundra ecosystems to historical and projected climate: Sensitivity of pan-arctic carbon storage to temporal and spatial variation in climate. Glob Chang Biol 6(S1):141–159 Mitchell TD, Jones (2005) An improved method of constructing a database of monthly climate observations
and associated high-resolution grids. Int J Climatol 25:693–712 DOI10.1002/joc.1181
Morales P (2006) Modeling carbon and water fluxes in European terrestrial ecosystems. PhD thesis, Dept of Physical Geography and Ecosystems Analysis, Lund University, Lund
Morales P, Sykes MT, Prentice CI, Smith P, Smith B, Bugmann H, Zierl B, Friedlingstein P, Viovy N, Sabate S, Sanchez A, Pla E, Gracia CA, Sitch S, Arneth A, Ogee J (2005) Comparing and evaluating process-based ecosystem model predictions of carbon and water fluxes in major European forest biomes. Glob Chang Biol 11:1–23
Nemani RR, Keeling CD, Hashimoto H, Jolly WM, Piper SC, Tucker CJ, Myneni RB, Running SW (2003) Climate-driven increases in global terrestrial net primary production from 1982 to 1999. Science 300:1560–1563
Oberhuber JM (1993) The OPYC ocean general circulation model. Report no. 7. Dtsch. Klimarechenzentrum GmbH, Hamburg, Germany
Press MC, Potter JA, Burke MJW, Callaghan TV, Lee JA (1998) Response of a subarctic dwarf shrub heath community to simulated environmental change. J Ecol 86:315–327
Raich JW, Potter CS (1995) Global patterns of carbon dioxide emissions from soils. Glob Biogeochem Cycles 9:23–36
Raich JW, Schlesinger WH (1992) The global carbon dioxide flux in soil respiration and its relationship to vegetation and climate. Tellus B 44:81–99
Roeckner E, Arpe K, Bengtsson L, Christoph M, Claussen M, Dümenil L, Esch M, Giorgetta M, Schlese U, Schulzweida U (1996) The atmospheric general circulation model echam-4: model description and simulation of present-day climate. Report no. 218. Max-Planck-Institut für Meteorologie, Hamburg Rustad LE, Campbell JL, Marion GM, Norby RJ, Mitchell MJ, Hartley AE, Cornelissen JHC, Gurevitch J
(2001) A meta-analysis of the response of soil respiration, net nitrogen mineralization, and aboveground plant growth to experimental ecosystem warming. Oecologia 126:543–562
Sitch S, Smith B, Prentice IC, Arneth A, Bondeau A, Cramer W, Kaplan JO, Levis S, Lucht W, Sykes MT, Thonicke K, Venevsky S (2003) Evaluation of ecosystem dynamics, plant geography and terrestrial carbon cycling in the LPJ dynamic global vegetation model. Glob Chang Biol 9:161–185
Sitch S, McGuire AD, Kimball J, Gedney N, Gamon J, Engstrom R, Wolf A, Zhuang Q, Clein J, McDonald K (2007) Assessing the carbon balance of circumpolar arctic tundra using remote sensing and process modeling. Ecological Application 17:213–234
Smith B, Prentice IC, Sykes MT (2001) Representation of vegetation dynamics in the modelling of terrestrial ecosystems: Comparing two contrasting approaches within European climate space. Glob Ecol Biogeogr 10:621–637
Smith LC, Macdonald GM, Velichko AA, Beilman DW, Borisova OK, Frey KE, Kremenetski KV, Sheng Y (2004) Siberian peatlands a net carbon sink and global methane source since the early Holocene. Science 303:353–356
Sokal RR, Rohlf FJ (1995) Biometry. WH Freeman, New York
Sonesson M, Carlsson BA, Callaghan TV, Halling S, Björn LO, Bertgren M, Johansson U (2002) Growth of two peat-forming mosses in subarctic mires: species interactions and effects of simulated climate change. Oikos 99:151–160
Thompson C, Beringer J, Chapin FS III, McGuire AD (2004) Structural complexity and land-surface energy exchange along a gradient from arctic tundra to boreal forest. J Veg Sci 15:397–406
Valentini R, Matteucci G, Dolman AJ, Schulze E-D, Rebmann C, Moors EJ, Granier A, Gross P, Jensen NO, Pilegaard K, Lindroth A, Grelle A, Bernhofer C, Grünwald T, Aubinet M, Ceulemans R, Kowalski AS, Vesala T, Rannik Ü, Berbigier P, Loustau D, Gudmundsson J, Thorgeirsson H, Ibrom A, Morgenstern K, Clement R, Moncrieff J, Montagnani L, Minerbi S, Jarvis PG (2000) Respiration as the main determinant of carbon balance in european forests. Nature 404:861–865
Van Wijk MT, Williams M, Gough L, Hobbie SE, Shaver GR (2003) Luxury consumption of soil nutrients: a possible competitive strategy in above-ground and below-ground biomass allocation and root morphology for slow-growing arctic vegetation? J Ecol 91:664–676
Vitousek PM, Aber J, Howarth RW, Likens GE, Matson PA, Schindler DW, Schlesinger WH, Tilman GD (1997) Human alteration of the global nitrogen cycle: causes and consequences. Ecol Appl 7:737–750 Walker DA (2000) Hierarchical subdivision of arctic tundra based on vegetation response to climate, parent
material and topography. Glob Chang Biol 6(S1):19–34
Walker DA, Auerbach NA, Bockheim JG, Chapin FS III, Eugster W, King JY, McFadden JP, Michaelson GJ, Nelson FE, Oechel WC, Ping CL, Reeburg WS, Regli S, Shiklomanov NI, Vourlitis GL (1998) Energy and trace-gas fluxes across a soil ph boundary in the arctic. Nature 394:469–472
Wolf A, Callaghan TV, Larson K (2008) Future changes in vegetation and ecosystem function of the barents region. DOI10.1007/s10584-007-9342-4
Zhuang Q, McGuire AD, O’Neill KP, Harden JW, Romanovsky VE, Yarie J (2003) Modeling soil thermal and carbon dynamics of a fire chronosequence in interior Alaska.