HAL Id: hal-00297890
https://hal.archives-ouvertes.fr/hal-00297890
Submitted on 27 Apr 2007HAL is a multi-disciplinary open access
archive for the deposit and dissemination of sci-entific research documents, whether they are pub-lished or not. The documents may come from teaching and research institutions in France or abroad, or from public or private research centers.
L’archive ouverte pluridisciplinaire HAL, est destinée au dépôt et à la diffusion de documents scientifiques de niveau recherche, publiés ou non, émanant des établissements d’enseignement et de recherche français ou étrangers, des laboratoires publics ou privés.
Adjoint sensitivity of the air-sea CO2 flux to ecosystem
parameterization in a three-dimensional global ocean
carbon cycle model
J. F. Tjiputra, A. M. E. Winguth
To cite this version:
J. F. Tjiputra, A. M. E. Winguth. Adjoint sensitivity of the air-sea CO2 flux to ecosystem parameter-ization in a three-dimensional global ocean carbon cycle model. Biogeosciences Discussions, European Geosciences Union, 2007, 4 (2), pp.1377-1404. �hal-00297890�
BGD
4, 1377–1404, 2007 Sensitivity study of air-sea CO2flux J. F. Tjiputra and A. M. E. Winguth Title Page Abstract Introduction Conclusions References Tables Figures ◭ ◮ ◭ ◮ Back CloseFull Screen / Esc
Printer-friendly Version Interactive Discussion
Biogeosciences Discuss., 4, 1377–1404, 2007 www.biogeosciences-discuss.net/4/1377/2007/ © Author(s) 2007. This work is licensed
under a Creative Commons License.
Biogeosciences Discussions
Biogeosciences Discussions is the access reviewed discussion forum of Biogeosciences
Adjoint sensitivity of the air-sea CO
2
flux
to ecosystem parameterization in a
three-dimensional global ocean carbon
cycle model
J. F. Tjiputra and A. M. E. Winguth
Department of Atmospheric Oceanic and Space Sciences, University of Wisconsin, Madison, Wisconsin, USA
Received: 5 April 2007 – Accepted: 7 April 2007 – Published: 27 April 2007 Correspondence to: J. F. Tjiputra ([email protected])
BGD
4, 1377–1404, 2007 Sensitivity study of air-sea CO2flux J. F. Tjiputra and A. M. E. Winguth Title Page Abstract Introduction Conclusions References Tables Figures ◭ ◮ ◭ ◮ Back CloseFull Screen / Esc
Printer-friendly Version Interactive Discussion
EGU
Abstract
The regional sensitivity of air-sea CO2 flux to ecosystem components and parameters
in a three-dimensional ocean carbon cycle model is estimated using an adjoint model. Adjoint sensitivities to the global air-sea CO2flux reveal that the biological component of the model is significant in the high latitudes of both hemispheres and in the
Equa-5
torial Pacific. More detailed analysis indicates that zooplankton grazing activity plays a major role in the carbon exchange in the above regions. The herbivores’ ingestion parameter in the model regulates the flux of remineralized (i.e. regenerated) biogenic nutrients; thus, substantially controls the biological production and the concentration of dissolved inorganic carbon (DIC) in the euphotic zone. Over a 10-year period,
reduc-10
ing the herbivores’ ingestion parameter in the model by 25% could increase the global uptake of atmospheric carbon by 6 Pg C. Thus, climate induced changes in the marine ecosystem structure are of importance for the future uptake of atmospheric CO2.
1 Introduction
Carbon dioxide is an important anthropogenic greenhouse gas and its concentration
15
in the atmosphere increased from about 280 ppm in the pre-industrial era to 379 ppm in 2005 (Intergovernmental Panel of Climate Change (IPCC), Summary for Policymak-ers, 2007,http://www.ipcc.ch). This number exceeds the natural ranges over the past 650 000 years and is expected to keep increasing in the future due to continuous fossil fuel burning and land use changes, such as deforestation. Atmospheric carbon
diox-20
ide will eventually be distributed into three main carbon reservoirs: the atmosphere, the ocean, and the terrestrial biosphere, with the ocean being the largest of the three. Sabine et al. (2004) have estimated that nearly half of the emitted anthropogenic CO2 has ended up in the ocean. Within the euphotic zone (i.e. the ocean surface layer with sufficient light), carbon exchange between the atmosphere and ocean is determined by
25
in-BGD
4, 1377–1404, 2007 Sensitivity study of air-sea CO2flux J. F. Tjiputra and A. M. E. Winguth Title Page Abstract Introduction Conclusions References Tables Figures ◭ ◮ ◭ ◮ Back CloseFull Screen / Esc
Printer-friendly Version Interactive Discussion
troduced by Volk and Hoffert (1985), are known as the solubility and biological pumps. Seawater solubility of CO2increases with decreasing sea surface temperatures (Weiss, 1974). The biological pump is divided into soft tissue and calcium carbonate pumps, which are controlled by the vertical flux of particulate organic carbon and inorganic cal-careous shell material into the deep sea, respectively. The soft tissue pump transfers
5
carbon formed by photosynthesis from the surface to the deep sea, which decreases the surface pCO2and increases uptake of CO2from the overlying atmosphere. On the
other hand, the calcium carbonate pump transfers carbonate ions from the surface to the deep sea, which decreases the alkalinity and increases the pCO2at the surface.
Many model studies have shown the importance of marine biology in lowering
atmo-10
spheric CO2(e.g. Najjar et al., 1992; Siegenthaler and Sarmiento, 1993; Maier-Reimer et al., 1996; Sarmiento et al., 1998; Archer et al., 2000; Plattner et al., 2001; Takahashi et al., 2002; Bopp et al., 2003; Gloor et al., 2003; Cameron et al., 2005; Le Qu ´er ´e et al., 2005; Wetzel et al., 2005; Winguth et al., 2005), but relatively few studies have been conducted to analyze in detail the sensitivity of air-sea CO2flux to perturbations of
dif-15
ferent ecosystem components or processes (Sarmiento and Orr, 1991; Gnanadesikan et al., 2003; Zeebe and Archer, 2005; Dutkiewicz et al., 2006; Parekh et al., 2006). Of the above studies, only Dutkiewicz et al. (2006) applied the adjoint model to estimate such sensitivity.
Here, we will attempt to estimate and examine the sensitivity of air-sea CO2 flux to
20
perturbations of ecosystem components and parameters in a three-dimensional global ocean carbon cycle model using the adjoint approach. The adjoint model is applied to efficiently produce a global map of sensitivity of atmospheric CO2uptake with respect
to changes of regional ecosystem parameters and components. The sensitivity map will be applied to analyze the role of different ecosystem processes (e.g. productivity,
25
grazing, remineralization, etc.) in regulating atmospheric CO2 concentrations. The manuscript is designed as follow: Sect. 2 briefly describes the forward and adjoint models used in this study. Section 3 explains the model interpolation and sensitivity experiment results. The paper concludes in Sect. 4.
BGD
4, 1377–1404, 2007 Sensitivity study of air-sea CO2flux J. F. Tjiputra and A. M. E. Winguth Title Page Abstract Introduction Conclusions References Tables Figures ◭ ◮ ◭ ◮ Back CloseFull Screen / Esc
Printer-friendly Version Interactive Discussion
EGU
2 Forward and adjoint model description
This study employs the Hamburg Ocean Carbon Cycle (HAMOCC5) model, which uses monthly climatology forcing and is based on studies by Maier-Reimer (1993), Six and Maier-Reimer (1996), and Aumont et al. (2003). The model has a 3.5◦
×3.5◦ horizon-tal resolution and 22 vertical layers with thickness varying from 50 m at the surface to
5
700 m in the deepest layer. The geochemical tracers in the model are advected with a time step of one month, while a faster time step of three days is used in the euphotic zone (i.e. the upper two layers of the model) to resolve ecosystem and air-sea gas exchange processes. The marine productivity is controlled by macronutrients (phos-phate, nitrate, and silicate) and micronutrients (dissolved iron). The biological pump
10
is comprised of organic and inorganic export out of the two uppermost model layers, which correspond to a mean euphotic zone with a depth of 107 m. The model is able to simulate the main characteristics of ocean biogeochemistry and resolve some of the High Nutrient-Low Chlorophyll (HNLC) regions in the world by implementing iron lim-itation productivity. For example, it is capable to simulate the distribution of the main
15
biochemical tracers in the ocean including phosphate, nitrate, iron, dissolved inorganic carbon, alkalinity, and radiocarbon. Compared to the more computationally expensive, high-resolution ocean model, this model allows us to efficiently apply the adjoint tech-nique in order to study the large-scale pattern of the biogeochemical state in the entire water column. Due to the relatively short integration time scale (ten years) of the
ex-20
periments, the sediment module is simplified by introducing a sink-only sediment layer. A more detailed description of the model can be found in Howard et al. (2006).
In this experiment, the model run is started in the year 1995 and integrated through 2005, while maintaining averaged atmospheric CO2 concentration at 375 ppm. The
seasonal cycle of air-sea CO2 flux in the high and low latitudes at different ocean
25
locations (e.g. Bermuda Atlantic Time-Series Study (BATS), Hawaii Ocean Time-Series (HOTS) and Southern Ocean, 56◦N, 275◦W) simulated by the model fit reasonably well
BGD
4, 1377–1404, 2007 Sensitivity study of air-sea CO2flux J. F. Tjiputra and A. M. E. Winguth Title Page Abstract Introduction Conclusions References Tables Figures ◭ ◮ ◭ ◮ Back CloseFull Screen / Esc
Printer-friendly Version Interactive Discussion
a phase lag exist in the Southern Ocean, which may be associated to interannual variations, deficiencies in the model, and the sparse data in this location. The average annual air-sea CO2flux for this period is also shown in Fig. 1 together with interpolated
averaged observations from Takahashi et al. (2002), which is based on 940 000 pCO2 measurements in surface mixed-layer and corrected to the wind speeds at 10 m (http:
5
//www.ldeo.columbia.edu/res/pi/CO2/). In general, the model agrees reasonably well with the data with common features including efflux in the equatorial oceans due to upwelling of cold, CO2-rich deep water and uptake in the subtropical gyres and high
latitude oceans.
The adjoint model allows us to efficiently estimate the sensitivity of model output
10
(i.e. air-sea CO2flux) with respect to small perturbations of model input or control pa-rameters. In contrast to finite perturbation method, adjoint sensitivity are equivalent to thousands of forward perturbation runs with only a fraction of the computational ex-pense by running one forward and one adjoint model integration. Here, the adjoint codes have been generated by the TAMC (Tangent linear and Adjoint Model Compiler)
15
(Giering and Kaminski, 1998; www.fastopt.com) and improved manually to be com-putationally efficient. The accuracy of the adjoint code has been tested using a finite difference approximation. The cost function (JF CO2) is defined as the global air-sea CO2flux (FCO2), and is based on the Wanninkhof (1992) formulation integrated over all
ocean surface area for a period of ten years (from 1995–2005):
20
JF CO2 = ZZ
FCO2d Ad t (1)
FCO2= k(pCO2(air)− pCO2(sea)) (2)
wherek is the gas transfer velocity, and pCO2(air) and pCO2(sea) represent the partial pressure of CO2 in the atmosphere and in the surface ocean, respectively. A
rep-resents the area of the specific model grid and t represents time integration. The
25
sensitivity map in this study is produced by using the adjoint model to estimate the par-tial derivative of the cost function to a small perturbation of a specific control variable,
BGD
4, 1377–1404, 2007 Sensitivity study of air-sea CO2flux J. F. Tjiputra and A. M. E. Winguth Title Page Abstract Introduction Conclusions References Tables Figures ◭ ◮ ◭ ◮ Back CloseFull Screen / Esc
Printer-friendly Version Interactive Discussion
EGU ∂JF CO2/∂α(x, y), at each model grid.
3 Sensitivity experiments
3.1 Seasonal variability of pCO2
The change of the partial pressure of CO2 in the surface ocean depends on the DIC
concentration, temperature, alkalinity, and the salinity of the water (Le Qu ´er ´e et al.,
5 2000; Wetzel et al., 2005). d pCO2 d t = ∂pCO2 ∂DIC d DIC d t + ∂pCO2 ∂T d T d t + ∂pCO2 ∂T ALK d T ALK d t + ∂pCO2 ∂S d S d t (3)
Here, the seasonal cycle of surface pCO2 due to each component in Eq. (3) is
calcu-lated separately. The adjoint model is applied to calculate the monthly partial derivative term in the equation (i.e.∂pCO2
∂DIC , ∂pCO2 ∂T , ∂pCO2 ∂T ALK, ∂pCO2
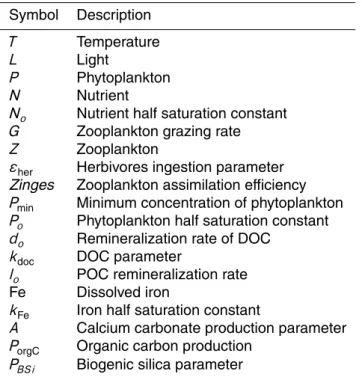
∂S ). Figure 2 shows the seasonal
cy-10
cle of each component for different regions of world oceans according to Takahashi et al. (2002). The variability of the sum of all components has been confirmed using the differential of monthly output of the forward model.
In most regions, the seasonal variability of pCO2 is controlled by the temperature
andDIC concentration variability at the surface. There is a relatively small variability
15
of pCO2caused by the alkalinity and salinity terms in all regions due to their small
sea-sonal variability (Weiss et al., 1982). As expected, in the tropical regions (14◦N–14◦S),
the seasonal variability is relatively small, except in the Indian Ocean, which may be a result of seasonal monsoon events. The temperature variability is more apparent in the low latitudes. TheDIC term in the tropical regions is relatively small because the
biol-20
ogy and advection processes, which control theDIC variability in these regions, almost cancel each other out (see below). In the subtropical regions, where warm tropical wa-ter meets colder high latitude wawa-ter, the temperature andDIC terms are of the same magnitude. In the high latitude (north of 14◦N and south of 14◦S) the pCO
BGD
4, 1377–1404, 2007 Sensitivity study of air-sea CO2flux J. F. Tjiputra and A. M. E. Winguth Title Page Abstract Introduction Conclusions References Tables Figures ◭ ◮ ◭ ◮ Back CloseFull Screen / Esc
Printer-friendly Version Interactive Discussion
is dominated by theDIC term, especially in the Southern Ocean. This analysis is con-sistent with regional (North Atlantic) studies by McKinley et al. (2004) and Takahashi et al. (2002). The prescribed surface temperatures in the model consider factors from advection, shortwave and longwave radiation, and latent and sensible heat.
3.2 Seasonal variability ofDIC
5
The change ofDIC concentration in the model is proportional to the sources and sinks combination of advection (i.e. advection and diffusion), biological production, fresh wa-ter fluxes, air-sea exchange, and convective mixing.
d DIC
d t = Jadd+ Jbio+ Jf w + JF CO2+ Jcon (4) The biological production term in the model is further comprised of:
10
Jbio= −r(T, L) · P ·
N
N + No + P (CaCO3) + g · Z · εher· (1 − zinges) · (5) (P − Pmin) P + Po + do· N N + kdoc · DOC + lo· POC r(T, L) = f (T ) · f (L) pf (T )2+ f (L)2 · Fe (Fe + kFe) (6)
P (CaCO3) = A(PorgC− 0.5 · PBSi) (7)
All the notations in Eqs. (5), (6), and (7) are described in Table 1. The terms in
15
Eq. (5) represent primary production, calcium carbonate production, and remineral-ization of the following: non-assimilated zooplankton (Z) grazing, dissolved organic carbon (DOC), dead zooplankton, and particulate organic carbon (POC). Primary production depends on regionally varying growth rates and nutrient concentration
BGD
4, 1377–1404, 2007 Sensitivity study of air-sea CO2flux J. F. Tjiputra and A. M. E. Winguth Title Page Abstract Introduction Conclusions References Tables Figures ◭ ◮ ◭ ◮ Back CloseFull Screen / Esc
Printer-friendly Version Interactive Discussion
EGU N= min(PO4, NO3). The growth rate of phytoplankton (P) is a function of light,
tem-perature and dissolved iron as shown in Eq. (6), and calcium carbonate production is a function of organic production and silicate concentration in the euphotic layer. A more complete description of the ecosystem processes in the model is available at Tjiputra et al. (2007).
5
Figure 3 shows the seasonal cycle of each component in Eq. (4) for different ocean regions. In almost all regions, the biology term has a stronger seasonal amplitude than the other terms. The convective mixing term occurs seasonally in the mid and high latitude regions with stronger mixing during winter periods. Fresh water flux has little effect on the seasonal DIC variability. In the tropical regions, the advection term,
10
which is dominated by continuous upwelling, is as strong as the biological term. In the mid latitude regions, theDIC variability is dominated by the biological and convective mixing terms. In the high latitudes, the variability ofDIC is dominated by the biology term, consistent to study by Wetzel (2004).
3.3 Regional sensitivity of air-sea CO2flux with respect to the ecosystem components
15
in the model
To investigate the biological contribution to the air-sea CO2flux in more detail, the
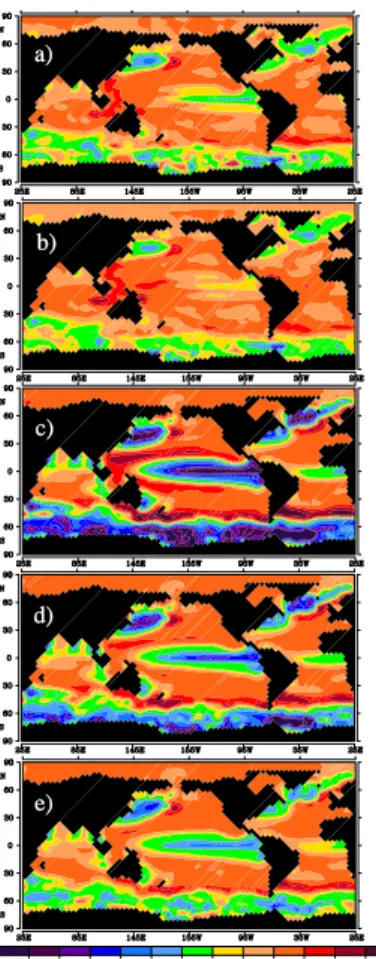
ad-joint model is applied to estimate the regional sensitivity map of global air-sea CO2flux to perturbations of the nutrient∂JF CO2/∂N(i,j), phytoplankton∂JF CO2/∂P(i,j ), and zoo-plankton∂JF CO2/∂Z(i ,j ) components of the model. Both forward and the adjoint
mod-20
els are integrated for ten years with a monthly perturbation of nitrate (0.16µmol N/L), phosphate (0.01µmol P/L), zooplankton (1.27 µmol C/L), phytoplankton (1.27 µmol C/L), and iron (0.033 nmol Fe/L) concentration for each experiment. The sensitivities (or gradient) of the air-sea CO2flux to the perturbation of these components are plotted in Fig. 4.
25
The sensitivity runs show that, in general, the cost function is more sensitive to change of phosphate than nitrate by a factor of two (i.e. based on Redfield ratio P:N of 1:16). In most regions of the world, certain type of organism (e.g. cyanobacteria)
BGD
4, 1377–1404, 2007 Sensitivity study of air-sea CO2flux J. F. Tjiputra and A. M. E. Winguth Title Page Abstract Introduction Conclusions References Tables Figures ◭ ◮ ◭ ◮ Back CloseFull Screen / Esc
Printer-friendly Version Interactive Discussion
can fix nitrate from atmospheric dinitrogen (N2) (Tyrrell, 1999). Nitrate concentration
is crucial in the Eastern Equatorial Pacific and Northeast Pacific. The sensitivity map shows that phosphate is the dominant limiting nutrient in the tropical Atlantic regions. For example, over ten years period, the sensitivity map indicates high sensitivity of the air-sea CO2flux to changes in phosphate in the eastern subtropical North Atlantic. This
5
high sensitivity is especially due to high concentration of dust input in this region, which allow more efficient macronutrient uptake for phytoplankton growth. The atmospheric carbon uptake is more sensitive to phosphate perturbation in the tropical and subtrop-ical regions than in the high latitude regions. This is due to the seasonal requirement of phosphate in the high latitudes whereas a year long supply of phosphate is needed
10
in the equatorial regions.
In general, zooplankton grazing limits the growth of phytoplankton, thus limits the uptake of atmospheric CO2 by photosynthesis. Figure 4c illustrates that reducing the
zooplankton concentration in most ocean regions would increase the uptake of CO2by the ocean, with the strongest region being the Western Equatorial Pacific Ocean. This
15
region has sufficient light and temperature for phytoplankton growth, but relatively low nutrient concentration. The consequence of reduced zooplankton concentration is the increase in average phytoplankton lifetime, as there are fewer predators, thus allowing more photosynthesis and uptake of surfaceDIC. Additionally, reducing the zooplank-ton concentration also increases the carbon flux from phytoplankzooplank-ton to the POC and
20
DOC components of the model and increases the concentration of regenerated nutri-ent flux. More detail role of the zooplankton activity in CO2 uptake is further explored
in the next section.
The air-sea CO2 flux is sensitive toward phytoplankton addition in the tropical and
high latitude regions. In the equatorial regions, adding more phytoplankton results in
25
increase of DIC concentration, hence surface pCO2. To better analyze the process
occurring in the high latitude, we run the similar sensitivity experiments toward phyto-plankton, with perturbation only during JFM (January February March) and JAS (July August September) periods. The results are shown in Fig. 5 together with
convec-BGD
4, 1377–1404, 2007 Sensitivity study of air-sea CO2flux J. F. Tjiputra and A. M. E. Winguth Title Page Abstract Introduction Conclusions References Tables Figures ◭ ◮ ◭ ◮ Back CloseFull Screen / Esc
Printer-friendly Version Interactive Discussion
EGU tive mixing event simulated in the model during the respective periods. In both
hemi-sphere’s winter season, the global uptake of CO2 increase with the addition of phy-toplankton concentration, especially in regions with high convective overturning pro-cesses, which upwelled additional nutrient to fuel more biological production. During summer seasons, adding phytoplankton concentration increase outgassing of carbon,
5
similar to the tropic regions.
The micronutrient iron is found to be the most sensitive in the Equatorial Pacific, followed by the Southern Ocean and the North Pacific regions. This is expected since there is a constant supply of macronutrients in the Equatorial Pacific but a very limited source of iron. In contrast, the Atlantic Ocean has a large flux of aeolian dust input
10
from the Sahara desert (Mahowald et al., 2005), making it insensitive to iron input. The Southern Ocean and the North Pacific are also known for iron limited regions, but since the uptake of CO2 in these regions occurs seasonally, the magnitude of
sensitivity is relatively weaker than that of the Equatorial Pacific. The iron sensitivity map confirms an earlier sensitivity study by Dutkiewicz et al. (2006). However, their
15
study indicates much stronger sensitivity in the Equatorial Pacific than our results. This may be contributed by the significantly low iron concentration in the Equatorial Pacific Ocean simulated by their model. The models discrepancy is difficult to validate due to the very limited and sparse observation of dissolved iron currently available (Parekh et al., 2005).
20
3.4 Regional sensitivity of air-sea CO2 flux with respect to ecosystem parameters in
the model
In order to explore in more detail the role of plankton activity in the air-sea carbon exchange, the regional sensitivity of air-sea CO2 flux toward ecosystem parameters are explored as well. Earlier global and regional adjoint sensitivity studies (Zhao et
25
al., 2005; Tjiputra et al., 2007) indicate that phytoplankton maximum growth, phyto-plankton exudation, ingestion by herbivores, zoophyto-plankton grazing, and zoophyto-plankton excretion parameters are sensitive and hence will be tested for the regional scale. To
BGD
4, 1377–1404, 2007 Sensitivity study of air-sea CO2flux J. F. Tjiputra and A. M. E. Winguth Title Page Abstract Introduction Conclusions References Tables Figures ◭ ◮ ◭ ◮ Back CloseFull Screen / Esc
Printer-friendly Version Interactive Discussion
simplify the analysis, the parameter units are uniformed by scaling the parameters to P i=[P (new)/P (first guess)] (e.g. Giering, 1989). The adjoint model is applied to calcu-late∂JF CO2/∂P i(i ,j)for each parameter. Overall, the global air-sea CO2flux is sensitive
toward these ecosystem parameters in regions with large annual productivity, including the Equatorial Pacific, the North Pacific (Western Gyre), the North Atlantic, and the
5
Southern Ocean.
With respect to phytoplankton-associated parameters in the model, the air-sea CO2
flux is sensitive toward growth rate and exudation rate parameters. Both Figs. 6a and b indicate that carbon uptake is sensitive to these parameters, especially in the Equa-torial Pacific, North Pacific, and North Atlantic regions. Notable sensitivities are also
10
revealed in parts of Southern Ocean and Indian Ocean. The sensitivity maps indicate that increasing the growth rate and reducing the exudation rate in these regions would increase the global uptake of CO2. The change of the respected parameters would
result in more phytoplankton mass remain in the surface, thus increasing the primary production and reducing theDIC concentration in the euphotic zone. In contrast, the
15
uptake of CO2in regions with low nutrient concentrations (e.g. subtropical Pacific), are
reduced if the phytoplankton growth rate is increased. These oligotrophic regions have low biological production all year long (Behrenfeld et al., 2005) and are considered to be atmospheric carbon sinks (see Fig. 1). However, due to the low nutrient concen-tration in these regions, increasing the exudation rate may provide additional dissolved
20
organic carbon (DOC), which could be remineralized as regenerated nutrients.
Both in the ocean and lake ecosystems, zooplankton play an important role in con-trolling the nutrient uptake (i.e. primary production) by phytoplankton (Carpenter et al., 2001; Moore et al., 2002; Pasquer et al., 2005; Schindler et al., 1997). For exam-ple, lakes with high zooplankton biomass tend to uptake atmospheric CO2, whereas
25
lakes with low zooplankton tend to do the opposite. In this study, we show that in regions where the air-sea CO2 flux is controlled by the biological component, the
sur-face carbon fluxes are sensitive to herbivore ingestion and grazing. The sensitivity map (Fig. 6c) illustrates that in regions with strong upwelling and convective mixing,
BGD
4, 1377–1404, 2007 Sensitivity study of air-sea CO2flux J. F. Tjiputra and A. M. E. Winguth Title Page Abstract Introduction Conclusions References Tables Figures ◭ ◮ ◭ ◮ Back CloseFull Screen / Esc
Printer-friendly Version Interactive Discussion
EGU reducing the ingestion by herbivores would substantially increase the uptake of
atmo-spheric CO2. Having a low ingestion rate (i.e. high egestion rate) reduces the amount of carbon stored in the zooplankton biomass, allowing more carbon to be stored in POC and DOC. Therefore, there is more available carbon that can be recycled imme-diately into nutrients in the euphotic zone. Previous sensitivity studies using only a
one-5
dimensional forward model demonstrate that the model output (e.g. the sea-to-air CO2
flux and surface pCO2) is sensitive toward grazing parameters in the Equatorial Pacific
region (Chai et al., 2002; Dugdale et al., 2002). Here, the adjoint sensitivity identifies three main regions where the air-sea CO2 flux is sensitive toward grazing
parame-ters: the Equatorial Pacific, North Pacific, and Southern Ocean. Figure 6d also shows
10
strong sensitivity toward grazing parameters in the Bermuda Atlantic Time-series Study (BATS), which is consistent with in situ observations. This indicates that zooplankton grazing consumes most of the production at this location (Lessard and Murrell, 1998). In these regions, a reduction in the grazing rate increases phytoplankton mass in the euphotic zone, thus increasing the nutrient andDIC uptake by phytoplankton. The
sen-15
sitivity of the zooplankton excretion parameter further emphasizes that the ecosystem dynamics are highly sensitive to zooplankton biomass.
In order to quantitatively test the sensitivity toward ecosystem parameters, the for-ward model is integrated for 10-years with different parameter perturbations. The anomalies of global air-sea CO2 flux to these perturbation are plotted in Fig. 7. The
20
control run has an average annual carbon uptake of 1.6 Pg C yr−1. This value is close
to the corrected Takahashi et al. (2002) estimate of 1.64 Pg C yr−1 for the year 1995
(http://www.ldeo.columbia.edu/CO2/) and within limits of Sabine et al. (2004) estimate. Over the 10-year period, significant atmospheric carbon sinks occur in the Equato-rial Pacific, Western North Pacific Gyre, North Atlantic, and Southern Ocean regions.
25
Essentially, the largest drawdown occurs when the herbivore ingestion parameter is reduced by 25%. The total uptake of atmospheric carbon yielded by perturbing the phytoplankton growth rate, exudation rate, herbivores ingestion, grazing rate, and ex-cretion rate are 1.7, 1.7, 2.2, 2.0, and 1.9 Pg C yr−1, respectively, over 10-year period.
BGD
4, 1377–1404, 2007 Sensitivity study of air-sea CO2flux J. F. Tjiputra and A. M. E. Winguth Title Page Abstract Introduction Conclusions References Tables Figures ◭ ◮ ◭ ◮ Back CloseFull Screen / Esc
Printer-friendly Version Interactive Discussion
Figure 7 also provides a first order estimate of strong biological pump regions. South-ern Ocean, Equatorial Pacific, and North Pacific are three of the strongest ocean region in which the biological production contributes significantly to the sinks of theDIC con-centration in the surface. Furthermore, these regions, which are also known as High-Nutrient-Low-Chlorophyll (HNLC) regions, have not reach their maximum production
5
due to limited iron supply in these regions (Martin et al., 1994; de Baar et al., 1995). In addition, our adjoint sensitivity study indicates that the air-sea gas exchanges in these regions are not only sensitive toward iron fertilization but also very sensitive toward zooplankton-associated parameters (i.e. grazing and ingestion parameters). These re-sults are also supported by previous field studies, which indicate the significant role
10
of zooplankton in suppressing the phytoplankton growth, thus biological production in HNLC regions (Landry et al., 2003; Price et al., 1994; Saito et al., 2005).
4 Conclusions
This study highlights the importance of the marine ecosystem structure in controlling global air-sea CO2 flux. Here, we demonstrate with an adjoint three-dimensional
car-15
bon cycle model that, outside of the tropic regions, convective mixing, biological pro-duction, and seasonal temperature variability mainly control the seasonal variability of pCO2. In the subpolar gyres, the biology activity is essentially responsible for the
variability. These results are consistent with the observations (Takahashi et al., 2002; Watson and Orr, 2003) and a study by Pasquer et al. (2005) who claimed that the
20
Southern Ocean would be a source rather than a sink of atmospheric CO2 without
biological activity.
The analysis with the adjoint carbon cycle model has provided valuable information on which processes in the marine ecosystem significantly control the air-sea CO2gas
exchange. Along equatorial upwelling regions, the primary production is fueled
suffi-25
ciently by a continuous supply of upwelled nutrients, which decrease theDIC concen-tration and pCO2 in the surface layer. However, this effect is more than compensated
BGD
4, 1377–1404, 2007 Sensitivity study of air-sea CO2flux J. F. Tjiputra and A. M. E. Winguth Title Page Abstract Introduction Conclusions References Tables Figures ◭ ◮ ◭ ◮ Back CloseFull Screen / Esc
Printer-friendly Version Interactive Discussion
EGU by the upwelledDIC-rich watermass. At high latitudes, however, photosynthesis peaks
during the spring and summer months, and drops significantly during the fall and winter months. The sensitivity experiments demonstrate that the uptake of atmospheric CO2
is sensitive to biological processes at both the high latitudes (e.g. North Pacific, McKin-ley et al., 2006, Antarctic Ocean, Metzl et al., 1999) and the nutrient-rich low latitudes
5
(i.e. Equatorial Pacific).
In regions where nutrients are the limiting factor for primary production, nutrient fer-tilization should increase carbon fixation and the uptake of atmospheric CO2. However, this study shows that the amplitude of the outcome crucially depends on the structure within the regional ecosystem. The adjoint sensitivity maps illustrate that phosphate is
10
an essential limiting factor for regions with sufficient light and temperature for growth. Regions with strong iron input, such as the Equatorial Atlantic, are very limited by Phosphate concentration. In nearly all parts of the ocean, atmospheric CO2 uptake
increases with a reduction of zooplankton concentration, which yields faster recycling of nutrients in the euphotic zone. Moreover, lowering the zooplankton concentration
15
results in extended phytoplankton life span, which prolongs high photosynthesis pro-duction periods.
The sensitivity map of air-sea CO2flux toward ecosystem parameters also indicates
that plankton activity and the food web structure can significantly alter the flux of CO2
between the atmosphere and ocean. For example, the air-sea carbon exchange in
20
the high-nutrient low-chlorophyll (HNLC) regions, such as the Equatorial Pacific, the Subarctic North Pacific, and the Southern Ocean are sensitive not only toward iron, but also toward zooplankton ingestion, grazing, and excretion parameters. The role of zoo-plankton in these regions is mainly to suppress phytozoo-plankton growth and slow down the process of nutrient remineralization. In the oligotrophic sub-tropical regions, the
25
biological production can be amplified by increasing the flux of regenerated nutrients in the euphotic zone; for example, this can be achieved by increasing the exudation rate of phytoplankton.
BGD
4, 1377–1404, 2007 Sensitivity study of air-sea CO2flux J. F. Tjiputra and A. M. E. Winguth Title Page Abstract Introduction Conclusions References Tables Figures ◭ ◮ ◭ ◮ Back CloseFull Screen / Esc
Printer-friendly Version Interactive Discussion
outcome essentially depends on the performance of the ecosystem model. For ex-ample, the adjoint sensitivity also depends on the initial condition of the ecosystem component and the first guess of the parameters. These parameters are determined based on observations and laboratory studies (e.g. Eppley, 1972; Amon and Benner, 1994), and therefore do not necessarily represent the global marine ecosystem.
Op-5
timization techniques, such as the 4-DVAR method, can provide more insight on how to better constrain these parameters (Tjiputra et al., 2007; Zhao et al., 2005). Further-more, a study by Doney et al. (2004) demonstrates that physical properties (e.g. sur-face forcing, convective mixing parameterization, vertical and horizontal resolutions, etc.) of many biogeochemical models can significantly impact the carbon cycle
fore-10
cast. Thus, improving the parameterization of the physical processes in the model is also necessary in the near future. In summary, the adjoint model provides valuable information in identifying processes that could significantly influence the air-sea CO2
flux estimates of the model. Having a more detailed and accurate parameterization of the sensitive processes can substantially reduce the model-data discrepancies and
15
improve the model forecast. Future field experiments to test the results of this study are undoubtedly necessary.
Acknowledgements. We greatly thank E. Maier-Reimer for providing the HAMOCC5 model and
fruitful discussions. We thank M. Franklin for reading and commenting on the manuscript. This research was supported by NASA (NAG-11245), the NSF-EAR (0628336), and the University
20
of Wisconsin graduate school.
References
Amon, R. H., W. and Benner, R.: Rapid cycling of hhigh molecular weight dissolved organic matter in the ocean, Nature, 369, 549–552, 1994.
Archer, D., Winguth, A., Lea, D., and Mahowald, N.: What caused the glacial/interglacial
atmo-25
spheric pCO2 cycles?, Rev. Geophys., 38, 159–189, 2000.
BGD
4, 1377–1404, 2007 Sensitivity study of air-sea CO2flux J. F. Tjiputra and A. M. E. Winguth Title Page Abstract Introduction Conclusions References Tables Figures ◭ ◮ ◭ ◮ Back CloseFull Screen / Esc
Printer-friendly Version Interactive Discussion
EGU
global ocean including Fe, Si, P colimitations, Global Biogeochem. Cycles, 17(2), 1060, doi:10.1029/2001GB001745, 2003.
Behrenfeld, M. J., Boss, E., Siegel, D. A. and Shea, D. M.: Carbon-based ocean produc-tivity and phytoplankton physiology from space, Global Biogeochem. Cycles, 19, GB1006, doi:10.1029/2004GB002299, 2005.
5
Bopp, L., Kohfeld, K. E., Le Qu ´er ´e, C., and Aumont, O.: Dust impact on marine biota and atmospheric CO2, Paleoceanography, 18(2), 1046, doi:10.1029/2002PA000810, 2003. Cameron, D. D., Lenton, T. M., Ridgwell, A. J., Shepherd, J. G., Marsh, R., and Yool, A.:
A factorial analysis of marine carbon cycle and ocean circulation controls on atmospheric CO2, Global Biogeochem. Cycles, 19, 4027, doi:10.1029/2005GB002489, 2005.
10
Carpenter, S. R., Cole, J. J., Hodgson, J. R., Kitchell, J. F., Pace, M. L., Bade, D., Cottingham, K. L., Essington, T. E., Houser, J. N., and Schindler, D. E.: Trophic Cascades, Nutrients, and Lake Productivity: Whole-Lake Experiments, Ecological Monograph, 71(2), 163–186, 2001. Chai, F., Dugdale, R. C., Peng, T.-H., Wilkerson, F. P., and Barber, R. T.: One-dimensional
ecosystem model of the equatorial Pacific upwelling system. Part I: model development and
15
silicon and nitrogen cycle, Deep Sea Res. Part II, 49, 2713–2745, 2002.
de Baar, H. J. W., De Jong, J. T. M., Bakker, D. C. E., L ¨oscher, B. M., Veth, C., Bathmann, U., and Smetacek, V.: Importance of iron for phytoplankton blooms and carbon dioxide draw-down in the Southern Ocean, Nature, 373, 412–415, 1995.
Doney, S. C., Lindsay, K., Caldeira, K., et al.: Evaluating global ocean carbon
mod-20
els: The importance of realistic physics, Global Biogeochem. Cycles, 18, GB3017, doi:10.1029/2003GB002150, 2004.
Dugdale, R. C., Barber, R. T., Chai, F., Peng, T.-H., and Wilkerson, F. P.: One-dimensional ecosystem model of the equatorial Pacific upwelling system. Part II: sensitivity analysis and comparison with JGOFS EqPac data, Deep Sea Res. Part II, 49, 2747–2768, 2002.
25
Dutkiewicz, S., Follows, M. J., and Parekh, P.: Interactions of the iron and phospho-rus cycles: A three-dimensional model study, Global Biogeochem. Cycles, 19, GB1021, doi:10.1029/2004GB002342, 2005.
Dutkiewicz, S., Follows, M. J., Heimbach, P., and Marshall, J.: Controls on ocean productivity and air-sea carbon flux: an adjoint model sensitivity study, Geophys. Res. Lett., 33, L02603,
30
doi:10.1029/2005GL024987, 2006.
Eppley, R. W.: Temperature and phytoplankton growth in the sea, Fish. Bull., 70, 1063–1085, 1972.
BGD
4, 1377–1404, 2007 Sensitivity study of air-sea CO2flux J. F. Tjiputra and A. M. E. Winguth Title Page Abstract Introduction Conclusions References Tables Figures ◭ ◮ ◭ ◮ Back CloseFull Screen / Esc
Printer-friendly Version Interactive Discussion Giering, R.: Assimilation von satellitendaten in eir dreidimensionales numerisches model de
atlantischen zirkulation, M. S. thesis, Univ. of Hamburg, Hamburg, Germany, 1989.
Giering, R. and Kaminski, T.: Recipes for adjoint code construction, ACM Transactions on Mathematical Software, 24, 437–474, 1998.
Gloor, M., Gruber, N., Sarmiento, J., Sabine, C. L., Feely, R. A., and R ¨odenbeck, C.: A first
es-5
timate of present and preindustrial air-sea CO2flux patterns based on ocean interior carbon measurements and models, Geophys. Res. Lett., 30, 1010, doi:10.1029/2002GL015594, 2003.
Gnanadesikan, A., Sarmiento, J. L., and Slater, R. D.: Effects of patchy ocean fertilization on atmospheric carbon dioxide and biological production, Global Biogeochem. Cycles, 17(2),
10
1050, doi:10.1029/2002GB001940, 2003.
Howard, M. T., Winguth, A. M. E., Klaas, C., and Maier-Reimer, E.: Sensitivity of ocean carbon tracer distributions to particulate organic flux parameterizations, Global Biogeochem. Cycles, 20, GB3011, doi:10.1029/2005GB002499, 2006.
Landry, M. R., Brown, S. L., Neveux, J., Dupouy, C., et al.: Phytoplankton growth and
microzoo-15
plankton grazing in high-nutrient, low-chlorophyll waters of the equatorial Pacific: Community and taxon-specific rate assessments from pigment and flow cytometric analyses, J. Geophys. Res., 108(C12), 8142, doi:10.1029/2000JC000744, 2003.
Le Qu ´er ´e, C., Orr, J. C., Monfray, P., Aumont, O., and Madec, G.: Interannual variability of the oceanic sink of CO2 from 1979 through 1997, Global Biogeochem. Cycles, 14, 1247–1265,
20
2000.
Le Qu ´er ´e, C., Harrison, S. P., Colin Prentice, I., et al.: Ecosystem dynamics based on plank-ton functional types for global ocean biogeochemistry models, Global Change Biology, 11, doi:10.11111/j.1365-2486.2005.01004.x, 2016–2040, 2005.
Lessard, E. J. and Murrell, M. C.: Microzooplankton herbivory and phytoplankton growth in the
25
northwestern Sargasso Sea, Aquatic Microbial Ecology, 16, 173–188, 1998.
Mahowald, N. M., Baker, A. R., Bergametti, G., et al.: Atmospheric global dust cycle and iron inputs to the ocean, Global Biogeochem. Cycles, 19, GB4025, doi:10.1029/2004GB002402, 2005.
Maier-Reimer, E., Mikolajewicz, U., and Winguth, A.: Future ocean uptake of CO2- Interaction
30
between ocean circulation and biology, Climate Dynamics, 12, 711–721, 1996.
Martin, J. H., Coale, K. H., Johnson, K. S., et al.: Testing the iron hypothesis in ecosystems of the equatorial Pacific, Nature, 371, 123–129, 1994.
BGD
4, 1377–1404, 2007 Sensitivity study of air-sea CO2flux J. F. Tjiputra and A. M. E. Winguth Title Page Abstract Introduction Conclusions References Tables Figures ◭ ◮ ◭ ◮ Back CloseFull Screen / Esc
Printer-friendly Version Interactive Discussion
EGU
McKinley, G. A., Follows, M. J., and Marshall, J.: Mechanism of air-sea CO2 flux variability in the equatorial Pacific and the North Atlantic, Global Biogeochem. Cycles, 18, GB2011, doi:10.1029/2003GB002179, 2004.
McKinley, G. A., Takahashi, T., Buitenhuis, E., et al.: North Pacific carbon cycle response to climate variability on seasonal to decadal timescales. J. Geophys. Res., 111, C07S06,
5
doi:10.1029/2005JC00317, 2006.
Metzl, N., Tilbrook, B., and Poisson, A.: The annual fCO2cycle and the air-sea CO2flux in the sub-Antarctic Ocean, Tellus, B 51, 849–861, 1999.
Moore, J. K., Doney, S. C., Kleypas, J. A., Glover, D. M., and Fung, I. Y.: An intermediate complexity marine ecosystem model for the global domain, Deep-Sea Res. II, 49, 403–462,
10
2002.
Najjar, R. G., Sarmiento, J. L., and Toggweiler, J. R.: Downward transport and fate of organic matter in the ocean: Simulations with a general circulation model, Global Biogeochem. Cy-cles, 6, 403–462, 1992.
Parekh, P., Follows, M. J., and Boyle, E. A.: Decoupling of iron and phosphate in the global
15
ocean, Global Biogeochem. Cycles, 19, GB2020, doi:10.1029/2004GB002280, 2005. Parekh, P., Dutkiewicz, S., Follows, M., and Ito, T.: Atmospheric carbon dioxide in a less dusty
world. Geophys. Res. Lett., 33, L03610, doi:10.1029/2005GL025098, 2006.
Pasquer, T., Laruelle, G., Becquevort, S., Schoemann, V., Goosse, H., and Lancelot, C.: Linking ocean biogeochemical cycles and ecosystem structure and function: results of the complex
20
SWAMCO-4 model, J. Sea Res., 53, 93–108, 2005.
Plattner, G.-K., Joos, F., Stocker, T. F., and Marchal, O.: Feedback mechanisms and sensitivities of ocean carbon uptake under global warming, Tellus, Ser. B, 53, 564–592, 2001.
Price, N. M., Ahner, B. A., and Morel, F. M. M.: The equatorial Pacific Ocean: Grazer-controlled phytoplankton populations in an iron-limited ecosystem, Limnol. Oceanogr., 39(3), 520–534,
25
1994.
Sabine, L. S., Feely, R. A., Gruber, N., Key, R. M., Lee, K., Bullister, J. L., Wanninkhof, R., Wong, C. S., Wallace, D. W. R., Tilbrook, B., Millero, F. J., Peng, T., Kozyr, A., Ono, T., and Rios, A. F.: The oceanic sink for anthropogenic CO2, Science, 305, 367–371, 2004.
Saito, H., Suzuki, K., Hinuma, A., Ota, T., Fukami, K., Kiyosawa, H., Saino, T., and Tsuda, A.:
30
Responses of microzooplankton to in situ iron fertilization in the western Subarctic Pacific (SEEDS), Progress in Oceanogr., 64(2–4), 223–236, 2005.
BGD
4, 1377–1404, 2007 Sensitivity study of air-sea CO2flux J. F. Tjiputra and A. M. E. Winguth Title Page Abstract Introduction Conclusions References Tables Figures ◭ ◮ ◭ ◮ Back CloseFull Screen / Esc
Printer-friendly Version Interactive Discussion nutrient depletion on atmospheric CO2and ocean chemistry, Limnol. Oceanogr., 36, 1928–
1950, 1991.
Sarmiento, J. L., Hughes, T. M. C., Stouffer, R. J., and Manabe, S.: Simulated response of the ocean carbon cycle to anthropogenic climate warming. Nature, 393(6682), 245–249, 1998. Schindler, D. E., Carpenter, S. R., Cole, J. J., Kitchell, J. F., and Pace, M. L.: Influence of Food
5
Web Structure on Carbon Exchange Between Lakes and the Atmosphere, Science, 227, 248–251, 1997.
Siegenthaler, U. and Sarmiento, J. L.: Atmospheric carbon dioxide the ocean. Nature, 365(6442), 119–125, 1993.
Six, K. D. and Maier-Reimer, E.: Effects of plankton dynamics on seasonal carbon fluxes in an
10
ocean general circulation model, Global Biogeochem. Cycles, 10, 559–583, 1996.
Takahashi, T., Sutherland, M. L., Sweeney, C., Poisson, A., Metzel, N., Tilbrook, B., Bates, N., Wanninkhof, R., Feely, R. A., Sabine, C., Olafsson, J., and Nojiri, Y.: Global sea-air CO2 flux based on climatological surface ocean pCO2, and seasonal biological and temperature effects, Deep-Sea Res. II, 49, 1601–1622, 2002.
15
Tjiputra, J. F., Polzin, D., and Winguth, A. M. E.: Assimilation of seasonal chlorophyll and nu-trient data into an adjoint three-dimensional ocean carbon cycle model: Sensitivity anal-ysis and ecosystem parameter optimization, Global Biogeochem. Cycles, 21, GB1001, doi:10.1029/2006GB002745, 2007.
Tyrrell, T.: The relative influences of nitrogen and phosphorus on oceanic primary production,
20
Nature, 400, 525–531, 1999.
Volk, T. and Hoffert, M. I.: Ocean carbon pumps: Analysis of relative strengths and efficiencies in ocean-driven atmospheric CO2 changes, in: The Carbon Cycle and Atmospheric CO2: Natural Variations Archean to Present, edited by: Sunquist, E. T. and Broecker, W. S., 99– 110, AGU, Washington, D. C., 1985.
25
Watson, A. J. and Orr, J. C.: Carbon dioxide fluxes in the global ocean, in: Ocean Biogeo-chemistry. The role of the ocean carbon cycle in global change, edited by: Fasham, M. J. R., 123–143, Springer-Verlag, Berlin, 2003.
Weiss, R. F.: Carbon dioxide in water and seawater: The solubility of a non-ideal gas, Mar. Chem., 2, 203–215, 1974.
30
Weiss, R. F., Jahnke, R. A., and Keeling, C. D.: Seasonal effects of temperature and salinity on the partial pressure of CO2in seawater, Nature, 300, 511–513, 1982.
BGD
4, 1377–1404, 2007 Sensitivity study of air-sea CO2flux J. F. Tjiputra and A. M. E. Winguth Title Page Abstract Introduction Conclusions References Tables Figures ◭ ◮ ◭ ◮ Back CloseFull Screen / Esc
Printer-friendly Version Interactive Discussion
EGU
Report on Earth System Science (Ph.D. Dissertation), Max-Planck-Institut f ¨ur Meteologie, Hamburg, Germany, 2004.
Wetzel, P, Winguth, A., and Maier-Reimer, E.: Sea-to-air CO2flux from 1948 to 2003: A model study, Global Biogeochem. Cycles, 19, GB2005, doi:10.1029/2004GB002339, 2005. Winguth, A. M. E., Mikolajewicz, U., Gr ¨oger, M., Maier-Reimer, E., Schugers, G., and
5
Vizca´ıno, M.: Centennial-scale interactions between the carbon cycle and anthropogenic climate change using a dynamic earth system model, Geophys. Res.Lett., 32, L23714, doi:10.1029/2005GL02368, 2005.
Zeebe, R. E. and Archer, D.: Feasibility of ocean fertilization and its impacts on future atmo-spheric CO2 levels, Geophys. Res. Lett., 32, L09703, doi:10.1029/2005GL022449, 2005.
10
Zhao, L., Wei, H., Xu, Y., and Feng, S.: An adjoint data assimilation approach for estimating parameters in a three-dimensional ecosystem model, Ecol. Modell., 186, 234–249, 2005.
BGD
4, 1377–1404, 2007 Sensitivity study of air-sea CO2flux J. F. Tjiputra and A. M. E. Winguth Title Page Abstract Introduction Conclusions References Tables Figures ◭ ◮ ◭ ◮ Back CloseFull Screen / Esc
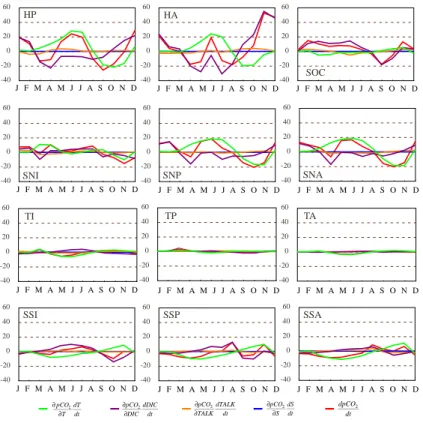
Printer-friendly Version Interactive Discussion Table 1. Description of ecosystem parameters.
Symbol Description
T Temperature
L Light
P Phytoplankton
N Nutrient
No Nutrient half saturation constant
G Zooplankton grazing rate
Z Zooplankton
εher Herbivores ingestion parameter
Zinges Zooplankton assimilation efficiency
Pmin Minimum concentration of phytoplankton
Po Phytoplankton half saturation constant
do Remineralization rate of DOC
kdoc DOC parameter
lo POC remineralization rate
Fe Dissolved iron
kFe Iron half saturation constant
A Calcium carbonate production parameter
PorgC Organic carbon production
BGD
4, 1377–1404, 2007 Sensitivity study of air-sea CO2flux J. F. Tjiputra and A. M. E. Winguth Title Page Abstract Introduction Conclusions References Tables Figures ◭ ◮ ◭ ◮ Back CloseFull Screen / Esc
Printer-friendly Version Interactive Discussion
EGU
HAMOCC Takahashi et al. (2002)
d) d) e) e) [moles C/m2 yr] (no data) J FM A M J JA S O N D -0.6 -0.3 0 0.3 0.6 BATS JFM AM J JA SO N D HOTS a) b) c) JFM AM J JA SO N D Southern Ocean
Fig. 1. HAMOCC5 model simulated seasonal cycle of air-sea CO2flux [in moles CO2m−2yr−1]
at (a) Bermuda Atlantic Time-Series Study (BATS), (b) Hawaii Ocean Time-Series (HOTS), and (c) Southern Ocean (56◦S, 275◦W) with observation estimates from Takahashi et al. (2002).
Averaged air-sea CO2flux for the year 1995 estimated from (d) observations by Takahashi et al. (2002) and (e) from HAMOCC5 model simulation. Positive values represent outgassing to atmosphere, whereas negative values indicate uptake of CO2from the atmosphere.
BGD
4, 1377–1404, 2007 Sensitivity study of air-sea CO2flux J. F. Tjiputra and A. M. E. Winguth Title Page Abstract Introduction Conclusions References Tables Figures ◭ ◮ ◭ ◮ Back CloseFull Screen / Esc
Printer-friendly Version Interactive Discussion -40 -20 0 20 40 60 SOC -40 -20 0 20 40 60 HP -40 -20 0 20 40 60 HA J F M A M J J A S O N D J F M A M J J A S O N D J F M A M J J A S O N D J F M A M J J A S O N D J F M A M J J A S O N D J F M A M J J A S O N D ∂pCO2 ∂T dT dt ∂pCO2 ∂DIC dDIC dt ∂pCO2 ∂TALK dTALK dt ∂pCO2 ∂S dS dt dpCO2 dt -40 -20 0 20 40 60 SNI -40 -20 0 20 40 60 SNP -40 -20 0 20 40 60 SNA -40 -20 0 20 40 60 SSI -40 -20 0 20 40 60 SSP -40 -20 0 20 40 60 SSA -40 -20 0 20 40 60 TI -40 -20 0 20 40 60 TP -40 -20 0 20 40 60 TA J F M A M J J A S O N D J F M A M J J A S O N D J F M A M J J A S O N D J F M A M J J A S O N D J F M A M J J A S O N D J F M A M J J A S O N D
Fig. 2. Seasonal cycle of the total change of pCO2 and the contributions to the total change (Eq. 3) for different ocean regions: sea surface temperature, dissolved inorganic carbon, al-kalinity, and salinity. Ocean regions are defined as follow: High latitude Pacific (HP, N of 50◦N), High latitude Atlantic (HA, N of 50◦N), Southern Ocean (SOC, S of 50◦S),
Subtropi-cal North Indian (SNI, 14◦N–50◦N), Subtropical North Pacific (SNP, 14◦N–50◦N), Subtropical
North Atlantic (SNA, 14◦N–50◦N), Tropical Indian (TI, 14◦N–14◦S), Tropical Pacific (TP, 14◦N–
14◦S), Tropical Atlantic (TA, 14◦N–14◦S) Subtropical South Indian (SSI, 14◦S–50◦S),
BGD
4, 1377–1404, 2007 Sensitivity study of air-sea CO2flux J. F. Tjiputra and A. M. E. Winguth Title Page Abstract Introduction Conclusions References Tables Figures ◭ ◮ ◭ ◮ Back CloseFull Screen / Esc
Printer-friendly Version Interactive Discussion
EGU
add bio fw fco2 con dDIC/dt
-225 -150 -75 0 75 150 225 SOC HA HP -225 -150 -75 0 75 150 225 -225 -150 -75 0 75 150 225 -225 -150 -75 0 75 150 225 SNA -225 -150 -75 0 75 150 225 -225 -150 -75 0 75 150 225 SNI SNP SSA -225 -150 -75 0 75 150 225 -225 -150 -75 0 75 150 225 -225 -150 -75 0 75 150 225 SSI SSP -225 -150 -75 0 75 150 225 TA -225 -150 -75 0 75 150 225 -225 -150 -75 0 75 150 225 TI TP J F M A M J J A S O N D J F M A M J J A S O N D J F M A M J J A S O N D J F M A M J J A S O N D J F M A M J J A S O N D J F M A M J J A S O N D J F M A M J J A S O N D J F M A M J J A S O N D J F M A M J J A S O N D J F M A M J J A S O N D J F M A M J J A S O N D J F M A M J J A S O N D
Fig. 3. Seasonal cycle of total change of dissolved inorganic carbon (DIC) and the contributions
to the total change (Eq. 4): advection, biology, fresh water flux, air-sea CO2flux, and convective mixing. Ocean regions are defined similarly as Fig. 2. Units are in [g C m−2yr−1].
BGD
4, 1377–1404, 2007 Sensitivity study of air-sea CO2flux J. F. Tjiputra and A. M. E. Winguth Title Page Abstract Introduction Conclusions References Tables Figures ◭ ◮ ◭ ◮ Back CloseFull Screen / Esc
Printer-friendly Version Interactive Discussion 0.0 -0.001 -0.002 -0.003 -0.004 -0.005 -0.006 -0.008 -0.010 -0.012 0.014 0.012 0.010 0.008 0.006 0.004 0.003 0.002 0.001 0.0 0.024 0.022 0.020 0.018 0.016 0.014 0.012 0.010 0.008 0.0 0.0 -0.2 -0.4 -0.6 -0.8 -1.0 -1.2 -1.4 -1.6 -1.8 e) e) a) a) c) c) d) d) 0.01 0.0 -0.01 -0.02 -0.03 -0.04 -0.05 -0.06 -0.07 -0.08 b) b)
Fig. 4. Regional sensitivity map of air-sea CO2 flux toward (a) nitrate [units in Pg C/(µmol N L−1)], (b) phosphate [Pg C/(µmol P L−1)], (c) zooplankton [Pg C/(µmol C L−1)], (d)
phytoplankton [Pg C/(µmol C L−1)], and (e) iron [Pg C/(nmol Fe L−1)] over ten year periods.
Neg-ative values indicate that an increase in the correspondent variable will increase the uptake of CO2from the atmosphere. Positive values indicate otherwise.
BGD
4, 1377–1404, 2007 Sensitivity study of air-sea CO2flux J. F. Tjiputra and A. M. E. Winguth Title Page Abstract Introduction Conclusions References Tables Figures ◭ ◮ ◭ ◮ Back CloseFull Screen / Esc
Printer-friendly Version Interactive Discussion EGU Figure 5.
c)
c)
d)
d)
a)
a)
b)
b)
3.0 3.0 1.0 0.8 0.6 0.4 0.3 0.2 0.1 0.0 0.0025 0.0020 0.0015 0.0010 0.0005 0.0 -0.0005 -0.0010 -0.0015 -0.0020Fig. 5. Convective mixing event for the (a) JFM and (b) JAS in the HAMOCC5. Larger values represent stronger mixing due to convective overturning. Ten-year regional sensitivity map of air-sea CO2 flux toward phytoplankton for perturbation on (c) JFM and (d) JAS periods [Pg C/(µmol C L−1)]. Negative values indicate that an increase in the correspondent variable will
BGD
4, 1377–1404, 2007 Sensitivity study of air-sea CO2flux J. F. Tjiputra and A. M. E. Winguth Title Page Abstract Introduction Conclusions References Tables Figures ◭ ◮ ◭ ◮ Back CloseFull Screen / Esc
Printer-friendly Version Interactive Discussion 0.0 -0.005 -0.010 -0.015 -0.020 -0.025 -0.030 -0.040 -0.050 -0.060 0.060 0.050 0.040 0.030 0.025 0.020 0.015 0.010 0.005 0.0 0.240 0.200 0.160 0.120 0.080 0.060 0.040 0.020 0.010 0.0 0.030 0.020 0.015 0.010 0.005 0.0 -0.005 -0.010 -0.015 -0.020 0.005 0.0 -0.005 -0.010 -0.015 -0.020 -0.030 -0.040 -0.050 -0.060 a) a) b) b) c) c) d) d) e) e)
Fig. 6. Regional sensitivity map of air-sea CO2flux toward (a) phytoplankton maximum growth rate, (b) phytoplankton exudation, (c) herbivores ingestion, (d) zooplankton grazing, and (e) zooplankton excretion parameters over ten year periods. Negative values indicate that an increase in the correspondent variable will increase the uptake of CO from the atmosphere.
BGD
4, 1377–1404, 2007 Sensitivity study of air-sea CO2flux J. F. Tjiputra and A. M. E. Winguth Title Page Abstract Introduction Conclusions References Tables Figures ◭ ◮ ◭ ◮ Back CloseFull Screen / Esc
Printer-friendly Version Interactive Discussion EGU a) a) b) b) c) c) d) d) e) e)
Fig. 7. Anomalies of sea-air CO2 flux integrated from yr 1995–2005 for (a) 1.25 times phy-toplankton growth parameter, (b) 0.75 times exudation parameter, (c) 0.75 times herbivore ingestion parameter, (d) 0.75 times grazing parameter, and (e) 1.25 times excretion parame-ters. Units are in [moles C/m2]. Negative values represent an increase in atmospheric carbon uptake, whereas positive values represent increase in outgassing.
![Fig. 1. HAMOCC5 model simulated seasonal cycle of air-sea CO 2 flux [in moles CO 2 m − 2 yr − 1 ] at (a) Bermuda Atlantic Time-Series Study (BATS), (b) Hawaii Ocean Time-Series (HOTS), and (c) Southern Ocean (56 ◦ S, 275 ◦ W) with observation estimates fro](https://thumb-eu.123doks.com/thumbv2/123doknet/14776932.594308/23.918.192.523.38.511/hamocc-simulated-seasonal-bermuda-atlantic-southern-observation-estimates.webp)

![Fig. 4. Regional sensitivity map of air-sea CO 2 flux toward (a) nitrate [units in Pg C/(µmol N L − 1 )], (b) phosphate [Pg C/(µmol P L − 1 )], (c) zooplankton [Pg C/(µmol C L − 1 )], (d) phytoplankton [Pg C/(µmol C L − 1 )], and (e) iron [Pg C/(nmol Fe L](https://thumb-eu.123doks.com/thumbv2/123doknet/14776932.594308/26.918.249.460.39.519/regional-sensitivity-nitrate-units-µmol-phosphate-zooplankton-phytoplankton.webp)