HAL Id: hal-02929355
https://hal.archives-ouvertes.fr/hal-02929355
Submitted on 25 Nov 2020
HAL is a multi-disciplinary open access
archive for the deposit and dissemination of
sci-entific research documents, whether they are
pub-lished or not. The documents may come from
teaching and research institutions in France or
abroad, or from public or private research centers.
L’archive ouverte pluridisciplinaire HAL, est
destinée au dépôt et à la diffusion de documents
scientifiques de niveau recherche, publiés ou non,
émanant des établissements d’enseignement et de
recherche français ou étrangers, des laboratoires
publics ou privés.
Topological Dynamics of a Radical Ion Pair:
Experimental and Computational Assessment at the
Relevant Nanosecond Timescale
Helmut Quast, Georg Gescheidt, Martin Spichty
To cite this version:
Helmut Quast, Georg Gescheidt, Martin Spichty. Topological Dynamics of a Radical Ion Pair:
Exper-imental and Computational Assessment at the Relevant Nanosecond Timescale. Chemistry, MDPI,
2020, 2 (2), pp.219-230. �10.3390/chemistry2020014�. �hal-02929355�
Chemistry 2020, 2, Firstpage-Lastpage; doi: FOR PEER REVIEW www.mdpi.com/journal/chemistry
Article
Topological Dynamics of a Radical Ion Pair:
Experimental and Computational Assessment at the
Relevant Nanosecond Timescale
†
Helmut Quast 1,‡, Georg Gescheidt 2,*, and Martin Spichty 3,*,§
1 Institute of Organic Chemistry, University of Würzburg, Am Hubland, 97074 Würzburg, Germany;
2 Institute of Physical and Theoretical Chemistry, Technical University of Graz, NAWI Graz, Stremayrgasse
9, 8010 Graz, Austria.
3 Laboratoire de Biologie et Modélisation de la Cellule, Ecole Normale Supérieure de Lyon, CNRS, Université
Lyon 1, Université de Lyon; 46 allée d’Italie; 69364 Lyon cedex 07; France.
* Correspondence: [email protected] (G.G.); [email protected] (M.S.); Tel.: +43-316-873
32220 (G.G.); +33-389-336862 (M.S.).
‡ Current address: Hoetgerstrasse 10, 49080 Osnabrück, Germany.
§ Current address: Laboratoire d’Innovation Moléculaire et Applications, Site de Mulhouse – IRJBD, 3 bis rue
Alfred Werner, 68057 Mulhouse Cedex, France.
† Dedicated to Professor Bernd Giese on behalf of his 80th birthday.
Received: 28 February 2020; Accepted: 27 March 2020; Published: 30 March 2020
Abstract: Chemical processes mostly happen in fluid environments where reaction partners
encounter via diffusion. The bimolecular encounters take place at a nanosecond time scale. The chemical environment (e.g., solvent molecules, (counter)ions) has a decisive influence on the reactivity as it determines the contact time between two molecules and affects the energetics. For understanding reactivity at an atomic level and at the appropriate dynamic time scale, it is crucial to combine matching experimental and theoretical data. Here, we have utilized all-atom molecular-dynamics simulations for accessing the key time scale (nanoseconds) using a QM/MM-Hamiltonian. Ion pairs consisting of a radical ion and its counterion are ideal systems to assess the theoretical predictions because they reflect dynamics at an appropriate time scale when studied by temperature-dependent EPR spectroscopy. We have investigated a diketone radical anion with its tetra-ethylammonium counterion. We have established a funnel-like transition path connecting two (equivalent) complexation sites. The agreement between the molecular-dynamics simulation and the experimental data presents a new paradigm for ion–ion interactions. This study exemplarily demonstrates the impact of the molecular environment on the topological states of reaction intermediates and how these states can be consistently elucidated through the combination of theory and experiment. We anticipate that our findings will contribute to the prediction of bimolecular transformations in the condensed phase with relevance to chemical synthesis, polymers, and biological activity.
Keywords: ion pairing; radical anion; kinetics; thermodynamics; molecular dynamics; QM/MM;
EPR
1. Introduction
Photo-induced and organic electrochemical procedures have experienced a substantial push in recent times. These methodologies generally involve the formation of charged species. Here, ion pairing plays an important role in solution, as indicated in recent publications [1–4]. The important
role of ion pairing extends in fields like catalysis [5], organic synthesis [6–8], and the chemistry of flavonoids [9,10] and radical-induced DNA-strand breaks [11]. These charge-separated reaction intermediates are often decisive for the character and efficiency of the follow-up reactions and product formation. The question is, how the corresponding ion-pairing phenomena impact chemical reactivity [12]. Ion pairs possess highly dynamic topologies in the fluid phase. The association between charged species alters between ps and µs, reflecting decisive time scales of chemical reactivity. Especially photo-induced reactions involve intermediates with particularly short lifetimes that overlap with the time scale of topological dynamics.
The aim of our work is to validate an approach that has the potential to serve as a predictive tool for assessing the time-dependent topologies of ion pairs at the atomic level. This should provide unique insights, which can be translated into strategies for the optimization of reactions involving charge-separated states. The requirement for such an approach is providing reliable parameters for the structural, electronic, and kinetic properties of ion pairs. Beside the thermodynamics (energies) of its constituents, the solvation sphere and the time profile of the interacting species have to be determined.
All-atom molecular-dynamics simulations provide the required structural and kinetic resolution, which has to be linked to experimental data. Here, the dynamic hyperfine time scale of electron paramagnetic resonance (EPR) ranges from MHz to a few GHz (µs–ns), matching the
required kinetic regime. For testing our approach, we chose diketone 1
((3aS,6aS)-3a,6a-dimethyl-3a,6a-dihydropentalene-1,4-dione, Scheme 1), possessing two identical non-conjugated 2-en-1-one moieties. It forms sufficiently persistent radical anions (upon electrolytic
reduction). With a counterion such as tetraethylammonium (Et4N+) encounters 1•–, it can bind to
either of the two equivalent oxygen atoms (Scheme 1). There is a dynamic equilibrium between these two states, leading to fluctuations of the spin distribution, which can be conveniently followed by variable-temperature EPR. The radical nature of the ion pair requires time-consuming quantum-mechanical (QM) calculations. In addition, the solvent and the dynamic nature of the entire system have to be regarded at the nanosecond time scale. These requirements are matched by QM/MM-based molecular dynamics simulations [13–15] (Figure 1). To access the nanosecond time-scale, we use a semi-empirical method for the quantum mechanical (QM) part and a force field method for the molecular mechanical (MM) part. As both methods rely on parameterization, it is essential to verify the validity of the chosen QM/MM-Hamiltonian. In these terms, the relatively
small size of 1•– makes it an ideal paradigm for linking the EPR experiment and all-atom
molecular-dynamics simulations. This enables us to validate atomistic predictions from the theory versus macroscopic data from the experiment.
Scheme 1. Electron delocalization after electrolytic reduction of diketone 1.
2. Materials and Methods
2.1. EPR Experiments
EPR spectra were performed on a Varian E9 spectrometer (T102 cavity) equipped with a variable
temperature controller. The radical anions were generated on an amalgamated helical Au electrode (counterelectrode; Pt wire), according to the design by Allendoerfer et al. [16]. The voltage was gradually (200 mV steps) increased until an EPR spectrum was detected. Electrolysis was performed in acetonitrile as the solvent and tetraethylammonium perchlorate was used as the supporting salt (0.01 m). The simulations were performed using EasySpin [17,18]. Life-time broadening [19–21]
owing to dynamic chemical exchange is taken into account with a two-jump model, as described in the literature [18,22]. Here, the slow-exchange limit is characterized by the two protons H–C(3) and H–C(6) having distinctly differing isotropic hyperfine coupling constants (hfcs). Whereas one hfc is set to 0 mT, the other has an hfc of 1.14 mT. Accordingly, in the case of fast exchange, both of these protons become formally equivalent displaying the averaged hfc of 0.57 mT (2 equiv. H, see “Results”).
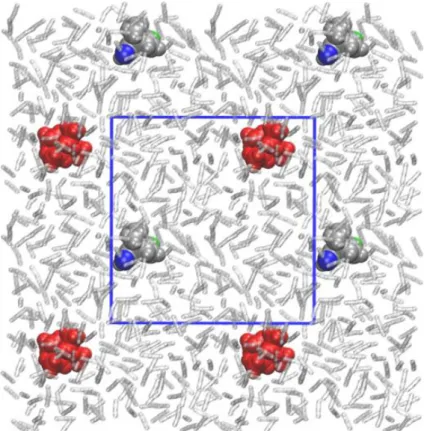
Figure 1. Molecular setup for the QM/MM-simulations: 1•– (grey space-filling model, oxygen atoms
in green and blue) forms the QM part, Et4N+ (red) and acetonitrile (512 molecules, transparent) forms
the MM part. The molality of the counterion is 0.01 m. Periodic boundary conditions apply to the simulation cell (length: 32 Å). The borders of the cell are shown (blue lines) as well as parts of the neighboring replicas.
2.2. Computer Simulations
2.2.1. Software
The QM/MM-based molecular dynamics simulations were carried out with the program CHARMM [23]. The analysis of the data was performed with the program WORDOM [24] and the python tool set Pynomarix [25]. Molecular visualizations were done with VMD [26].
2.2.2. Molecular Dynamics Simulations
The simulation setup is displayed in Figure 1. The QM/MM-Hamiltonian treated the radical anion with the semi-empirical SCC-DFTB method [27,28] and the remaining environment with CHARMM’s generalized force field CGenFF36 [29]. A cutoff value of 12 Ang was used for the short-range non-bonded interactions, and the long-range interactions were treated by Particle-Mesh Ewald. For attaining computational predictions, two independent simulations at 288 K and 203 K (according to the EPR experiments) were performed. The equation of motion was integrated with a time step of 0.5 fs (no SHAKE constraints were applied to bonds). The non-boned list was updated when needed (using CHARMM’s heuristic updating algorithm). Constant pressure (1 atm) and
temperature were maintained with Langevin piston masses of 500 ps−1 and 1000 ps−1, respectively. To achieve the effects based on diffusive encounters, the simulation was run for 150 ns. Snapshots were saved along the trajectory at every 100 fs. The subsequent quantitative analyses were performed only for the simulation at the higher temperature on the last 145 ns of the simulation (5 ns served as equilibration). The simulation at the lower temperature served for qualitatively confirming the predictions from the high temperature molecular dynamics (MD) simulations.
2.2.3. Thermodynamic Analysis
The 1,450,000 snapshots from the MD trajectory at 288 K were overlaid to minimize the
root-mean-square deviation between the coordinates of 1•–. The resulting distribution of counterion
positions (nitrogen atoms only) was then symmetrized and binned with a small grid size of 0.25 Å
into two dimensions (d1 and d2). The population of the bins was translated into the free-energy
surface using the usual Boltzmann weighting. Lowering the bin size to 0.125 Ang leads to the same free energy barriers for the relevant transition state. A converged free energy profile is obtained for a simulation length of at least 100 ns (Supplementary Table S1).
2.2.4. Kinetic Analysis
A kinetic network analysis was performed for the MD trajectory at 288 K using a Markov clustering (MCL) algorithm [30]; for a detailed description of this approach, see Gfeller et al. [31]. Here, only the essence of the analysis is given; the accessible topological configuration space of the system is discretized into cells based on measurable order parameters. Every snapshot of the trajectory is assigned to one of the cells. Each cell is considered as a microstate of a Markov model. Transition probabilities for going from one microstate to another for a specific lag time are calculated from the sequence of microstates on the MD trajectory. The lag time should be sufficiently large to ensure Markovian conditions, but small enough to resolve the relevant time scale. The M groups microstates into nodes of a network depending on the chosen granularity parameter. Mean first passage times for the connection between two nodes can then be extracted for this reduced network using a Brownian walker.
For our system, we discretized the configurational space with three order parameters. Beside
the two obvious order parameters d1 and d2, we used the dihedral angle
N(Et4N+)-O(green)-O(blue)-M, where M is the midpoint of the two methyl carbon atoms of the
radical anion. With these three order parameters the position of the counterion center relative to the radical anion is unambiguously defined. For d1 and d2, we used a cutoff of 15 Ang, that is, all distances beyond this value were considered the same as the cutoff value. This was done to reduce the number of microstates describing the unbound states. The distances were discretized into 10 bins, and the dihedral angle into 36 bins so that the 1,450,000 snapshots were distributed into 3600 cells (microstates). Transition probabilities were calculated for a lag time of 1 ps. We also tested values of 0.1 ps and 10 ps, yielding essentially the same result for the granularity level of interest (see below). Using the MCL, the number of nodes was monitored as a function of the granularity parameter (Supplementary Figure S1A). We see the formation of two plateaus at granularity values of 1.2 and 1.3 with three and seven nodes, respectively. Mean first passage times (mfpt) were
extracted using a Brownian walker simulation of 107 steps. The smallest mpft of the lower-resolved
network (granularity value of 1.2) is already significantly smaller than the time resolution of the EPR experiments, so we present in the main text only the result for the network with three nodes. Supplementary Figure S1B presents the properties of the higher-resolved network with seven nodes. The rotational correlation time of the radical anion was determined by calculating the time correlation functions for three vectors corresponding to the carbon bonds tert-C−C(3), tert-C−C(4), and tert-C-C(Methyl) using CHARMM’s CORFUN module. Fitting the correlation functions with a bi-exponential function yields a fast and slow correlation time for each vector. The mean value of the slow correlation time is given as rotational correlation time in the section “Results”.
3. Results
3.1. Temperature-Dependent EPR Experiments
The electrolytic generation of 1•– allows precisely controlling the character and the
concentration of counterions for EPR experiments. With respect to the radical species, the counterions are in large excess, thus bimolecular encounters between radical species and counterions follow pseudo-first order kinetics [32]. The temperature-dependent dynamic exchange (two-jump model) in solution between the two chemically identical topologies forms the ground of this study. It is analyzed in terms of line-shape analysis based on Redfield theory [33].
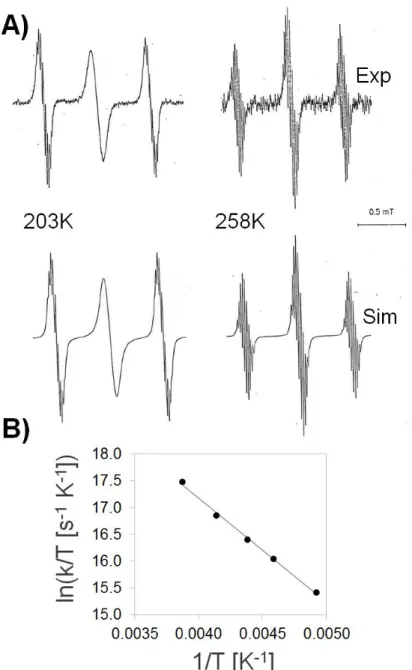
Cathodic reduction of 1 in acetonitrile afforded EPR spectra that are sufficiently resolved to allow a clear cut-distinction of the corresponding species. At high temperatures, the dominating pattern is triplet-like (somehow deviating from the 1:2:1 ratio), which is further split into multiplets (Figure 2A, right). This EPR signal is produced by the coupling with the unpaired electron with three
sets of 1H nuclei. The largest hfc of 0.57 mT is attributed to the two protons at the 3 and 6 position,
whereas the substantially smaller hfcs of 0.04 and 0.02 mT are assigned to the protons at C(2)/C(5) and the 3a/6a methyl groups, respectively.
The intensity distribution of the EPR lines is strongly dependent on the temperature. The triplet almost reaches a 1:2:1 intensity ratio at 258 K. However, it reversibly alters with lowering the temperature. At 203 K (before the solution freezes), the central line becomes markedly broadened (Figure 2A, left). These alternating line widths can be traced back to electron localization/delocalization phenomena between the two equivalent, non-conjugated 2-en-1-one moieties. At high temperatures, the exchange between the two topologies of Scheme 1 is faster than the time resolution of the experiment, thus the two 2-en-1-one moieties feature identical spectral properties (electron delocalization). At low temperatures, however, the exchange rate reaches the EPR time scale and the electron localization starts being detectable. Using a two-jump model for electron delocalization (see Methods), the experimental EPR spectra can be simulated. An
Eyring–Polanyi plot (Figure 2B) of ln(k/T) (with k = 1/, where is the lifetime of the localized state)
versus 1/T yields an activation enthalpy of 3.8 kcal mol−1 and an activation entropy of 2.3 cal mol−1
K−1, matching those for similar previously-studied systems [32]. In that study, electron delocalization
was explained by a mechanism of counterion decomplexation from one side and recomplexation at the other side. The positive activation entropy was attributed to the increased flexibility of the two ions in the intermediate, unbound state. Such an interpretation neglects, however, the decrease of the solvent entropy upon dissociation of ionic particles.
The calculated rotational correlation times at 288 K and 203 K (as determined from the MD simulation, see below) are 2.5 and 19.6 ps, respectively, and thereby 100 times faster than the chemical exchange (see below) and significantly faster than the EPR time scale. This is in line with the observation that inhomogeneous line broadening owing to the lowering of the rotational motion is hardly visible in the experimental EPR spectra.
3.2. QM/MM-Based Molecular Dynamics Simulations
Our computational model treats 1•– semi-empirically (QM part), while the counterion Et4N+
and the solvent molecules (acetonitrile) are controlled by a force field (MM part, Figure 1). We performed the molecular dynamic simulations at two temperatures. The simulation at 203 K matches the lowest experimentally achievable temperature where exchange phenomena could be observed. At this low temperature, only a few exchange events can be expected in an affordable simulation time (i.e., 150 ns with our QM/MM-approach), which limits any quantitative analyses. Therefore, we decided to contrast this setup with a simulation temperature where sufficient statistics can be obtained for exchange events. From the experimental spectra at 258 K, we conclude that this temperature is still not high enough to reach the fast-exchange limit where both molecular moieties should appear as being equivalent at the EPR hyperfine time scale, representing a 1:2:1 ratio in the dominating triplet (see above). To reach the fast-exchange limit (not achievable experimentally), we thus set the high temperature to 288 K.
Figure 2. (A) EPR spectra obtained upon electrolytic reduction of 1 taken at 203 and 258 K (for
additional temperatures, see Supplementary Material). (B) Eyring–Polanyi plot for the following values of k (in MHz): 1000 (203 K), 2000 (218 K), 3000 (228 K), 5000 (242 K), and 10,000 (258 K). Linear regression yields a slope of −1939 K and an intercept of 24.92.
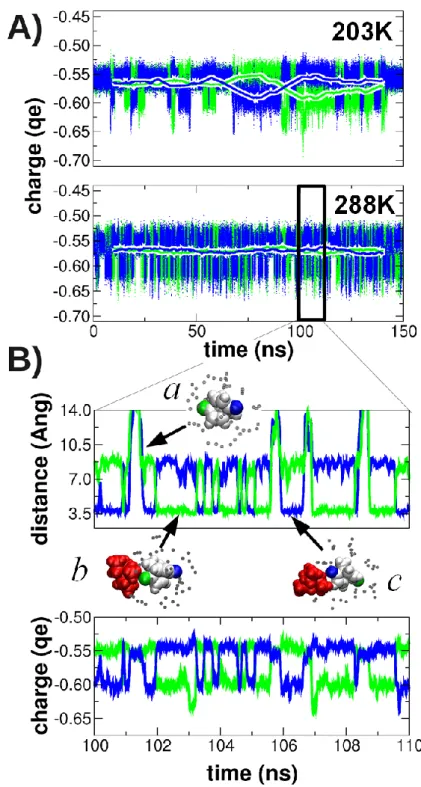
We first analyzed the dynamics of the charge distribution in radical anion 1•– by monitoring the
fluctuations of the atomic charge at the two oxygen atoms (Figure 3). The time scale of these charge fluctuations is distinctly different at 203 K and 288 K. This is clearly reflected by the thick lines in Figure 3A representing the time evolution of the charges at the two oxygen atoms when averaged over a window of 20 ns (≈ time resolution limit of the EPR experiment). At 203 K, charge exchange can well be detected (i.e., the thick blue and green lines form mirrored minima and maxima). This is in agreement with the EPR experiment that displayed line broadening at 203 K.
At 288 K, the charges are equally distributed at the 20 ns time scale (i.e., the two thick lines are flat), well in line with the assumption that, at this temperature, the fast exchange limit is reached. Figure 3B shows the oxygen charges and the oxygen−counterion distance at ten times higher time resolution. Here, it can be clearly seen that the charge fluctuations correlate with the binding and
unbinding of the counter ion to 1•–. When the counterion is not bound to the radical anion (both
oxygen/counterion distances are larger than 10 Å, see snapshot a), the atomic charge is identical for both oxygen atoms. Binding of the counterion to one of the oxygen atoms (snapshots b and c) polarizes the charge distribution; the oxygen atom in contact with the counterion lowers its charge by about 0.04 e, and the distant oxygen atom slightly increases its charge by 0.01 e.
Figure 3. (A) Time evolution of the charge on the two oxygen atoms (shown in blue and green) of 1•–
at 203 K and 288 K. Running averages are shown for windows of 1 ps (dots) and 20 ns (thick lines). (B) Enlargement of the cutout region (as indicated in subfigure (A)) for the evolution of the charge as well as the distance between the nitrogen atom of the cation and the oxygen atoms. Structures are
depicted (counterion in red, solvent nitrogen in grey, radical anion in white, with the two oxygens colored in blue and green) for selective snapshots (a,b,c).
It is remarkable that the transition between snapshots b and c (with the counterion bound once to each of the two "distinct" oxygen atoms) occurs without the unbinding of the counterion from the solvation shell (i.e., the counterion “slides” on the surface of 1•–, see Supplementary Video S1). It
even appears that the solvent-caged transitions are more probable than the unbinding and re-binding pathway involving penetration of the solvation shell.
Figure 4. (A) Counterion distribution around 1•–. The image shows 1•– in a ball-and-stick
representation and the relative position of the counterion (nitrogen atom) as red dots. States 1a–c and 2a–c are indicated as well as the the location of the transition state (*) for the counterion exchange between the two complexation sites (oxygen atoms) of 1•–. For better visibility, a rotating movie is
provided as Supplementary Video S2. (B) Free-energy surface for the complexation of NEt4+ to 1•–.
The relative free energy is projected on the distance order parameters d1 and d2 (as indicated in (A)). Figure 4 visualizes the probability distribution of the counterion position (central nitrogen
atom) relative to 1•–, revealing a considerable topological flexibility. There are six topological states;
three for each complexation site of the radical anion (1a–c and 2a–c). The transitions between the three states at the same complexation site (i.e., within 1a–c or within 2a–c) are very rapid (<100 ps), so we can consider them as a single state on the EPR time scale (nanoseconds); we group them into states 1 and 2, respectively. Snapshots b and c (Figure 3B) illustrate members of states 1 and 2. There is a funnel-like solvent-caged transition path for the counterion to pass from one complexation site to the other one; the transition state is marked by an asterisk in Figure 4A. This transition state is 3.2 kcal/mol higher in free energy than the basins 1 and 2 (Figure 4B). It is significantly lower in free
energy than the transition state of the decomplexation path (4.8 kcal mol−1).
The kinetics connecting the topological states was extracted from a kinetic network analysis of the MD simulation at 288 K using a Markov clustering algorithm (see Methods for more details). Accordingly, the kinetics can be described with a network of three nodes (Figure 5A): two nodes correspond to the topological states 1 and 2 (with complexed counterion), and the remaining cluster describes the unbound state 0. The unbound state is about five times less populated than the two complexed states. Thus, at the simulated salt concentration (which matches the experimental setup, 0.01 m), the EPR spectrum is dominated by states 1 and 2. The exchange between these two states can occur either through a fast or a slow route: the solvent-caged direct path features a mean first passage time (mfpt) of only 270 ps. The indirect path via decomplexation (mfpt: 3.6 ns) and recomplexation (160 ps) is more than ten times slower. This reflects the free energy difference of the transition states (3.2 vs. 4.8 kcal mol−1).
4. Discussion
From the molecular dynamics simulations, it can be observed that, for time scales larger than
100 ps, there are three topological states for the complexation between EtN4+ and 1•–. The most
populated states are those where the counterion is directly bound to one of the two oxygen atoms. The fastest transition between those two states occurs via a solvent-caged transition state. The observation that mainly only two states (1 and 2) are populated and that the exchange between these two states occurs predominantly by a single path justifies the use of a two-jump model for the analyses of the experimental spectra (see above). More importantly, the extracted thermodynamic data from the experiment can be directly associated to the solvent-caged exchange path as determined by the simulation. With the experimental values of the activation enthalpy and entropy (H# = 3.8 kcal mol−1, S# = 2.3 cal mol−1 K−1), a free energy of activation of 3.1 kcal mol−1 can be extrapolated to the simulation temperature at 288 K, which is in excellent agreement with the
observed value (3.2 kcal mol−1). The positive value of the activation entropy might seem
counterintuitive for a funnel-like transition path (which lowers the degrees of freedom of the counterion). We argue that the positive sign of the activation entropy is a result of the increased flexibility of the solvent: in the transition state, the ion pair features a smaller surface and thus has fewer solvent molecules bound than in states 1 and 2, especially the counterion and the side opposite to the methyl groups of the radical anion (i.e., close to the tert-carbon atoms) are lesser solvated in the transition state (see Figure 5B).
With Eyring’s equation [34], we find that the decrease of the temperature from 288 K to 203 K decreases the exchange rate by a factor of about 15. Thus, the passage time for the solvent-caged transition should increase from 270 ps at 288 K to about 4 ns at 203 K. Indeed, the simulation at 203 K
reveals transition times on this time scale (Figure 3A) in agreement with the corresponding EPR line broadening upon lowering the temperature.
It is tempting to discuss the formal charge exchange between the two 2-en-1-one moieties of
radical anion 1•– in terms of an intramolecular electron transfer, especially owing to laureate’s
milestone contributions in this field [35,36]. In our case, the transfer is between a donor and acceptor state with identical free energy. The rate-limiting step is the reorganization of the chemical
environment (counterion). Marcus’ theory [37] would yield a reorganization energy of about 12.5
kcal mol−1 (G# = 3.1 kcal mol−1 = /4 because G = 0). However, electron transfer theories rely on the
fact that the transfer rate is controlled by vibronically coupled events, and that there are now slow gating processes that are rate-limiting. The latter applies to our case though. The negative charge is gated by the solvent-caged exchange of the positively charged counter ion. Thus, the formal charge transfer between the two 2-en-1-one moieties is probably best described by conventional transition state theory (Eyring’s equation), as is done above.
Figure 5. (A) Kinetic network extracted from the analysis of the molecular dynamics (MD)
simulation at 288 K. The population of the nodes (in %), the mean first passage times (in ps and ns), and the corresponding topological states (underlined numbers) are indicated. (B) Radial distribution functions of the solvent–radical anion interaction for nodes 1 and 2 and the transition state (TS) (as indicated in Figure 4).
In conclusion, we have shown a proof of the concept that all-atom molecular dynamics simulations, when validated against experimental data, provide unique insights into the structural, thermodynamic, and kinetic characteristics of topological processes in ion pairs. Our results indicate
that even a simple system like 1•–/Et4N+ shows an unexpectedly rich variety of dynamically interchanging molecular topologies with distinct electronic properties. Their lifetimes vary between picosecond and nanoseconds. In reactions involving ion pairs, various reaction pathways become imaginable—it depends on the kinetics of follow-up reactions. Their course can potentially be controlled by the concentrations of substrates. For more complex charged molecules, the structures of ion/counterion arrangements very likely become more complex, but, more importantly, they may achieve substantially longer lifetimes. This enhances the reaction energy hypersurface and increases the palette of feasible reaction pathways. In these terms, our results suggest that just changing the concentrations of reactants in reactions involving ion-paired species may lead to the observation of unexpected products.
Supplementary Materials: The following are available online at www.mdpi.com/xxx/s1, Table S1: Dependence
of the free-energy profile on the simulation time; Figure S1: Kinetic network with seven nodes; Figure S2–S6: EPR spectra and their simulation at five different temperatures; Video S1: Transition path for counterion exchange; Video S2: Rotating 3D counterion distribution.
Author Contributions: Conceptualization, G.G. and M.S.; experiments, H.Q.; computer simulations, M.S.;
analysis of experiments, G.G.; analyses of computer simulations, M.S., writing, G.G. and M.S.; visualization M.S.; funding acquisition, G.G and M.S. All authors have read and agreed to the published version of the manuscript.
Funding: This research was funded by the Grand Equipement National de Calcul Intensif (GENCI), DARI grant
number x2015077214, and the interuniversity program in natural sciences, NAWI Graz.
Acknowledgments: M.S. thanks the Pôle Scientifique de Modélisation Numérique (PSMN) of the ENS Lyon for
computer time and Dr. Francesco Rao for help in using the software Pynomarix. G.G. thanks NAWI Graz for support.
Conflicts of Interest: The authors declare no conflict of interest. The funders had no role in the design of the
study; in the collection, analyses, or interpretation of data; in the writing of the manuscript, or in the decision to publish the results.
References
1. Rockl, J.L.; Pollok, D.; Franke, R.; Waldvogel, S.R. A Decade of Electrochemical Dehydrogenative C,C-Coupling of Aryls. Acc. Chem. Res. 2020, 53, 45–61.
2. Farney, E.P.; Chapman, S.J.; Swords, W.B.; Torelli, M.D.; Hamers, R.J.; Yoon, T.P. Discovery and Elucidation of Counteranion Dependence in Photoredox Catalysis. J. Am. Chem. Soc. 2019, 141, 6385–6391. 3. Chiarotto, I.; Mattiello, L.; Feroci, M. The Electrogenerated Cyanomethyl Anion: An Old Base Still Smart.
Acc. Chem. Res. 2019, 52, 3297–3308.
4. Li, G.C.; Brady, M.D.; Meyer, G.J. Visible Light Driven Bromide Oxidation and Ligand Substitution Photochemistry of a Ru Diimine Complex. J. Am. Chem. Soc. 2018, 140, 5447–5456.
5. Jiang, C.; Chen, W.; Zheng, W.-H.; Lu, H. Advances in asymmetric visible-light photocatalysis, 2015–2019. Org. Biomol. Chem. 2019, 17, 8673–8689.
6. Morack, T.; Muck-Lichtenfeld, C.; Gilmour, R. Bioinspired Radical Stetter Reaction: Radical Umpolung Enabled by Ion-Pair Photocatalysis. Angew. Chem.-Int. Ed. 2019, 58, 1208–1212.
7. Ravelli, D.; Protti, S.; Fagnoni, M. Carbon-Carbon Bond Forming Reactions via Photogenerated Intermediates. Chem. Rev. 2016, 116, 9850–9913.
8. Lim, C.H.; Ryan, M.D.; McCarthy, B.G.; Theriot, J.C.; Sartor, S.M.; Damrauer, N.H.; Musgrave, C.B.; Miyake, G.M. Intramolecular Charge Transfer and Ion Pairing in N,N-Diaryl Dihydrophenazine Photoredox Catalysts for Efficient Organocatalyzed Atom Transfer Radical Polymerization. J. Am. Chem.
Soc. 2017, 139, 348–355.
9. Zollitsch, T.M.; Jarocha, L.E.; Bialas, C.; Henbest, K.B.; Kodali, G.; Dutton, P.L.; Moser, C.C.; Timmel, C.R.; Hore, P.J.; Mackenzie, S.R. Magnetically Sensitive Radical Photochemistry of Non-natural Flavoproteins.
J. Am. Chem. Soc. 2018, 140, 8705–8713.
10. Zelenka, J.; Cibulka, R.; Roithova, J. Flavinium Catalysed Photooxidation: Detection and Characterization of Elusive Peroxyflavinium Intermediates. Angew. Chem.-Int. Ed. 2019, 58, 15412–15420.
11. Glatthar, R.; Spichty, M.; Gugger, A.; Batra, R.; Damm, W.; Mohr, M.; Zipse, H.; Giese, B. Mechanistic studies in the radical induced DNA strand cleavage-Formation and reactivity of the radical cation intermediate. Tetrahedron 2000, 56, 4117–4128.
12. Horibe, T.; Ohmura, S.; Ishihara, K. Structure and Reactivity of Aromatic Radical Cations Generated by FeCl3. J. Am. Chem. Soc. 2019, 141, 1877–1881.
13. Karplus, M. Development of Multiscale Models for Complex Chemical Systems: From H+H2 to Biomolecules (Nobel Lecture). Angew. Chem. Int. Ed. 2014, 53, 9992–10005.
14. Levitt, M. Birth and Future of Multiscale Modeling for Macromolecular Systems (Nobel Lecture). Angew.
Chem. Int. Ed. 2014, 53, 10006–10018.
15. Warshel, A. Multiscale Modeling of Biological Functions: From Enzymes to Molecular Machines (Nobel Lecture). Angew. Chem. Int. Ed. 2014, 53, 10020–10031.
16. Allendoerfer, R.D.; Martinchek, G.A.; Bruckenstein, S. Simultaneous electrochemical-electron spin resonance measurements with a coaxial microwave cavity. Anal. Chem. 1975, 47, 890–894.
17. Stoll, S.; Schweiger, A. EasySpin, a comprehensive software package for spectral simulation and analysis in EPR. J. Magn. Reson. San Diego Calif 1997 2006, 178, 42–55.
18. Zalibera, M.; Jalilov, A.S.; Stoll, S.; Guzei, I.A.; Gescheidt, G.; Nelsen, S.F. Monotrimethylene-bridged bis-p-phenylenediamine radical cations and dications: spin states, conformations, and dynamics. J. Phys.
Chem. A 2013, 117, 1439–1448.
19. Binsch, G. Unified theory of exchange effects on nuclear magnetic resonance line shapes. J. Am. Chem. Soc.
1969, 91, 1304–1309.
20. Heinzer, J. Fast computation of exchange-broadened isotropic E.S.R. spectra. Mol. Phys. 1971, 22, 167–177. 21. Gerson, F.; Huber, W. Electron spin resonance spectroscopy of organic radicals; John Wiley & Sons, Weinheim,
Germany, 2003;
22. Spichty, M.; Giese, B.; Matsumoto, A.; Fischer, H.; Gescheidt, G. Conformational dynamics in a methacrylate-derived radical: A computational and EPR study. Macromolecules 2001, 34, 723–726. 23. Brooks, B.R.; Brooks III, C.L.; Mackerell, A.D.; Nilsson, L.; Petrella, R.J.; Roux, B.; Won, Y.; Archontis, G.;
Bartels, C.; Boresch, S.; et al. CHARMM: the biomolecular simulation program. J. Comput. Chem. 2009, 30, 1545–1614.
24. Seeber, M.; Cecchini, M.; Rao, F.; Settanni, G.; Caflisch, A. Wordom: a program for efficient analysis of molecular dynamics simulations. Bioinformatics 2007, 23, 2625–2627.
25. Rao, F. PYNORAMIX is a fast and efficient python library to analyze water structure and dynamics.
https://github.com/ruvido/Pynoramix 2011. (accessed on 14 May 2016)
26. Humphrey, W.; Dalke, A.; Schulten, K. VMD–Visual Molecular Dynamics. J Mol Graph. 1996, 14, 33–38. 27. Elstner, M.; Porezag, D.; Jungnickel, G.; Elsner, J.; Haugk, M.; Frauenheim, T.; Suhai, S.; Seifert, G.
Self-consistent-charge density-functional tight-binding method for simulations of complex materials properties. Phys. Rev. B 1998, 58, 7260–7268.
28. Cui, Q.; Elstner, M.; Kaxiras, E.; Frauenheim, T.; Karplus, M. A QM/MM implementation of the self-consistent charge density functional tight binding (SCC-DFTB) method. J. Phys. Chem. B 2001, 105, 569–585.
29. Vanommeslaeghe, K.; Hatcher, E.; Acharya, C.; Kundu, S.; Zhong, S.; Shim, J.; Darian, E.; Guvench, O.; Lopes, P.; Vorobyov, I.; et al. CHARMM General Force Field (CGenFF): A force field for drug-like molecules compatible with the CHARMM all-atom additive biological force fields. J. Comput. Chem. 2010,
31, 671–690.
30. Van Dongen, S. Graph. Clustering by Flow Simulation; PhD Thesis; University of Utrecht, 2000.
31. Gfeller, D.; Rios, P.D.L.; Caflisch, A.; Rao, F. Complex network analysis of free-energy landscapes. Proc.
Natl. Acad. Sci. 2007, 104, 1817–1822.
32. Furderer, P.; Gerson, F.; Heinzer, J.; Mazur, S.; Ohyanishiguchi, H.; Schroeder, A.H. Esr and Endor Studies of a Radical-Anion with Formally Nonconjugated Keto Groups - Cis-10,11-Dimethyldiphensuccindan-9,12-Dione. J. Am. Chem. Soc. 1979, 101, 2275–2281.
33. Redfield, A.G. On the Theory of Relaxation Processes. IBM J. Res. Dev. 1957, 1, 19–31. 34. Eyring, H. The Activated Complex in Chemical Reactions. J. Chem. Phys. 1935, 3, 107–115. 35. Giese, B. Electron transfer in DNA. Curr. Opin. Chem. Biol. 2002, 6, 612–618.
36. Cordes, M.; Giese, B. Electron transfer in peptides and proteins. Chem. Soc. Rev. 2009, 38, 892–901. 37. Marcus, R.A. Electron Transfer Reactions in Chemistry: Theory and Experiment (Nobel Lecture). Angew
Chem Intl Ed. 1993, 32, 1111–1121.
© 2020 by the authors. Licensee MDPI, Basel, Switzerland. This article is an open access article distributed under the terms and conditions of the Creative Commons Attribution